
Key Highlights
-
Lighter (LIT) has dropped to a new all-time low near $2.05, extending its weekly decline to nearly 30% after the post-airdrop sell-off.
-
On-chain activity on Lighter.xyz is cooling, with lower user registrations, declining trading volume, and fewer trades compared to launch-week peaks.
-
Airdrop data shows 49% of distributed LIT has been sold, though over 27% of that supply has already been bought back, hinting at dip-buying interest.
-
On the 4-hour chart, LIT is forming a potential falling wedge, a structure that can precede a short-term relief bounce if support holds.
Lighter, the decentralized perpetuals exchange built on Ethereum Layer-2, has had a rough start to 2026. The project officially launched on December 30, 2025, alongside its native token $LIT, distributing 25% of the supply via an airdrop to early users. While the launch initially sparked strong excitement — sending LIT above the $4 mark — the rally was short-lived.
Within days, heavy selling pressure dragged the token down by nearly 20% in a single session. The decline didn’t stop there. By January 13, LIT printed a fresh all-time low around $2.05, extending its weekly losses to nearly 30%. The sharp correction appears to be driven by a mix of cooling on-chain activity and aggressive airdrop-related selling.
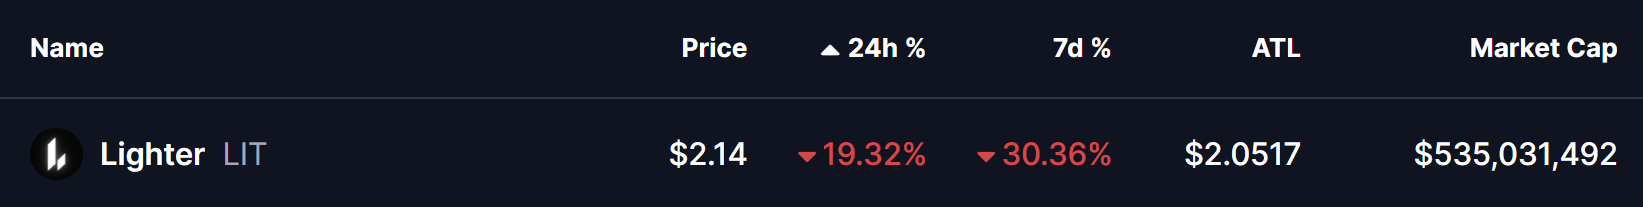
Source: Coinmarketcap
Cooling On-Chain Metrics Signal Fading Early Momentum
Recent on-chain data shared by crypto trader @KAIZ3NS shows a clear slowdown across Lighter’s core activity metrics. New user registrations, trading volume, and the total number of executed trades have all trended lower after peaking shortly following launch.
The user registration chart highlights a noticeable spike during the initial weeks, followed by a steady decline as January progressed. Similarly, both daily trading volume and trade count on Lighter.xyz have cooled significantly from their early highs. This slowdown likely reflects a familiar post-airdrop pattern, where short-term incentive seekers rotate capital to newer protocols offering fresh reward programs.
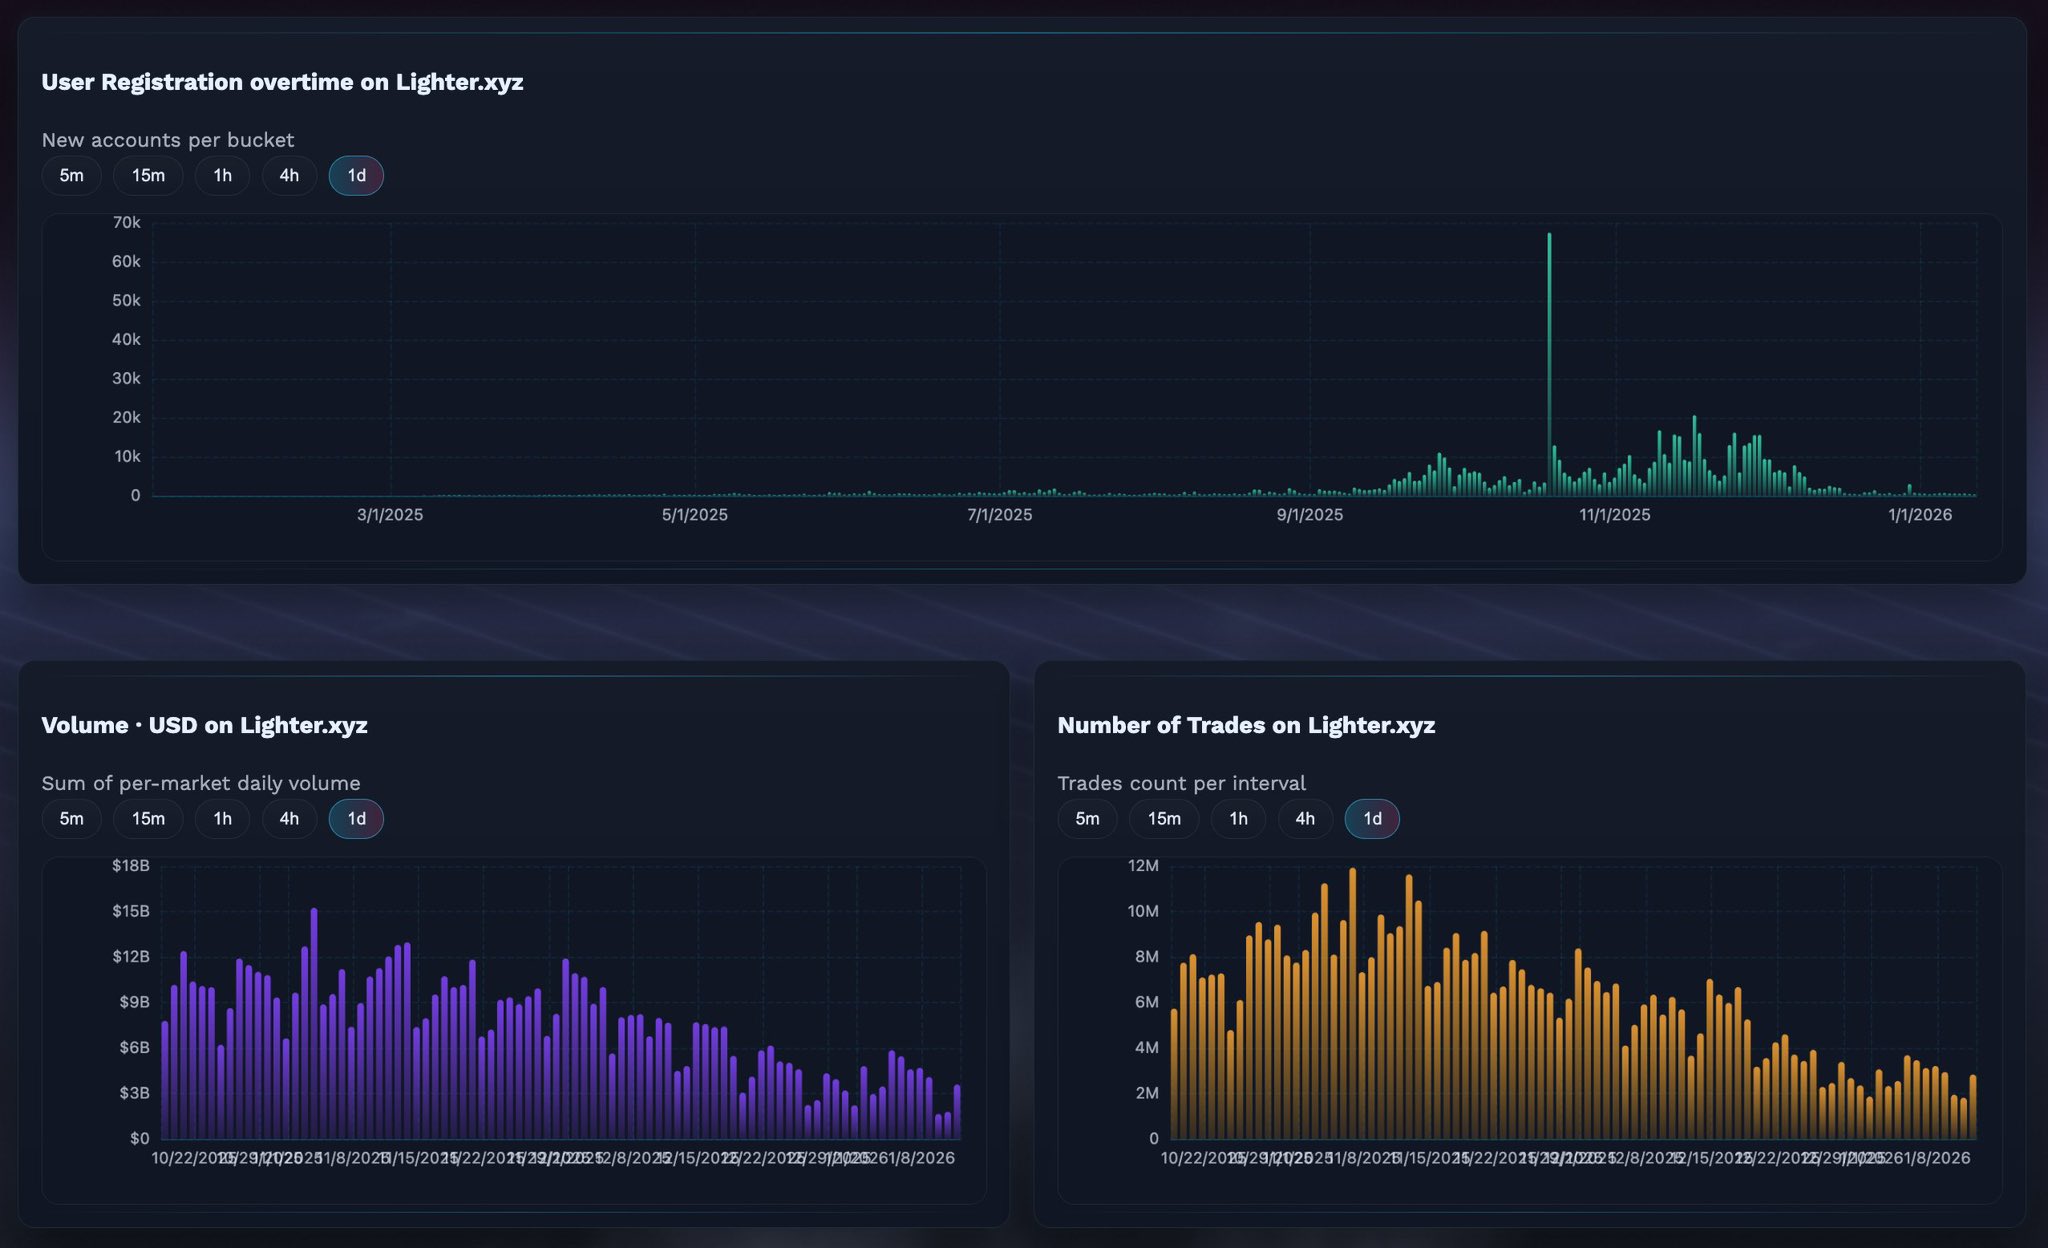
Lighter DEX Data/Source: @KAIZ3NS (X)
In simple terms, the early hype brought users in fast — but keeping them engaged has proven harder once the airdrop excitement faded.
Airdrop Selling Still Weighing on Price
Adding further pressure to LIT’s price is continued selling from airdrop recipients. According to live data from Qwantify, only 51% of the airdropped LIT supply is currently being held. The remaining 49% has been partially or fully sold.
Interestingly, the data also shows that selling hasn’t been entirely one-directional. Of the 49% that was sold, roughly 27.69% has already been bought back, suggesting that some traders are attempting to re-enter at lower levels rather than abandoning the token completely. Still, the net effect remains bearish in the short term, as distribution continues to cap upside momentum.
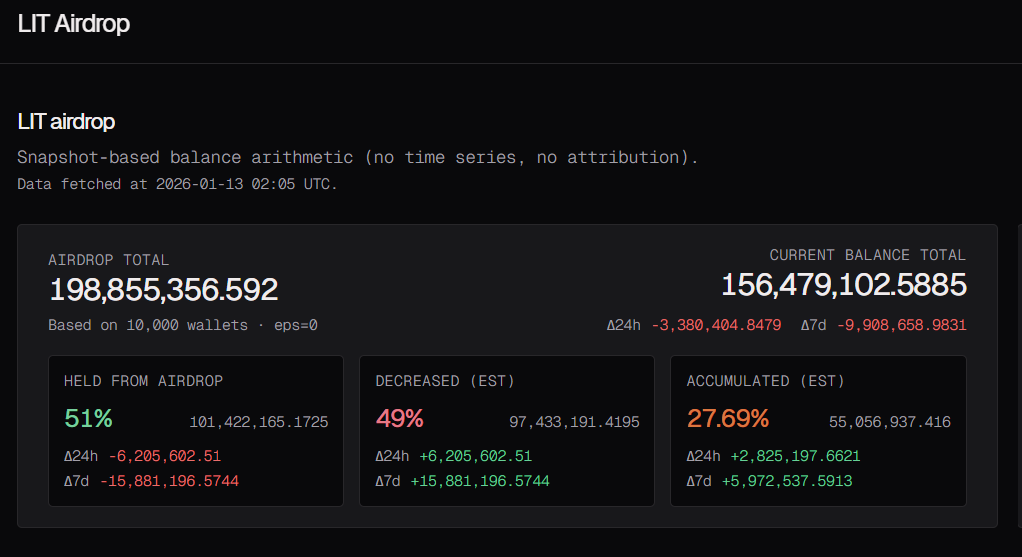
Source: qwantify
Can This Support Area Trigger a Relief Bounce?
Despite the weak fundamentals in the short term, the technical picture is beginning to show early signs of potential stabilization.
On the 4-hour chart, LIT appears to be forming a falling wedge pattern, a structure often associated with trend exhaustion during downtrends. The latest sell-off pushed price down to the $2.05 zone, an area that aligns with the lower boundary of the wedge and has started acting as tentative support.
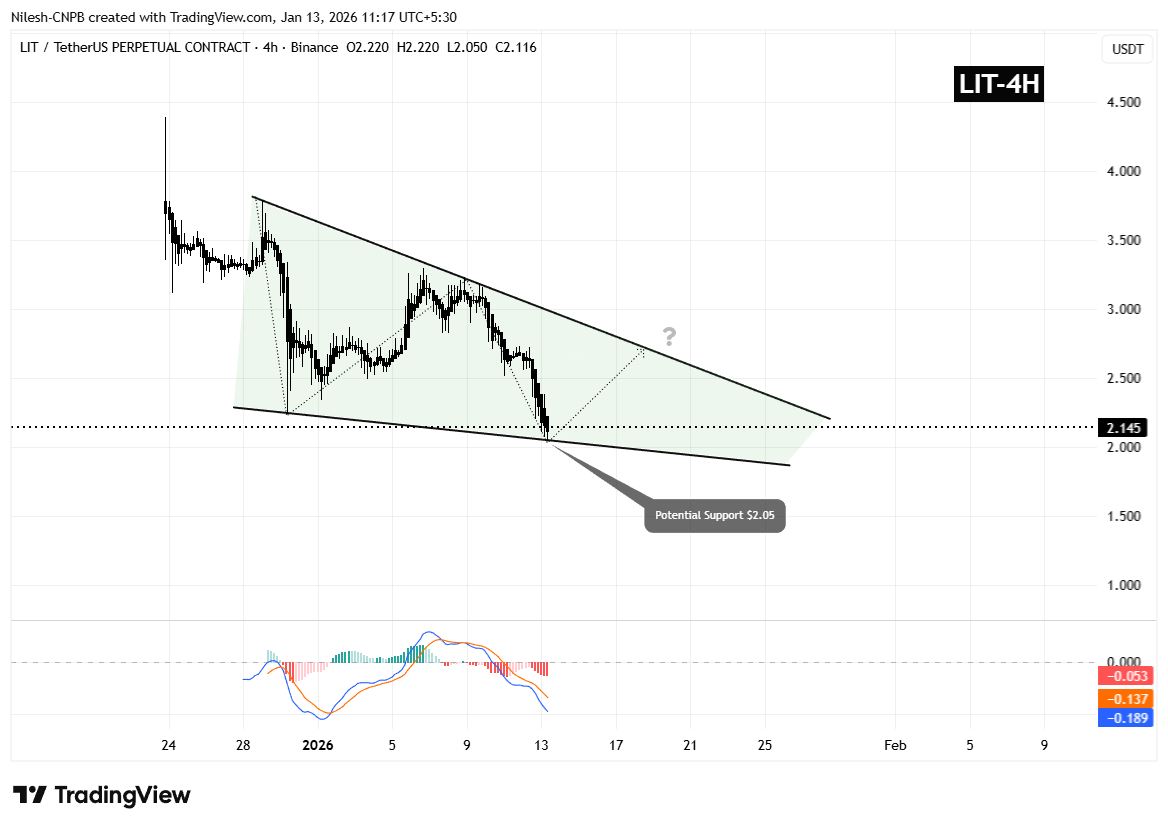
Lighter (LIT) 4H Chart/Coinsprobe (Source: Tradingview)
If buyers manage to defend this level, LIT could see a relief bounce toward the upper boundary of the wedge, which currently sits around $2.70–$2.75. Such a move would not imply a full trend reversal but could offer short-term recovery after weeks of sustained selling.
Momentum indicators are also hinting at a possible pause in downside pressure. The MACD on the 4-hour timeframe appears to be bottoming out, with bearish momentum gradually weakening. While this alone isn’t enough to confirm a reversal, it does support the idea that selling pressure may be losing steam near current levels.
Bottom Line
Lighter’s post-launch phase has been defined by a classic airdrop cycle: early hype, sharp distribution, and cooling on-chain activity. The drop to new all-time lows reflects real selling pressure rather than a single liquidation event. However, with a key support forming near $2.05 and technical momentum showing early signs of stabilization, LIT may be approaching a point where a short-term bounce becomes possible — provided broader market conditions don’t deteriorate further.
For now, LIT remains a high-risk, early-stage asset where sentiment can shift quickly. Whether this support holds or breaks will likely define the next major move.
Frequently Asked Questions (FAQ)
What is Lighter (LIT)?
Lighter is a decentralized perpetuals exchange built on Ethereum Layer-2, designed to offer low-cost and high-speed derivatives trading. LIT is its native utility token.
Why is the LIT price falling?
The decline is mainly driven by heavy airdrop-related selling and cooling on-chain activity, including fewer new users, lower trading volume, and a reduced number of trades.
How much of the LIT airdrop has been sold?
Roughly 49% of the airdropped LIT supply has been sold so far, although about 27.69% of that sold supply has already been repurchased.
Is LIT showing any bullish signs?
While the broader trend remains bearish, the MACD indicator is bottoming out, suggesting that downside momentum may be weakening near current prices.
Is this a good time to invest in LIT?
LIT remains a high-risk, early-stage asset. Traders and investors should wait for confirmation of support holding or a clear trend shift and always conduct their own research before making decisions.
Disclaimer: The views and analysis presented in this article are for informational purposes only and reflect the author’s perspective, not financial advice. Technical patterns and indicators discussed are subject to market volatility and may or may not yield the anticipated results. Investors are advised to exercise caution, conduct independent research, and make decisions aligned with their individual risk tolerance.
About Author: Nilesh Hembade is the Founder and Lead Author of Coinsprobe, with over 5 years of experience in the cryptocurrency and blockchain industry. Since launching Coinsprobe in 2023, he has been providing daily, research-driven insights through in-depth market analysis, on-chain data, and technical research.
Disclaimer: The information on this page may come from third parties and does not represent the views or opinions of Gate. The content displayed on this page is for reference only and does not constitute any financial, investment, or legal advice. Gate does not guarantee the accuracy or completeness of the information and shall not be liable for any losses arising from the use of this information. Virtual asset investments carry high risks and are subject to significant price volatility. You may lose all of your invested principal. Please fully understand the relevant risks and make prudent decisions based on your own financial situation and risk tolerance. For details, please refer to
Disclaimer.
Related Articles
Bittensor (TAO) Hits a 3-Month Peak: What Caused the Rally and What Comes Next?
Many leading cryptocurrencies have posted slight declines or negligible increases over the past 24 hours, but this isn’t the case for Bittensor (TAO), whose price soared by 15%.
The question now is whether this momentum can hold or if a pullback is coming next.
Further Gains
CryptoPotato31m ago
ETH falls 0.85% in 15 minutes: Exchange outflows and ETF trimming in sync amplify volatility
From 23:00 to 23:15 (UTC) on March 28, 2026, the price of ETH fluctuated downward within the range of 1,989.32 to 2,012.0 USDT, recording a return of -0.85%, with a volatility of 1.13%. During this period, market attention increased, and short-term fluctuations intensified, prompting traders to closely monitor the performance of key support zones.
The main driver of this volatility is the continuous outflow of ETH from major exchanges to on-chain wallets since March, with a total outflow of 31.6 million coins, leading to a contraction in exchange liquidity and causing prices to be sensitive to large orders. Meanwhile,
GateNews39m ago
Is the XRP Bottom Finally Here? 3 Massive Bullish Signals You Need to See
Although in a more modest manner, XRP whales have returned to the scene, amassing more tokens over the past week, which is categorized as the first bullish sign for the underlying asset.
Another could come in the form of the technical tool used to determine whether that asset’s move in either
CryptoPotato1h ago
Bitcoin’s Most Dangerous Pattern Just Triggered: Will BTC Dump to $26K Next?
Although bitcoin has already dumped by over 50% from its all-time high of over $126,000 marked in October to a multi-year low of $60,000, the asset’s troubles might not be over, warned Merlijn The Trader.
The popular analyst indicated that the “most dangerous bitcoin pattern just completed phase
CryptoPotato1h ago
Ethereum (ETH) on the Edge: Critical Level Stands Between New Bull Run and a Major Crash
While the second-largest cryptocurrency has registered a significant rebound over the past month, it remains at risk of plummeting to drastically low levels during this cycle.
On the other hand, some important indicators suggest that the worst might be over and the price could be gearing up for a m
CryptoPotato2h ago
Solana Price at $80 and Maxis Are Nowhere to Be Found – Analyst Says That Tells You Everything
Solana is down to $82 on the weekly chart. From the highs near $250, that’s a 77% drop. Crypto Patel asks “Where Are All The Solana Maxis Now?.” They told their followers to buy above $250, and screamed “to the moon” at the all-time high. Now the price is $80, and they’re silent. Not a single t
CaptainAltcoin2h ago
