
**Date: **Tue, Jan 06, 2026 | 11:20 AM GMT
The broader cryptocurrency market continues to show renewed strength as 2026 gets underway. Bitcoin (BTC) is up around 6% on the week, while Ethereum (ETH) has posted gains of over 8%, helping improve overall sentiment across the market. This positive momentum is now spreading into major altcoins — including** Algorand (ALGO).**
ALGO has already delivered a strong 22% weekly gain, but the more important development is unfolding beneath the surface. Recent price action suggests a clear structural shift is taking place, one that could mark the early stages of a sustained bullish continuation if a critical resistance zone is decisively cleared.
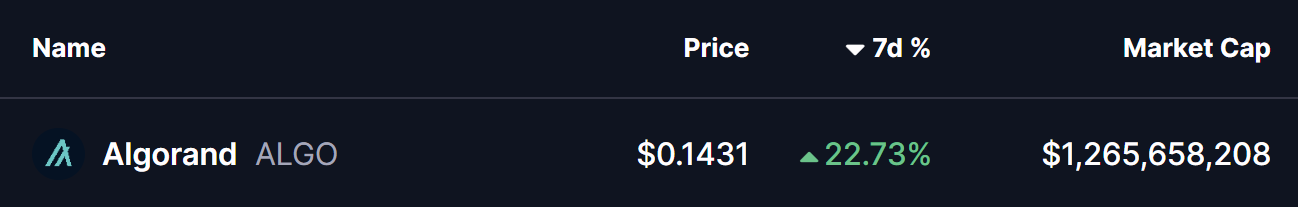
Source: Coinmarketcap
Right-Angled Descending Broadening Pattern in Play
On the 4-hour timeframe, ALGO had been trading inside a right-angled descending broadening formation — a bullish reversal structure defined by a flat overhead resistance and a rising lower boundary. For several weeks, price struggled to overcome the $0.1340–$0.1486 resistance band, with each rejection keeping ALGO locked in consolidation.
The recent rebound from the lower boundary of the structure marked a key turning point. Buyers stepped in aggressively, allowing ALGO to reclaim the 200-period moving average around $0.1225 — a level that had previously acted as dynamic resistance. This reclaim signaled improving momentum and a shift in short-term trend control.
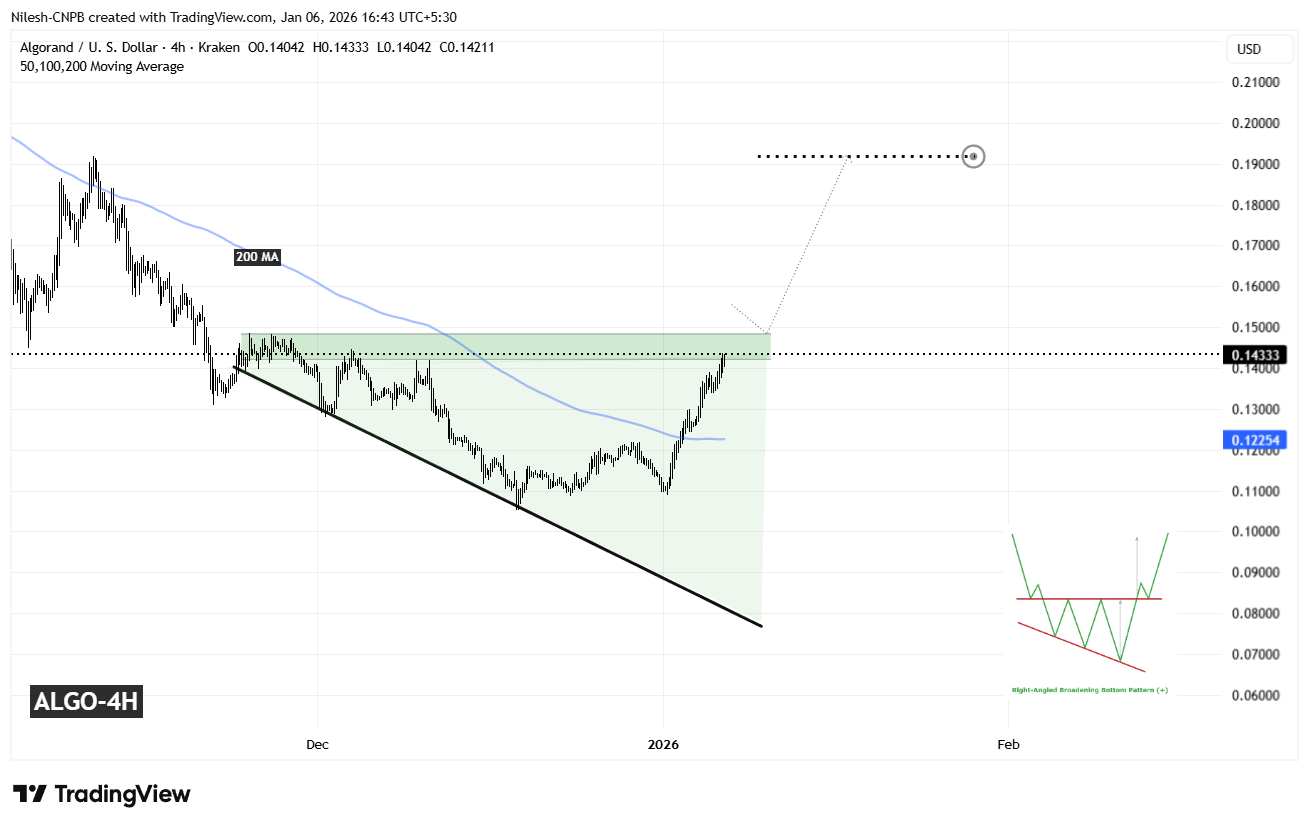
Algorand (ALGO) 4H Chart/Coinsprobe (Source: Tradingview)
Since then, ALGO has continued to push higher and is now pressing back into the same resistance zone that capped upside attempts in the past. This return to resistance places price at a critical inflection point where the broader trend direction could soon be decided.
What’s Next for ALGO?
A decisive close above the $0.1340–$0.1486 resistance zone would confirm a breakout from the descending broadening structure and validate the broader bullish reversal setup. Acceptance above this zone could attract fresh momentum participation and open the door to a stronger expansion phase.
Based on the depth of the formation and the projected measured move, the upside target points toward the $0.1920 region. Reaching that level would imply a potential upside of roughly 33% from current prices, aligning well with the typical behavior seen following successful breakouts from this pattern.
That said, patience remains important. Before any confirmed breakout, ALGO could still see short-term pullbacks — including a retest of the 200-period moving average, which has now turned into dynamic support. Such pullbacks would not invalidate the bullish setup as long as price continues to hold higher-low structures.
Until a clear breakout and follow-through occur, traders may want to remain cautious and avoid chasing price. The $0.1340–$0.1486 zone remains the key decision area that will determine whether Algorand transitions into a sustained bullish phase or continues consolidating as the new year unfolds.
Disclaimer: The views and analysis presented in this article are for informational purposes only and reflect the author’s perspective, not financial advice. Technical patterns and indicators discussed are subject to market volatility and may or may not yield the anticipated results. Investors are advised to exercise caution, conduct independent research, and make decisions aligned with their individual risk tolerance.
About Author: Nilesh Hembade is the Founder and Lead Author of Coinsprobe, with over 5 years of experience in the cryptocurrency and blockchain industry. Since launching Coinsprobe in 2023, he has been providing daily, research-driven insights through in-depth market analysis, on-chain data, and technical research.
Disclaimer: The information on this page may come from third parties and does not represent the views or opinions of Gate. The content displayed on this page is for reference only and does not constitute any financial, investment, or legal advice. Gate does not guarantee the accuracy or completeness of the information and shall not be liable for any losses arising from the use of this information. Virtual asset investments carry high risks and are subject to significant price volatility. You may lose all of your invested principal. Please fully understand the relevant risks and make prudent decisions based on your own financial situation and risk tolerance. For details, please refer to
Disclaimer.
Related Articles
Altcoin XRP Forms Elliott Wave on the Weekly Price Chart, Potential Bullish Divergence Ahead?
Altcoin XRP forms Elliott Wave on the weekly price chart.
A potential bullish divergence lies ahead for XRP price.
Can Ripple’s XRP go on to set a new ATH this year?
Several altcoins continue to show promising price pump indicators across their various price charts, allowing analysts t
CryptoNewsLand30m ago
BTC drops 0.52% in 15 minutes: Whale inflows to exchanges combined with insufficient liquidity amplify sell pressure
From 2026-04-17 10:15 to 2026-04-17 10:30 (UTC), the BTC price rapidly fell within the 75214.3 – 75725.9 USDT range. The cumulative return over 15 minutes was -0.52%, and the amplitude reached 0.68%. During this period, market sentiment shifted from cautious to bearish, volatility on the board increased, mainstream trading pairs saw an increase in主动 sell-side volume, buy-side acceptance became constrained, and overall trading activity declined significantly.
The primary driver behind this unusual move is that large holders (whales) concentrated their short-term inflows into exchanges. On-chain data shows that net inflows to addresses holding more than 1000 BTC per address changed from a steady state to a positive value, directly boosting exchange balances over the short term. Historical data indicates that whale inflows to exchanges are highly correlated with sell pressure in the medium to short term. In the same period, order book snapshots reflected a significant increase in the volume of主动 sell orders, and the成交价梯度 shifted downward, highlighting that weak market absorption capacity caused a short-term drop in price.
In addition, in the derivatives market, the long/short positioning structure tilted toward shorts. The number of主动 sell contracts exceeded that of buys in a short time, and rising pressure to close long positions further intensified the downtrend. Market liquidity overall was relatively weak; the number of active addresses over the past 10 minutes was only about 42k, and both fees and the mempool were near their lowest levels of the recent month. Against a backdrop of insufficient capital absorption, the marginal impact of large sell orders was amplified. On the macro front, the Federal Reserve’s monetary policy tightening and industry media repeatedly downgraded BTC’s near-term expectations led investors’ risk appetite to generally decline, creating a resonance at the level of market sentiment.
In the short term, it is still necessary to stay alert to liquidity risk and the price impact of one-way large transactions in specific trading pairs. Going forward, focus on key developments such as changes in whales’ on-chain holdings, exchange balances, and rebounds in activity metrics, as well as the potential impact of macro policy direction on risk assets. Relevant users should primarily guard against the risk of sharply amplified short-term price volatility and promptly track more market information.
GateNews2h ago
Popular Analyst Remains Aggressively Bullish on Crypto Prices, Predicts Parabolic Surges Soon
Popular analyst remains aggressively bullish on crypto prices.
The expert then predicts parabolic surges soon.
The move could spark dead coins into pumping heavily as well.
The crypto community continues to hold
CryptoNewsLand2h ago
RAVE, SIREN Rally Despite Manipulation Warnings
Rave DAO and Siren tokens surged to near all-time highs, facing volatility and liquidation risks. Concerns grew over potential market manipulation and supply concentration, particularly for RAVE. A new KuCoin listing boosted RAVE's visibility, despite inherent trading risks.
CryptoFrontier2h ago
ETH rises 0.65% in 15 minutes: ETF fund inflows and leverage long accumulation resonate to lift spot prices
Between 2026-04-17 09:15 and 2026-04-17 09:30 (UTC), ETH fluctuated within the 2351.53 to 2376.99 USDT range. The 15-minute return recorded +0.65%, with a swing of 1.08%. Within this range, buying pressure significantly strengthened, with trades dominated by medium-sized orders, which increased market attention and amplified short-term volatility.
The main drivers behind this anomaly are continued inflows of institutional capital into ETH spot ETFs, especially with cumulative net inflows over the past 4 days exceeding $212 million. On April 17 alone, the ETF added an additional $9.5 million in inflows, and spot buy orders expanded in sync within 15 minutes. Leveraged long positions in the derivatives market are the second-largest catalyst. From April 14 to 17, ETH futures open interest grew 26% week over week, indicating that capital via multiple paths is simultaneously betting on an upside move. The funding rate being neutral suggests the leveraged structure is temporarily healthy.
In addition, global macro market risk appetite has rebounded (geopolitical tensions easing, and the Federal Reserve keeping rates unchanged), driving a broad rebound across mainstream risk assets, and the crypto market has attracted liquidity accordingly. At the industry level, major financial institutions are advancing filings for ETFs and trust products. Mining companies have increased their ETH holdings and also maintained active staking activity, further reinforcing medium- to long-term market expectations. Multiple factors overlap and resonate, amplifying volatility. On-chain transfers remain generally stable, and there is no abnormal concentration of fund flows migrating between exchanges.
What needs attention is that although the current market is lifted by the resonance of institutional capital and leverage, the continuous growth of futures positions combined with the spot price failing to rise above the 2400 USDT area will bring the risk of forced liquidation. Meanwhile, if ETF subscription inflows slow down or macro liquidity reverses, ETH spot support could weaken. Please focus on tracking ETF net inflows, changes in futures open interest, the macro news backdrop, and nearby support and resistance levels, and stay alert to short-term volatility and potential abrupt adjustments. For more real-time market information, please keep watching.
GateNews3h ago
BTC up 0.58% in 15 minutes: exchange net outflows and ETF buy orders converge to lift the price
Between 2026-04-17 08:45 and 2026-04-17 09:00 (UTC), the BTC price surged in the short term. The candlestick return was +0.58%, with a price range of 75265.0 - 75862.3 USDT and a range of 0.79%. Market volatility increased and attention rose, with trading volume significantly higher than usual, reflecting a convergence between capital flow and technical signals.
The main driver behind this unusual move is the exchange’s net outflow of BTC in sync with ETF capital inflows. Data shows that within the past 24 hours, exchanges recorded a net outflow of 2,844.68 BTC
GateNews3h ago
