Polygon (POL) has been one of the strongest performers in the market over the past week. The POL price surged more than 50%, and at writing, it is trading around $0.1725, up another 3% on the day.
Trading volume is also up roughly 30%, confirming that the move is backed by real participation, not thin liquidity. The rally stands out even more because it happened while much of the broader market remained muted.
- What’s driving the POL price rally
- What the Polygon chart is showing
- What market indicators are saying
- What comes next for Polygon Price
What’s driving the POL price rally
A major catalyst came on January 5, when Polygon burned 3.2M POL tokens in a single day. This marked the largest burn event in the network’s PoS history.
Daily burns now average close to 1M POL, supported by more than $1.7M in fees generated year-to-date. With nearly all MATIC-to-POL migration completed, these burns directly reduce circulating supply and ease sell pressure.
Another key driver was the launch of Polygon’s Open Money Stack on January 9. It is intended to be supportive of global payments with stablecoins, and it already integrates with users such as Stripe and Revolut.
They are processing over $50M of stablecoin transactions on Polygon, and this underlines the idea that this announcement has more to do with actual usage as opposed to hype.
As pointed out by Hamza, Polygon was first in network revenue in the last seven days, and this further reinforces the positive sentiment.
What the Polygon chart is showing
On the 4H chart, the POL price clearly broke out of a long downtrend that had been in place for months. Price formed a base near the $0.10 area before accelerating sharply higher.
The move through the $0.15 zone was decisive, with strong momentum and little resistance until the $0.17–$0.18 range.
It has now started consolidation, given the initial surge, a little beneath current highs. It is a sign of health because buyers are defending gains rather than rushing to exit. As long as the POL price holds above the $0.15 level, the breakout structure remains intact.
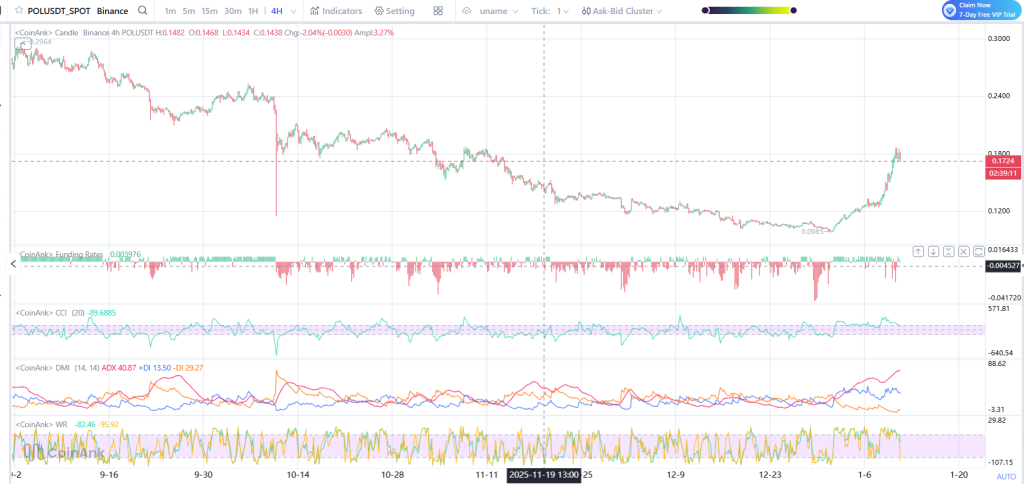
Source: Coinank
What market indicators are saying
Funding rates have flipped positive, but remain controlled. It implies that there is increasing bullish market sentiment without any indication of overcrowding.
CCI made deep inroads into overbought regions during this rally and has cooled off a little, which marks a corresponding phase of consolidation.
ADX has spiked, which indicates that the strength of the current trend forming in the market is genuine. Directional indicators also favor buyers, though momentum has slowed compared to the initial breakout.
Williams %R remains elevated, showing strong demand but also signaling that short-term pullbacks are possible. Overall, indicators support continuation as long as volume stays elevated.
Bittensor (TAO) Price Tests a Key Level That Could Change the Trend_**
What comes next for Polygon Price
In the short term, the $0.15 mark is critical support. Above it, the bullish pattern will remain intact.Resistance-wise, a clear breakout above $0.18 may open up the way towards $0.20, followed by $0.22.
A more substantial break below $0.15 may pull the price towards the $0.13-$0.14 regime for some consolidation.
Despite the recent rally, the POL price is still approximately 88% below the all-time high Price Level Value. That gap helps explain why buyers are stepping in now, especially with fundamentals shifting toward payments, burns, and real on-chain activity.
For now, Polygon’s move looks driven by utility and adoption, not speculation. Whether the rally continues will depend on sustained fees, burn rates, and follow-through from the Open Money Stack rollout.
Disclaimer: The information on this page may come from third parties and does not represent the views or opinions of Gate. The content displayed on this page is for reference only and does not constitute any financial, investment, or legal advice. Gate does not guarantee the accuracy or completeness of the information and shall not be liable for any losses arising from the use of this information. Virtual asset investments carry high risks and are subject to significant price volatility. You may lose all of your invested principal. Please fully understand the relevant risks and make prudent decisions based on your own financial situation and risk tolerance. For details, please refer to
Disclaimer.
Related Articles
On-Chain Analyst ZachXBT Flags 6 Altcoins for Suspicious Price Manipulation
On-chain analyst ZachXBT flagged six altcoins (SIREN, MYX, COAI, M, PIPPIN, RIVER) for suspicious price movements akin to the RAVE token case, urging exchanges to act swiftly against market manipulation to protect retail investors.
GateNews2h ago
BTC falls 0.44% in 15 minutes: ETF fund outflows and derivatives shorts add to the slide
From 21:45 to 22:00 (UTC) on April 19, 2026, the BTC price dropped by 0.44% within 15 minutes. The candlestick range was 74,366.1 to 74,789.3 USDT, with an amplitude of 0.57%. Short-term volatility was concentrated. During this period, the trading volume for large orders rose significantly, market attention increased, and volatility intensified.
The main driving force behind this deviation was that U.S. spot Bitcoin ETFs saw a large net outflow of $291 million over two days from April 18 to April 19. This reflected institutional funds pulling away in the short term, which led to a marked increase in sell pressure in the spot market. At the same time, BTC perpetual contract
GateNews2h ago
Dogecoin Holds $0.094 as X Cashtags Drive Market Attention
Key Insights
Dogecoin holds above $0.094 despite market weakness as Bitcoin and Ethereum stabilize, reflecting resilience and sustained demand across major cryptocurrencies during the consolidation phase.
X launches smart cashtags enabling real-time crypto and stock tracking, improving marke
CryptoNewsLand5h ago
Dogecoin Holds $0.09 Support as $0.10 Breakout Looms
Dogecoin remains around $0.09, showing limited movement as traders await a clear breakout direction. Key support is at $0.08, with resistance at $0.10. Current technical indicators suggest a balanced market, but a decisive move is needed to shift momentum.
CryptoNewsLand5h ago
XRP Price Clears $1.40 While Broader Downtrend Persists
XRP's recent rise above $1.40 indicates a shift in market behavior after a consolidation phase. While momentum indicators show improvement, the broader bearish trend persists, limiting upside potential. Sustained support is crucial for extending its recovery.
CryptoNewsLand6h ago
Chainlink Price Compresses Below $10 as Breakout Pressure Builds
Key Insights
Chainlink maintains higher lows within a tightening range, reflecting steady accumulation as buyers absorb selling pressure and prepare for a potential breakout move
Repeated resistance tests near $10 weaken supply levels while rising support strengthens demand, increasing the p
CryptoNewsLand6h ago
