**Date: **Sat, Jan 03, 2026 | 04:25 PM GMT
As 2026 kicks off, the broader cryptocurrency market is showing renewed stability. Ethereum (ETH) has reclaimed the $3,100 level, and momentum is gradually rotating into select altcoins — including World Liberty Financial (WLFI).
WLFI has jumped nearly 9% on the day, extending its weekly gains to around 16%, but the more important development is unfolding on the chart. On lower timeframes, price action is forming a well-defined bullish structure, suggesting that the token may be gearing up for a meaningful breakout if key levels are reclaimed.
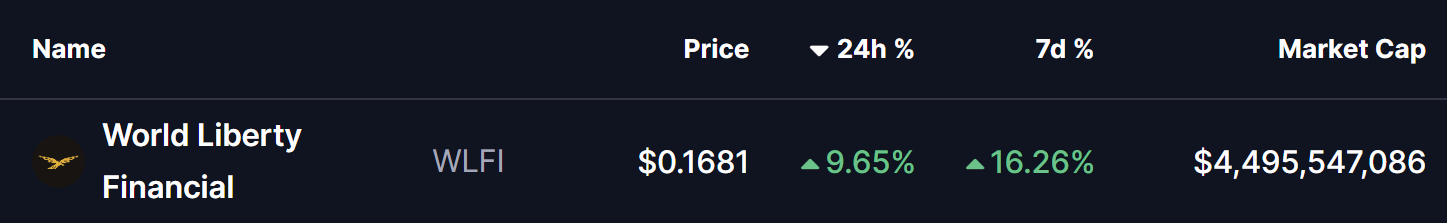
Source: Coinmarketcap
Ascending Triangle In Play
On the 4-hour chart, WLFI is forming a clear ascending triangle, characterized by a series of higher lows pushing steadily into a flat resistance zone. This pattern is widely viewed as a bullish continuation setup, especially when it develops during a prolonged consolidation phase accompanied by consistent dip-buying.
WLFI recently faced rejection near the $0.1741 resistance zone, which capped multiple upside attempts. That rejection pushed price back toward the rising support trendline, with buyers stepping in around the $0.1222 region. Importantly, each pullback has been shallower than the last, reinforcing the presence of strong underlying demand.
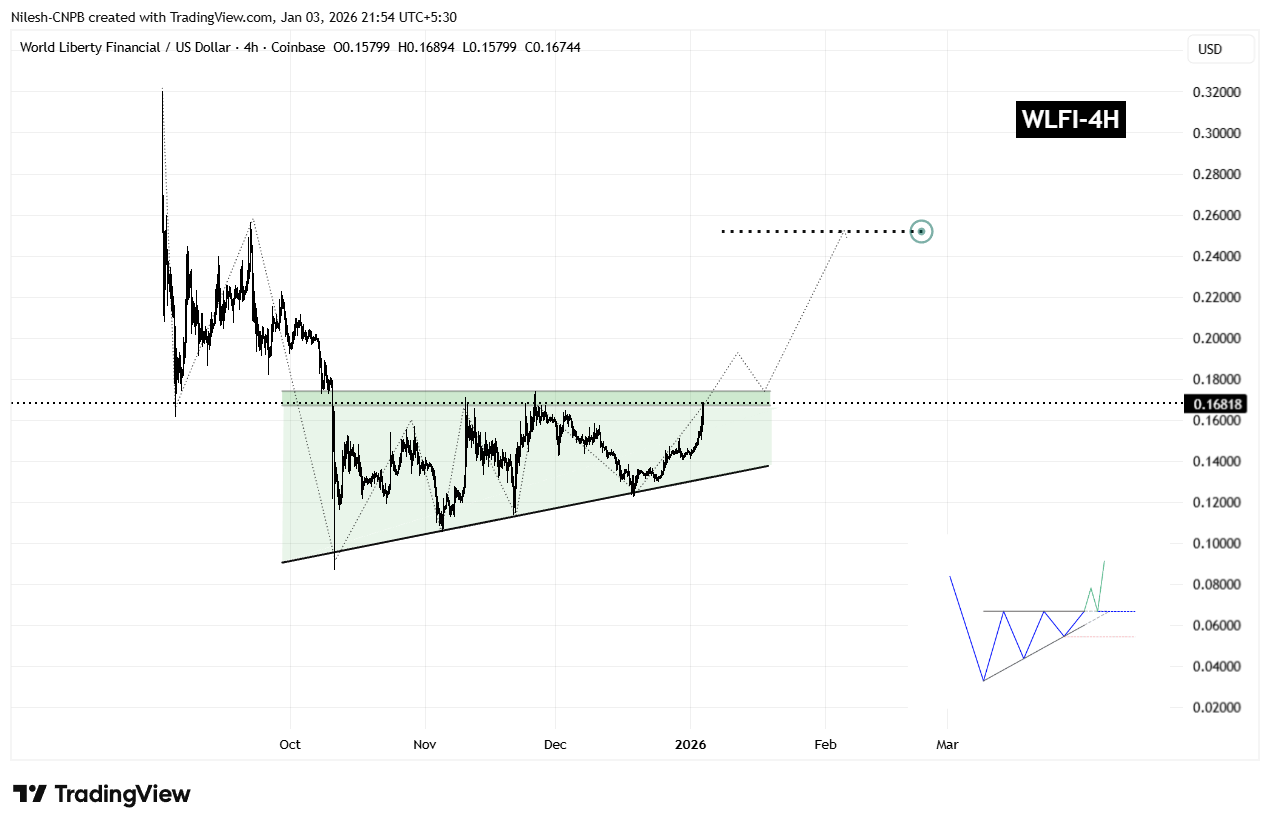
WLFI 4H Chart/Coinsprobe (Source: Tradingview)
The latest rebound has once again carried WLFI toward the upper boundary of the triangle, reinforcing the idea that demand remains firm. Rather than signaling weakness, this sideways-to-higher price action reflects healthy consolidation as volatility tightens ahead of a potential breakout.
What’s Next for WLFI?
From here, WLFI appears poised for another test of the $0.1741 resistance. A decisive breakout above this level, followed by a sustained close and a successful retest as support, would confirm the ascending triangle pattern and likely trigger a broader bullish expansion phase.
Based on the measured move of the formation, the technical upside projection points toward the $0.2522 region. This target represents a potential upside of roughly 48% from current levels and also aligns with prior price structure, strengthening the bullish case.
That said, caution remains warranted. If WLFI fails to break above resistance, price could once again rotate back toward the rising support trendline. As long as this trendline continues to hold, the broader bullish structure remains intact. A decisive breakdown below ascending support, however, would invalidate the pattern and delay any breakout scenario.
For now, the combination of improving market sentiment, steady accumulation, and a tightening ascending triangle suggests that WLFI is approaching a critical inflection point — one that could define its next major move as the new year unfolds.
Disclaimer: The views and analysis presented in this article are for informational purposes only and reflect the author’s perspective, not financial advice. Technical patterns and indicators discussed are subject to market volatility and may or may not yield the anticipated results. Investors are advised to exercise caution, conduct independent research, and make decisions aligned with their individual risk tolerance.
About Author: Nilesh Hembade is the Founder and Lead Author of Coinsprobe, with over 5 years of experience in the cryptocurrency and blockchain industry. Since launching Coinsprobe in 2023, he has been providing daily, research-driven insights through in-depth market analysis, on-chain data, and technical research.
Disclaimer: The information on this page may come from third parties and does not represent the views or opinions of Gate. The content displayed on this page is for reference only and does not constitute any financial, investment, or legal advice. Gate does not guarantee the accuracy or completeness of the information and shall not be liable for any losses arising from the use of this information. Virtual asset investments carry high risks and are subject to significant price volatility. You may lose all of your invested principal. Please fully understand the relevant risks and make prudent decisions based on your own financial situation and risk tolerance. For details, please refer to
Disclaimer.
Related Articles
XRP Eyes $1.60 as April History Shapes Market Expectations
Key Insights:
XRP historical April data shows sharp gains and losses, with 2021 marking a 180% surge while recent years reflect declining monthly performance trends.
Current price consolidation between $1.28 and $1.36 suggests reduced volatility, signaling a potential breakout as traders mon
CryptoNewsLand23m ago
Mainstream CEX and DEX funding-rate displays suggest an increasingly bearish market sentiment
On April 10, the Bitcoin price broke through $72k again. According to Coinglass data, the funding rates on major trading platforms show that the market’s bearish sentiment is strengthening. Funding rates are used to balance the contract price with the asset price; a rate below 0.005% indicates that the market is broadly bearish.
GateNews27m ago
Cardano Price Holds Gains as Bullish Signals Strengthen
Key Insights
Cardano trades above $0.25 as steady recovery continues, supported by improving sentiment and growing engagement across crypto discussions among market participants globally.
Derivatives data show rising long positions and positive funding rates, indicating traders
CryptoNewsLand28m ago
XRP Struggles Below $1.35 as Bearish Signals Build
XRP is under significant selling pressure after repeated rejections at resistance around $1.35. Weak momentum indicators and rising short interest suggest increased downside risk, with critical support at $1.30-$1.28. A break below this level could lead to further declines.
CryptoNewsLand33m ago
BTC 15-minute pump of 1.03%: integer-level breakout and macro risk-hedging resonance amplifying the move
From 2026-04-09 15:30 to 15:45 (UTC), the BTC return rate recorded +1.03%, with the price ranging from 71,291.5 to 72,226.9 USDT, and the amplitude reaching 1.31%. During the abnormal move, market attention rose rapidly, volatility noticeably intensified, and prompted investors to closely watch short-term trends.
The main driver behind this abnormal move was BTC breaking through the 72,000 USDT integer level at 15:34, which directly activated some algorithmic trading and drew short-term funds in. The rapid breakout above this key price level boosted spot and derivatives trading volumes in the short term
GateNews1h ago
Analyst: BTC $63k is the watershed between bulls and bears; multiple support levels form the entry range
Crypto analyst Ali Martinez says that current market volatility could provide cycle-level get on board opportunities, and has set multiple key price ranges based on on-chain data. The main support band is $63,111 to $70,685; if it breaks below, it could lead to a liquidity vacuum. In the long term, BTC is approaching its historical uptrend line, and it’s recommended to accumulate in batches.
GateNews4h ago
