
Injective (INJ) has reached a point where price action is starting to tighten. After months of drifting lower, INJ is now pressing against the end of a descending structure on the weekly chart.
That compression is happening right on top of a key support zone around $5.50–$6.00, which is why traders are paying closer attention again.
Elite analyst Globe Of Crypto shared on X that INJ is bouncing from support while trading near the apex of a descending triangle. When price runs out of space inside this kind of structure, it usually does not stay quiet for long.
_****ASTER Price Prediction 2026: The $10 Target Is Back on the Table**
What the Injective Chart Is Showing
The INJ price has been forming lower highs while repeatedly holding the same support area. That pattern has created a descending triangle, a structure that often resolves with a strong move once price reaches the end of the range.
Right now, INJ is doing exactly that. The distance between resistance and support has narrowed, leaving less room for sideways movement.
At the same time, price has started to react positively off support instead of breaking down, which shifts attention toward a possible upside resolution. This is not a breakout yet, but the setup is clearly maturing.
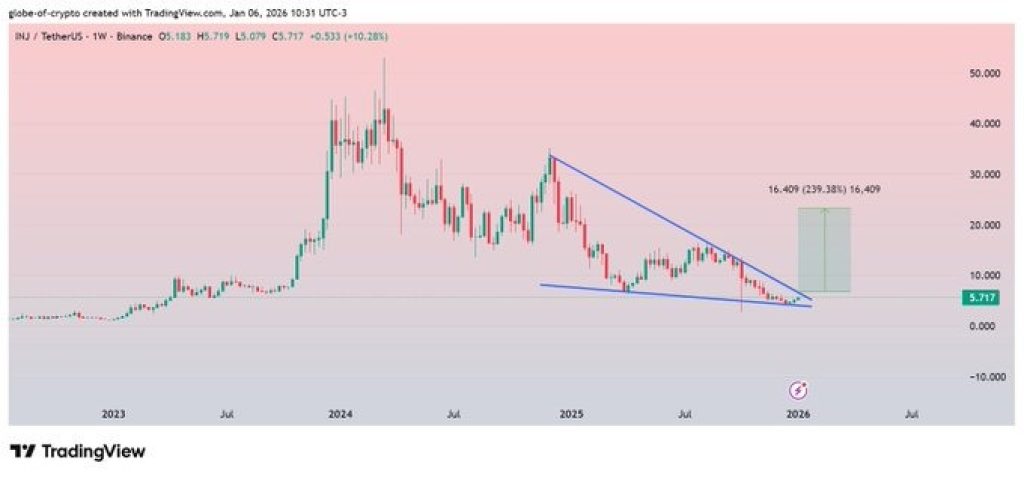
Source: X/GlobeofCrypto
Why This Zone Matters For INJ
Support has held multiple times on the weekly chart. Each test has attracted buyers, suggesting demand is still present even after a long downtrend. If sellers were fully in control, price would likely have broken lower by now.
Instead, the INJ price continues to defend this level while resistance slopes downward. That combination increases pressure. Eventually, one side has to give.
If INJ breaks out of the descending structure and holds above it, momentum could build quickly. There is little recent structure overhead, which is why some analysts are talking about a sharp expansion move if confirmation comes.
_****Here’s Why Dogwifhat (WIF) Price Is Pumping Hard Today**
Moves out of long weekly compressions tend to be fast, especially when price has already spent months resetting sentiment and shaking out weak positions.
Moreover, the setup only works while support holds. A clean weekly breakdown below the current base would invalidate the bullish scenario and reopen downside risk.
That level is the line traders are using to manage risk. Until price chooses a direction, patience matters more than prediction.
The INJ price is no longer drifting. It is compressing. The chart suggests price is approaching a decision point, where continuation or rejection becomes clear.
Whether the next move is up or down will depend on how price reacts as it runs out of room. What is clear is that INJ is close to making that decision, and the market is watching closely.
_****BNB Price Keeps Grinding Higher – Here’s Why Dips Keep Getting Bought**
Disclaimer: The information on this page may come from third parties and does not represent the views or opinions of Gate. The content displayed on this page is for reference only and does not constitute any financial, investment, or legal advice. Gate does not guarantee the accuracy or completeness of the information and shall not be liable for any losses arising from the use of this information. Virtual asset investments carry high risks and are subject to significant price volatility. You may lose all of your invested principal. Please fully understand the relevant risks and make prudent decisions based on your own financial situation and risk tolerance. For details, please refer to
Disclaimer.
Related Articles
BTC 15-minute decline of 0.70%: Whale selling drives short-term pullback
2026-03-15 23:15 to 2026-03-15 23:30 (UTC), BTC price declined 0.70% in just 15 minutes, with a price range of 72464.7 to 73115.9 USDT and an intraday volatility of 0.89%. The anomaly occurred during the night when liquidity was lower, with concentrated short-term selling pressure triggering market attention, and price fluctuations notably intensified compared to daytime levels.
The primary driver of this anomaly was on-chain monitoring detecting multiple large BTC transfers flowing into exchanges, indicating that whales or institutions were conducting active selling operations, with selling pressure in liquidity
GateNews23m ago
Ethereum Eyes Bullish Breakout – Analysts Predict Potential Rally to $2,500 As Scarcity Increases
The cryptocurrency market is currently at a crucial technical juncture for ETH. The second largest digital asset is poised for a structural change, with Ethereum testing a critical resistance zone near $2,150 in mid-March 2026. A breakthrough above that level is the main signal technical analysts ne
BlockChainReporter51m ago
BTC 15-minute gain of 0.63%: ETF positive news combined with institutional fund inflows triggers breakthrough
From 2026-03-15 22:30 to 2026-03-15 22:45 (UTC), BTC rose 0.63% within 15 minutes, with a price range of 71926.4 to 72500.0 USDT and a volatility amplitude of 0.80%. During the same period, trading volume increased notably with buy-side dominance, market attention heated up, and fluctuation intensity exceeded the intraday average, reflecting rising sentiment and active short-term trading activity.
The main driver of this price movement is a macro positive catalyst: The US SEC released a positive statement regarding bitcoin ETF approval progress at 22:00, which directly bolstered
GateNews1h ago
Analyst Says Bitcoin Indicators Show Early Signs of Market Recovery
Stablecoin liquidity rose by ~$8B since February, signaling potential improved market trading conditions.
Inter-exchange Flow Pulse turned positive, indicating more Bitcoin moving to derivatives platforms.
Long-term holders retain ~79% of supply, showing gradual supply transfers rather
CryptoFrontNews3h ago
Dogecoin at a Turning Point — Will $0.094 Resistance Finally Break?
Dogecoin was trading between $0.0925 and $0.09173 with the price stabilizing around $0.0925.
The immediate $0.09443 resistance caps the current range. A move above this level could expand today’s trading activity.
Past historical price movements coincide with a number of trend support res
CryptoNewsLand4h ago
XRP Breaks $1.40 Resistance as Volume Surge Lifts Momentum
Key Insights
XRP surged past the $1.40 resistance after trading volume climbed nearly 13%, signaling renewed trader interest and stronger short-term momentum.
Ripple’s collaboration with Mastercard through the Crypto Partner program increased market attention as investors anticipate
CryptoNewsLand4h ago