
Date: Thu, Jan 01, 2026 | 06:00 AM GMT
As the new year 2026 begins, the broader cryptocurrency market is showing modest weakness, with both Bitcoin (BTC) and Ethereum (ETH) trading slightly in the red. Despite this soft start among major assets, select altcoins are managing to outperform — including Story (IP), the native token of Story Protocol, a dedicated Layer 1 blockchain focused on decentralized intellectual property infrastructure.
IP is in spotlight with a nearly 6% daily gain, trimming its heavy 60-day decline to around 61%. While the longer-term trend still reflects recovery mode, the more important development is unfolding on the daily chart, where price action is beginning to signal a meaningful structural shift. If this setup plays out as expected, it could mark the early stages of a bullish continuation despite broader market pressure.
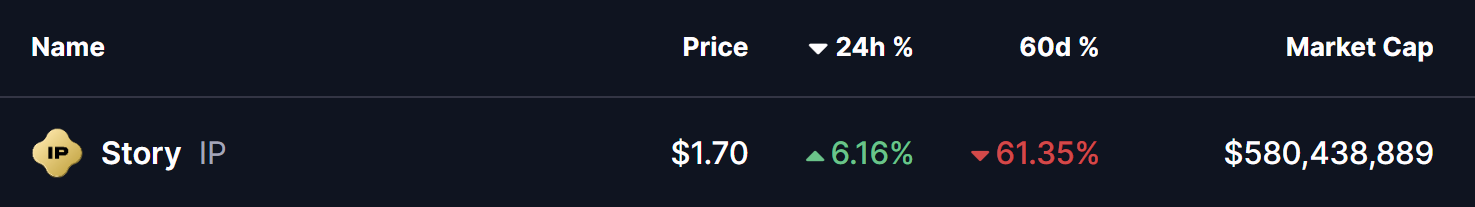
Source: Coinmarketcap
Rounding Bottom in Play
On the daily timeframe, IP appears to be forming a textbook rounding bottom pattern — a classic bullish reversal structure that typically emerges after an extended period of downside pressure. This pattern highlights a gradual transition from distribution to accumulation, where selling momentum fades and buyers begin to step in with increasing confidence.
Earlier in the trend, IP faced strong rejection near the $3.06 neckline zone, triggering a sharp and sustained decline through the final months of 2025. That sell-off eventually found a floor near the $1.42 level, which has since acted as a critical demand zone. Multiple defenses of this area prevented further downside and helped establish a solid base for a potential trend reversal.
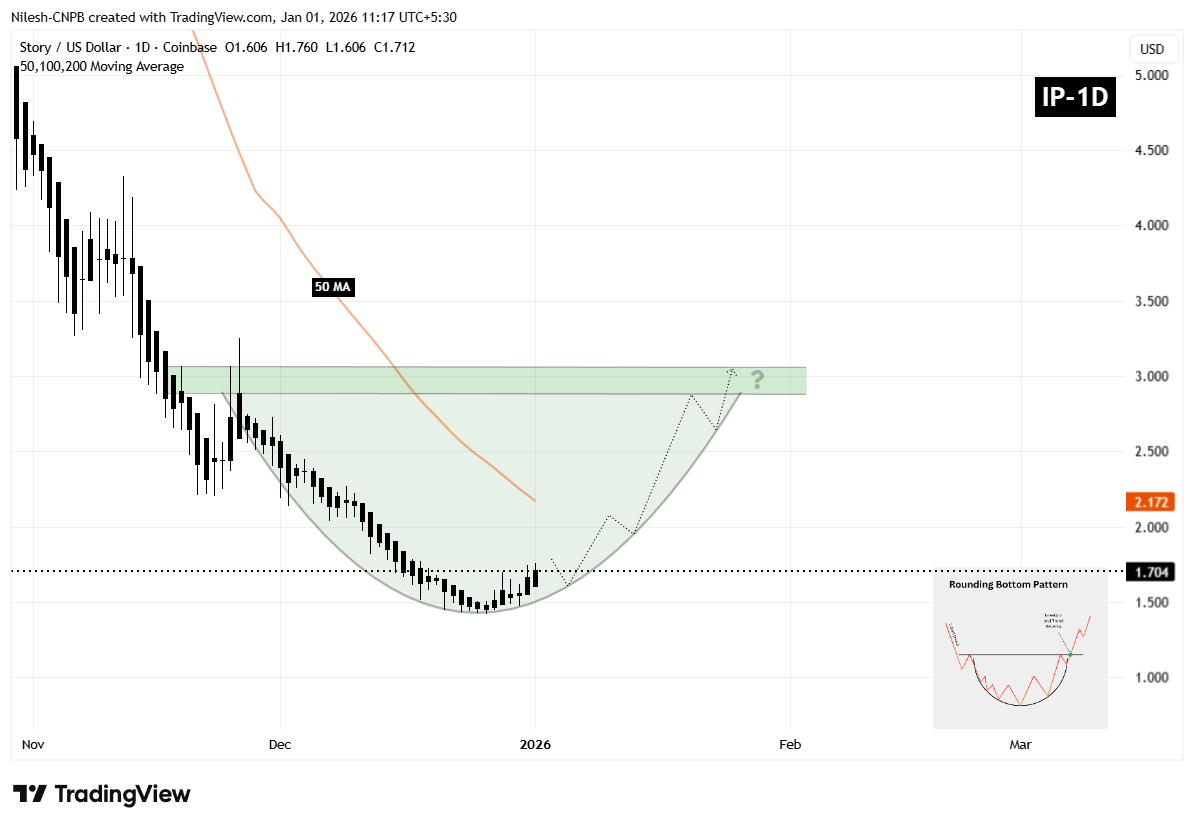
Story (IP) Daily Chart/Coinsprobe (Source: Tradingview)
Since setting that bottom, IP has begun curving higher in a smooth, rounded fashion. This type of price action suggests that selling pressure is no longer aggressive, and that accumulation is quietly taking place. The recent recovery back above the $1.70 region reinforces this view, signaling that the market may be positioning ahead of a larger directional move.
What’s Next for IP?
For the rounding bottom structure to gain confirmation, IP needs to reclaim the 50-day moving average, currently positioned near the $2.172 level. A sustained move above this zone would mark a notable shift in momentum and confirm that buyers are regaining control after months of corrective price action.
Beyond that, the most significant technical barrier remains the neckline resistance around $3.06. A clean and decisive breakout above this area would validate the entire reversal pattern and could open the door for a broader bullish expansion phase, with momentum traders and sidelined participants likely re-entering the market.
Until those levels are reclaimed, the pattern remains in development. Short-term consolidation or minor pullbacks remain possible if IP struggles near the 50-day moving average. However, as long as price continues to form higher lows and holds above the $1.42 base, the broader bottoming structure remains intact.
Overall, IP is approaching a technically important inflection point. The emerging rounding bottom formation, improving price structure, and proximity to key resistance levels suggest the coming sessions could prove decisive for Story’s next major directional move as 2026 gets underway.
Disclaimer: The views and analysis presented in this article are for informational purposes only and reflect the author’s perspective, not financial advice. Technical patterns and indicators discussed are subject to market volatility and may or may not yield the anticipated results. Investors are advised to exercise caution, conduct independent research, and make decisions aligned with their individual risk tolerance.
About Author: Nilesh Hembade is the Founder and Lead Author of Coinsprobe, with over 5 years of experience in the cryptocurrency and blockchain industry. Since launching Coinsprobe in 2023, he has been providing daily, research-driven insights through in-depth market analysis, on-chain data, and technical research.
Disclaimer: The information on this page may come from third parties and does not represent the views or opinions of Gate. The content displayed on this page is for reference only and does not constitute any financial, investment, or legal advice. Gate does not guarantee the accuracy or completeness of the information and shall not be liable for any losses arising from the use of this information. Virtual asset investments carry high risks and are subject to significant price volatility. You may lose all of your invested principal. Please fully understand the relevant risks and make prudent decisions based on your own financial situation and risk tolerance. For details, please refer to
Disclaimer.
Related Articles
$2.4 billion in stablecoin inflows to exchanges; market watch-and-wait sentiment heats up
According to on-chain analyst Darkfost's data, net inflows of stablecoins to major cryptocurrency exchanges reached $2.4 billion, indicating a reversal in capital flow trends. However, at the same time, spot trading volume plummeted from $81 billion to $3.5 billion, showing that investors have not converted these funds into position-building actions, which has instead created market fragility. The impact of the macroeconomic environment has led to a decline in market participation, and changes in market sentiment in the future may bring about significant volatility.
MarketWhisper5m ago
The Bitcoin market remains boring. Investors chasing yields may be partly to blame
Bitcoin has been range-bound around $70,000 due to factors like rising U.S. Treasury yields and investors using call options for yield, leading to a market mechanics that suppress price swings and volatility.
CoinDesk6m ago
Why is Bitcoin stuck at $70,000? Options strategies are the key suppressing force
Bitcoin’s recent price has been oscillating within a $65,000 to $75,000 range, influenced by geopolitical conflicts, the interest-rate environment, and institutional investors’ options strategies. Covered call option strategies limit upside breakout potential, resulting in reduced price volatility; the outlook going forward will depend on changes in capital allocation and the return of volatility.
GateNews9m ago
Is there a hidden concern behind the surge of TAO? Bittensor demand is strong, but risks are rising simultaneously.
The decentralized AI project Bittensor (TAO) has rebounded to around $330 since February 2026, with a weekly increase of over 20%, bringing its market capitalization to $3.17 billion. The current rise is driven by genuine demand, with spot trading volume recovering and market sentiment warming up, but risk signals are gradually increasing. Investors need to pay attention to market volatility and capital flows.
GateNews10m ago
Ethereum or plummet to $1,200? Analysts warn that a bull market trap has taken shape.
Crypto analyst Leshka.eth pointed out that the price of Ethereum is repeating a historical pattern, and if it breaks below the support level of $1990, it could face a pullback to $1200. Additionally, the tense macro environment and on-chain data indicate a lack of market confidence, but the increase in staking and the decrease in holdings may provide some support. The short-term trend depends on macro changes.
GateNews13m ago
Bitcoin recovers to $67,400 after dipping below $65,200 as Houthis enter Iran war
Bitcoin briefly dipped to $65,112 amid escalating conflict, the lowest since February, before recovering. Other cryptocurrencies also saw minor gains, but most are down weekly. Tensions from new fronts in the conflict and rising oil prices could impact inflation and economic conditions.
CoinDesk22m ago
