
Date: Sat, Dec 27, 2025 | 10:25 AM GMT
Dash (DASH), the privacy-focused token, has struggled alongside the broader altcoin market over the past month, shedding nearly 35% of its value amid persistent selling pressure. However, price action is now starting to stabilize, with DASH trading in the green today and posting a modest 4% recovery. More importantly, the latest chart structure suggests that the recent rebound may not be just a short-lived bounce, but part of a developing bullish setup.
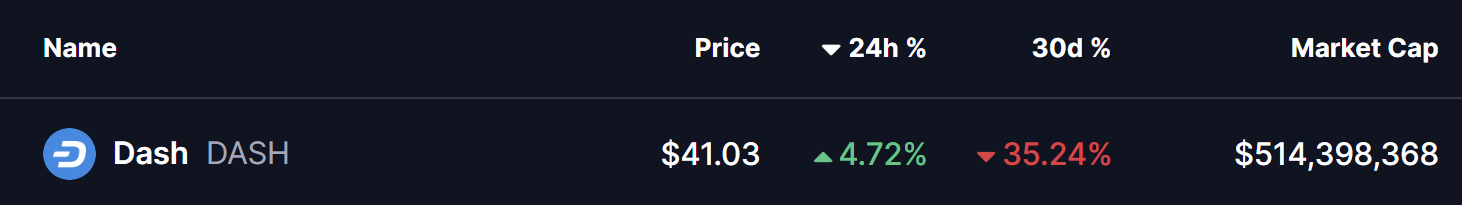
Source: Coinmarketcap
Harmonic Pattern Hints at Potential Upside
On the 4-hour timeframe, DASH is forming a Bearish Butterfly harmonic pattern. While the name may sound negative, this pattern typically allows for a strong upside move during its CD leg before price reaches the final reversal zone.
The structure began at Point X near $42.64, followed by a sharp decline into Point A. From there, DASH rebounded toward Point B, where sellers briefly reasserted control, before price dipped once again into Point C around $36.17. This region has since acted as a firm base, with buyers stepping in aggressively to defend the lows.
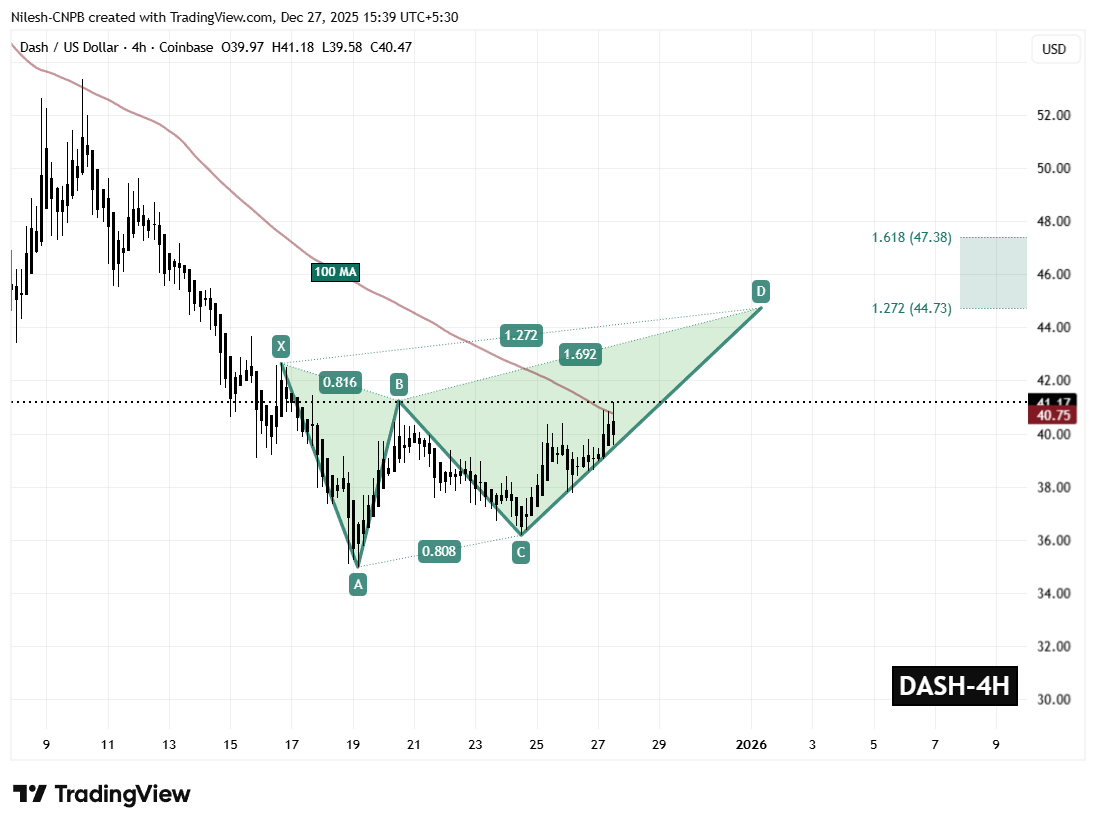
Dash (DASH) 4H Chart/Coinsprobe (Source: Tradingview)
From Point C, DASH has staged a steady recovery and is currently trading near $41.17. This move indicates improving momentum and suggests that the CD leg of the harmonic structure is actively unfolding.
Adding further strength to this setup is DASH’s successful reclaim of the 100-period moving average near $40.75. This level had previously acted as dynamic resistance throughout the downtrend, and flipping it into support marks a meaningful shift in short-term market structure.
What’s Next for DASH?
As long as DASH holds above the $39.58 support zone, the bullish harmonic structure remains intact. Continued strength above the 100 MA would likely reinforce buyer confidence and keep the CD leg in play.
If momentum persists, the Bearish Butterfly projection points toward the Potential Reversal Zone (PRZ) between $44.73 and $47.38. This area represents the typical completion zone for the pattern and offers an upside window of roughly 14% from current levels before sellers may attempt to regain control.
On the flip side, a breakdown below $39.58 would weaken the bullish outlook and risk invalidating the harmonic structure. Such a move could expose DASH to renewed downside pressure and delay any sustained recovery attempt.
For now, DASH’s ability to hold above reclaimed moving average support and continue building higher lows will be critical in determining whether this recovery can extend further in the sessions ahead.
Disclaimer: The views and analysis presented in this article are for informational purposes only and reflect the author’s perspective, not financial advice. Technical patterns and indicators discussed are subject to market volatility and may or may not yield the anticipated results. Investors are advised to exercise caution, conduct independent research, and make decisions aligned with their individual risk tolerance.
Disclaimer: The information on this page may come from third parties and does not represent the views or opinions of Gate. The content displayed on this page is for reference only and does not constitute any financial, investment, or legal advice. Gate does not guarantee the accuracy or completeness of the information and shall not be liable for any losses arising from the use of this information. Virtual asset investments carry high risks and are subject to significant price volatility. You may lose all of your invested principal. Please fully understand the relevant risks and make prudent decisions based on your own financial situation and risk tolerance. For details, please refer to
Disclaimer.
Related Articles
Cardano Traders Watch $0.243 Support Level as ADA Price Faces Critical Decision
Cardano (ADA) is at a crucial support level of $0.243, with potential gains to $0.30 if it holds. A daily close below this could lead to declines toward $0.10. Currently, trading volume is around $500 million, with ADA notably below its all-time high.
GateNews1h ago
ETH/BTC Price Ratio Rebounds to 0.0313 in Q1 2026 as Ethereum User Base Surges 82%
In Q1 2026, the Ethereum-to-Bitcoin price ratio reached a three-month high at 0.0313. Ethereum added 284,000 users and surpassed $180 billion in stablecoin supply. Bitcoin remained strong above $74,000, driven by significant ETF inflows.
GateNews6h ago
Why is Bitcoin up today? Trump says Iran is seeking a truce, and risk assets move higher across the board
On April 15, Bitcoin rebounded about 6% after Trump said Iran is seeking to reach an agreement, breaking above $75,000. Expectations for the resumption of U.S.-Iran negotiations warmed up, lifting Asian stock markets. Technically, roughly $6 billion worth of short positions were forced to close, accelerating the rebound. Analysts said that if the U.S.-Iran situation continues to ease, Bitcoin could break through $80,000, and they predicted it may reach $150,000 by year-end.
MarketWhisper10h ago
Bitmine is promoted to the NYSE main board! Tom Lee: US stocks may be at a bottom, and selling pressure on Ether could ease
Bitmine officially transferred from the NYSE American market to the main board, marking a significant milestone for the company. Despite a sharp drop in its share price, it still increased the share repurchase program to $4 billion. The company holds a large amount of Ether, and expects that a rebound in the crypto market will help improve its assets and share price performance.
CryptoCity10h ago
ETH 15-minute up 0.66%: On-chain large transfers in sync drove a net inflow of funds, boosting spot buying pressure
2026-04-15 00:00 to 00:15 (UTC), ETH shows a local anomaly. The 15-minute return rate is +0.66%. The trading price range is 2321.93–2343.2 USDT, with a range of 0.92%. During this period, market attention increased, volatility slightly intensified, buy pressure in the order book shifted upward in the short term, and quickly pushed spot prices up into a key resistance area.
The main drivers of this anomaly are large on-chain transfers and inflows of capital in combination. At the beginning of the window, multiple large ETH transfers appeared, including 8,676 ETH and 6,551 ETH, respectively, transferring from a large source to the
GateNews11h ago
