
Date: Tue, Dec 30, 2025 | 06:35 PM GMT
The broader cryptocurrency market is showing modest strength, with both Bitcoin (BTC) and Ethereum (ETH) trading in the green. This steady performance among major assets has helped stabilize overall market sentiment, creating room for select altcoins — including** eCash (XEC) **— to develop constructive technical setups.
XEC is trading with modest gains, but more importantly, its price structure is beginning to reflect a meaningful shift, as the chart now points toward a potential bullish continuation setup forming beneath key resistance.
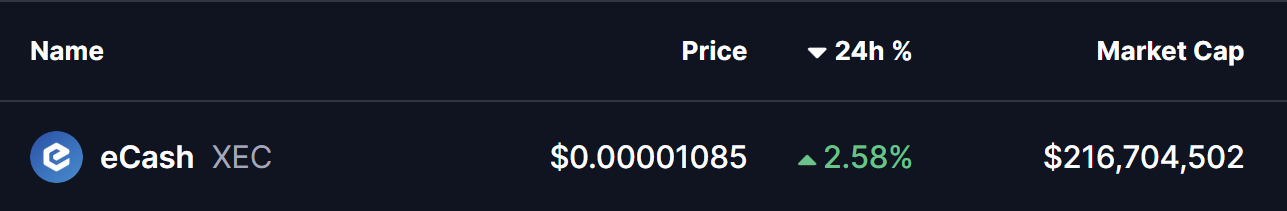
Source: Coinmarketcap
Rounding Bottom in Play
On the 4-hour timeframe, eCash is forming a textbook rounding bottom — a classic bullish reversal pattern that typically emerges after prolonged selling pressure. This structure reflects a slow but steady transition from distribution to accumulation, where sellers gradually lose control and buyers begin stepping in with conviction.
Earlier, XEC faced strong rejection near the $0.00001221 neckline zone, which triggered a sharp decline. That sell-off eventually found support near the $0.000010 region, a level that repeatedly acted as a demand zone. Each attempt to push price lower was absorbed, preventing a deeper breakdown and helping establish a rounded base.

eCash (XEC) 4H Chart/Coinsprobe (Source: Tradingview)
Since then, XEC’s price action has started to curve higher in a smooth, controlled manner. The gradual recovery toward the $0.00001221 resistance suggests selling pressure is fading, while accumulation continues to strengthen. This type of rounded structure often precedes a more decisive trend shift once key resistance levels are reclaimed.
What’s Next for XEC?
For the rounding bottom pattern to fully activate, XEC must reclaim the 200-hour moving average, currently hovering near the $0.00001126 region. A decisive break and sustained hold above this level would confirm a momentum shift and signal that buyers are regaining control after an extended corrective phase.
Beyond the moving average, the most critical hurdle remains the neckline resistance around $0.00001221. A clean breakout above this zone would validate the broader reversal structure and could open the door for a bullish expansion toward the $0.00001442 region, which aligns with the projected breakout target from the rounding bottom pattern.
Until these levels are reclaimed, the setup remains in development. Short-term pullbacks or sideways consolidation are still possible if price struggles near the 200-hour MA. However, as long as XEC continues to hold above the rounded base, the broader bottoming structure remains intact.
Overall, eCash is approaching an important technical inflection point. The emerging rounding bottom, improving price structure, and proximity to major resistance levels suggest the coming sessions could play a decisive role in shaping XEC’s next directional move.
Disclaimer: The views and analysis presented in this article are for informational purposes only and reflect the author’s perspective, not financial advice. Technical patterns and indicators discussed are subject to market volatility and may or may not yield the anticipated results. Investors are advised to exercise caution, conduct independent research, and make decisions aligned with their individual risk tolerance.
Disclaimer: The information on this page may come from third parties and does not represent the views or opinions of Gate. The content displayed on this page is for reference only and does not constitute any financial, investment, or legal advice. Gate does not guarantee the accuracy or completeness of the information and shall not be liable for any losses arising from the use of this information. Virtual asset investments carry high risks and are subject to significant price volatility. You may lose all of your invested principal. Please fully understand the relevant risks and make prudent decisions based on your own financial situation and risk tolerance. For details, please refer to
Disclaimer.
Related Articles
Bitcoin $20,000 Put Option Becomes Third Most Popular Strike Price Before CEX Quarterly Expiration
Before Bitcoin quarterly options expiration, the $20,000 put strike became the third most popular strike price, reflecting traders' expectations for extreme downside scenarios. Despite elevated market panic sentiment, call options still slightly outnumber put options, with overall sentiment leaning bullish.
GateNews32m ago
Zcash attracts attention for its privacy features, with a current market capitalization of $4 billion, representing 0.3% of the market share.
Bitcoin still dominates the digital currency market with a market share of approximately 90%. Zcash is rising due to its privacy features, with a market value of around $4 billion, facing growth momentum. If Zcash's market share increases to 5%, its value could potentially grow 18 times.
GateNews33m ago
Polkadot’s AltRank Exploded to #1 While $DOT Price Stayed Down – The Signal Was There Weeks Ago
Something interesting has been happening with Polkadot, and most people probably missed it.
While the DOT price has been sitting relatively low compared to its all-time highs, another metric was quietly flashing a strong signal. AltRank, a metric from LunarCrush, jumped from 109 to 1 in just o
CaptainAltcoin1h ago
BTC Traditional Bottom Indicators Fail, Three New Indicators Gain Market Attention
Bitcoin's recent price volatility has been significant, falling from $76,000 to $69,200, with mixed signals from market bottom indicators. Newly focused indicators such as CVDD, NUPL, and stablecoin inflows may provide clearer insights into market dynamics, suggesting that the bottom has not yet been reached.
GateNews1h ago
BTC 15-minute surge of 0.53%: Dovish CPI signals trigger buying frenzy, whale accumulation intensifies supply compression
During the 2026-03-19 13:30-13:45 (UTC) time window, BTC recorded a 15-minute return of +0.53%, with the price moving slightly upward within the range of 69243.3 to 69826.0 USDT, with a volatility amplitude of 0.84%. The unexpected CPI data release combined with on-chain liquidity tightening sparked market attention, causing significant short-term price movements in BTC. Trading volume did not show extreme expansion, but spot buying pressure increased rapidly.
The main driver of this price movement was the official release of US March CPI data at 13:30 (UTC), which triggered a recovery in market risk appetite. C
GateNews1h ago
