The competition among DEX platforms may have cooled down, but Avantis is showing impressive signs of breakout.
In the past 24 hours, the Avantis token (AVNT) surged over 22%, bringing the weekly cumulative increase to 62% — a figure that has caught the market’s attention. This strong rally clearly reflects growing interest from capital flows toward Avantis, despite the overall market environment becoming less lively.
Contrary to the bullish momentum of AVNT, some other Perp DEXs like AsterDEX (ASTER) are struggling in terms of price, indicating an increasing divergence within the group of emerging DEX projects.
Avantis Reverses Market Structure to an Uptrend
On the technical chart, Avantis has officially broken a downtrend structure that lasted over a month. The correction for AVNT started immediately after October 24, about two weeks after the widespread liquidation wave across the entire cryptocurrency market.
The recovery momentum was reinforced when AVNT broke above the downtrend resistance line and also surpassed the 50-day simple moving average (SMA) — an important technical signal indicating a trend reversal. This development aligns with the bullish divergence signal from the RSI indicator, which is now approaching the 68 level.
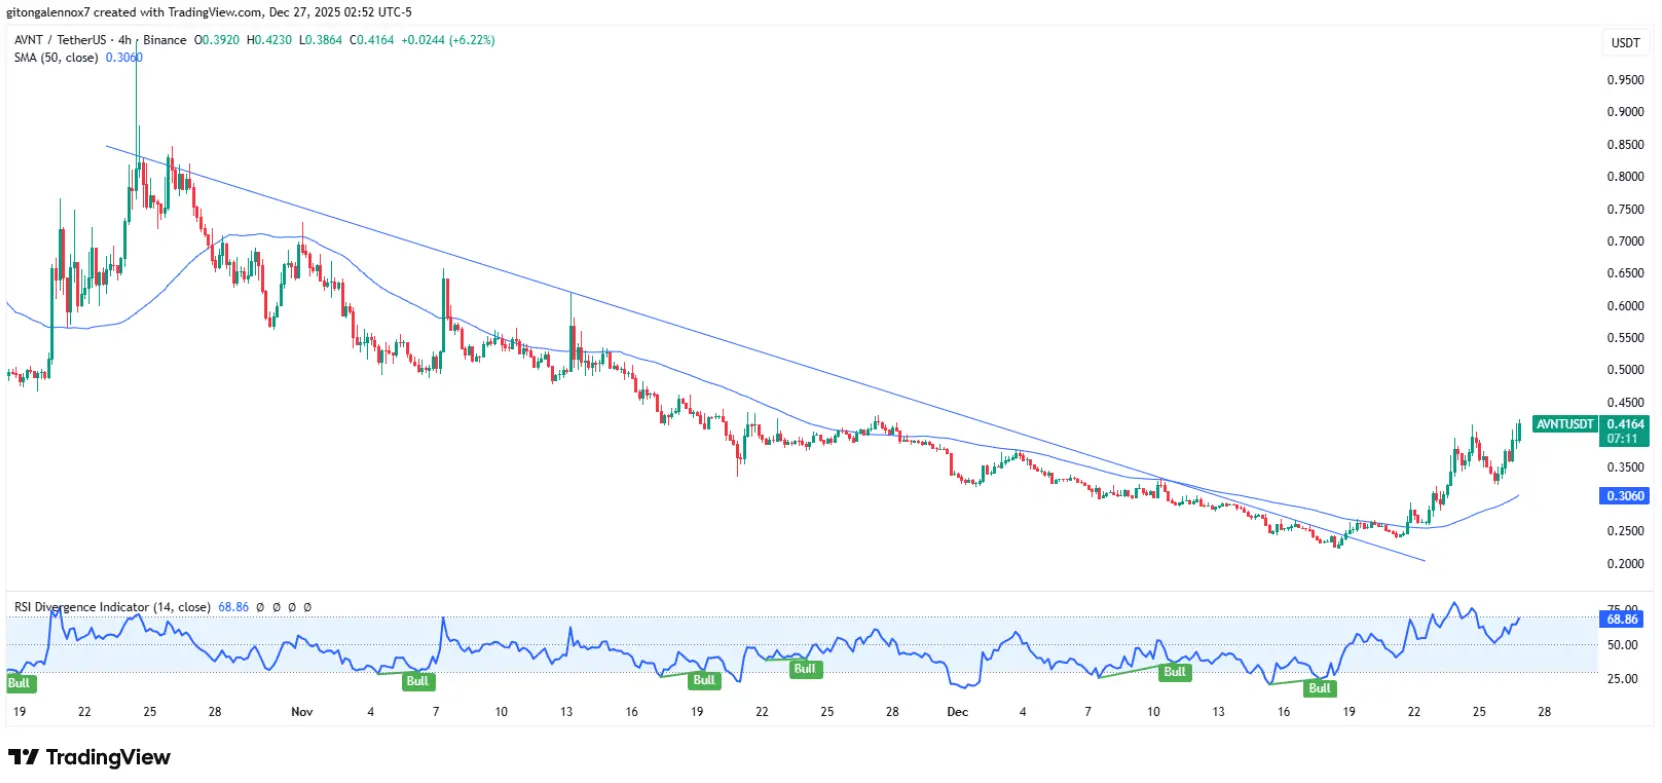 AVNT/USDT 4-hour chart | Source: TradingView
Since the breakout on December 19, AVNT has continuously set higher highs and higher lows, reflecting increasing dominance of the bulls. Notably, this altcoin rebounded from the $0.32 level on Christmas Day, maintaining a firm position above the 50 SMA.
AVNT/USDT 4-hour chart | Source: TradingView
Since the breakout on December 19, AVNT has continuously set higher highs and higher lows, reflecting increasing dominance of the bulls. Notably, this altcoin rebounded from the $0.32 level on Christmas Day, maintaining a firm position above the 50 SMA.
However, AVNT’s upward momentum is temporarily stalling as it approaches a minor resistance zone around $0.40 — an area that previously served as a key accumulation zone about a month ago.
If AVNT successfully breaks through the $0.40 threshold, it could open up new growth potential, targeting the $0.60 zone or higher. Conversely, if the price weakens and breaks below the moving average, the current uptrend is likely to be invalidated.
In addition to the technical breakout momentum, network activity indicators are also playing a crucial role, helping to reinforce AVNT’s short-term bullish outlook.
Signs of Resilience?
Disclaimer: The information on this page may come from third parties and does not represent the views or opinions of Gate. The content displayed on this page is for reference only and does not constitute any financial, investment, or legal advice. Gate does not guarantee the accuracy or completeness of the information and shall not be liable for any losses arising from the use of this information. Virtual asset investments carry high risks and are subject to significant price volatility. You may lose all of your invested principal. Please fully understand the relevant risks and make prudent decisions based on your own financial situation and risk tolerance. For details, please refer to
Disclaimer.
Related Articles
PEPE Reclaims 0.00000400 — Is This 1.8% Move the Start of a Bigger Run?
PEPE rebounds from 0.00000385 support, forming higher lows and stronger bullish structure.
Technical indicators like MACD and RSI show momentum with room for further upside.
Key resistance at 0.00000410; support at 0.00000380 critical for trend continuation.
PepeCoin — PEPE, has
CryptoNewsLand3h ago
ETH drops 0.58% in 15 minutes: derivatives liquidity contraction and proactive position reduction dominate short-term pullback
From 2026-04-19 04:30 to 2026-04-19 04:45 (UTC), within ETH’s 15-minute candlestick chart, the return recorded -0.58%, and the price range was 2321.62 to 2342.04 USDT, with an amplitude of 0.87%. The short-term selloff occurred against a backdrop of increased overall market volatility and a broad decline in the prices of major crypto assets; overall market risk appetite clearly fell, and traders’ wait-and-see sentiment strengthened.
The main driver behind this abnormal move is a sharp contraction in liquidity in the derivatives market and leveraged funds proactively reducing positions. Data shows that over the past 24 hours, the ETH/USD perpetual contract trading volume dropped 67.16% to approximately 74.87 million, open interest edged down 3.33% to 329 million, and liquidation amounts did not expand unusually. This structure indicates that the market lacks the risk of passive cascades; more funds chose to proactively step aside and wait on the sidelines, intensifying short-term selling pressure.
In addition, the long/short structure in which shorts held the upper hand (long/short ratio 47.48%:52.52%) and sentiment synchronization with the panic range reinforced the downward price trend. During the same period, major coins such as BTC and SOL also fell 2%-3.4% in tandem, further showing that this pullback was driven by system-wide risk sentiment. On-chain funds did not show any large abnormal transfers or large-scale liquidations of DeFi protocols; spot and on-chain liquidity remained generally stable, and no sudden system risk resonance was observed.
Current volatility-related risks still need close monitoring, especially as overall risk appetite continues to contract—ETH’s short-term price may face further downside probing. Watch subsequent changes in derivatives trading volume and open interest, extreme shifts in the long/short ratio and funding rate, and promptly monitor on-chain fund flows, large transfers, and any signs of amplified platform net outflows. For more market anomalies and deeper analysis, please continue to follow our upcoming market updates.
GateNews4h ago
Spark Protocol's January delisting of rsETH proves prudent as Aave faces ETH liquidity crisis
Spark Protocol's strategy of delisting low-usage assets and tightening collateral has faced initial backlash but proved wise during market turmoil. While maintaining higher interest rate caps, SparkLend ensures liquidity, unlike Aave, which now faces significant risks.
GateNews5h ago
Request Network (REQ) Surges 23.68% in 15 Minutes, 24-Hour Gain Reaches 116.52%
Request Network (REQ) surged 23.68% in just 15 minutes, reaching $0.152, with a 24-hour rise of 116.52% and trading volume over $8 million. Factors include retail interest and whale accumulation. Resistance at $0.160 and support at $0.122 are under observation.
GateNews5h ago
Solana Price Stalls Near $80 as ETF Outflows Weigh
Solana trades around $80, facing bearish sentiment due to ETF outflows and declining retail participation. Technical indicators show mixed signals, with resistance at $87 and $98, while support at $77 remains critical for stability.
CryptoFrontNews10h ago
Dogecoin Holds $0.094 as X Cashtags Drive Market Attention
Key Insights
Dogecoin holds above $0.094 despite market weakness as Bitcoin and Ethereum stabilize, reflecting resilience and sustained demand across major cryptocurrencies during the consolidation phase.
X launches smart cashtags enabling real-time crypto and stock tracking, improving marke
CryptoNewsLand13h ago
