Since being rejected at the resistance zone of $0.146 about a month ago, Conflux has entered a prolonged correction trend, moving within a downtrend channel and retreating to a local bottom around $0.06.
After several weeks of continuous weakness, this token has begun to show the first signs of recovery, with a notable rebound to $0.078 before facing profit-taking pressure and pulling back.
At the time of writing, Conflux (CFX) is trading around the $0.072 mark, up 8.7% in 24 hours. Market liquidity has significantly improved as trading volume surged by 358%, reaching approximately $58 million, while market capitalization approaches the $400 million threshold.
This development reflects a return of short-term capital flow and more positive speculative sentiment, although the overall trend structure remains not fully sustainable and requires further confirmation.
Partnership with PlaysOut improves market sentiment
In an effort to provide substantial support for CFX during this difficult period, PlaysOut and Conflux have just announced a strategic partnership, focusing on exploring AI-powered gaming solutions and cross-chain interaction capabilities.
According to the announcement, both parties will collaborate to build highly scalable blockchain infrastructure, develop AI-supported interaction tools, and shape next-generation gaming scenarios aligned with Web3 trends.
The partnership also opens up the possibility of deploying mini-games directly on Conflux’s Layer 1 environment, alongside initiatives to attract users from Web2 to Web3 and regional market expansion strategies.
Immediately after the announcement, market sentiment was activated in the short term, serving as a catalyst for a strong speculative buying wave in the spot market.
Binance buyers dominate
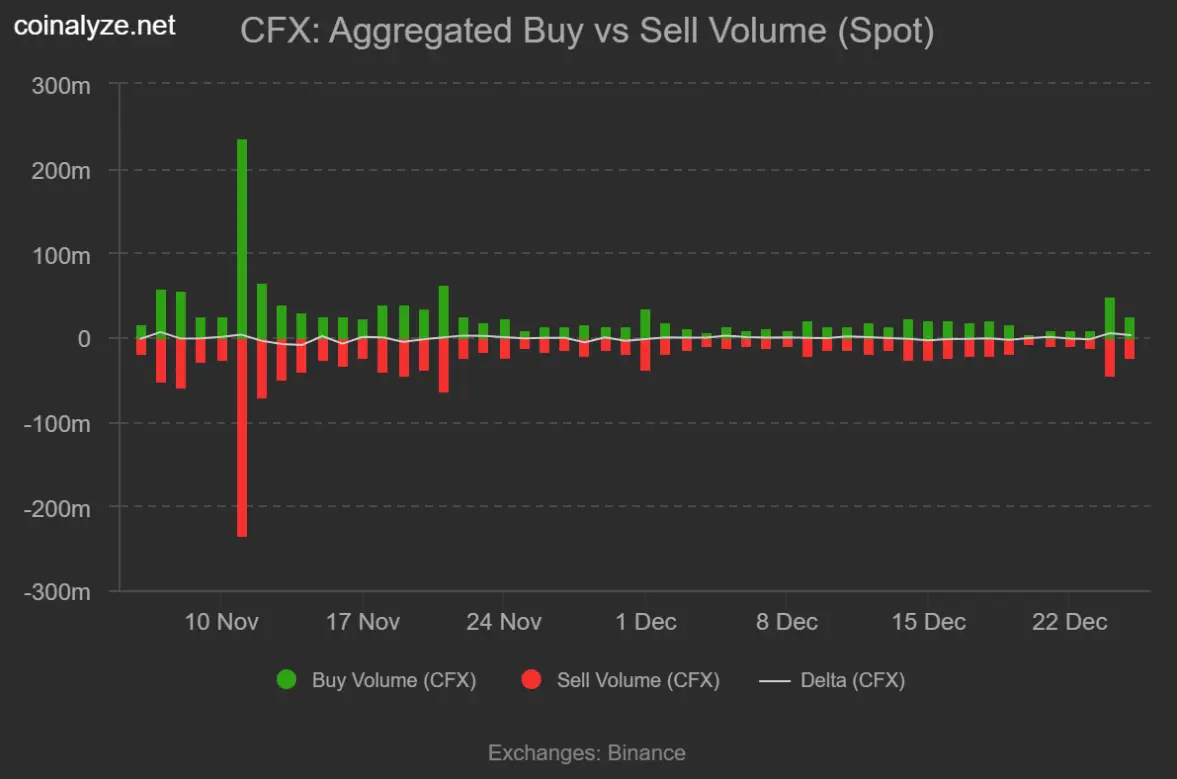
Following the official announcement of the partnership between Conflux and PlaysOut, demand for CFX surged rapidly in a short period. On Binance, FOMO sentiment quickly spread as buying inflows flooded in, indicating investors’ high expectations for profit potential from this connection.
According to data from Coinalyze, from December 24 to 25, the buy volume reached 74.83 million CFX, far exceeding the 67 million CFX in sell volume. This difference created a positive Buy–Sell Delta of 7.8 million, reflecting a clear accumulation trend in the spot market.
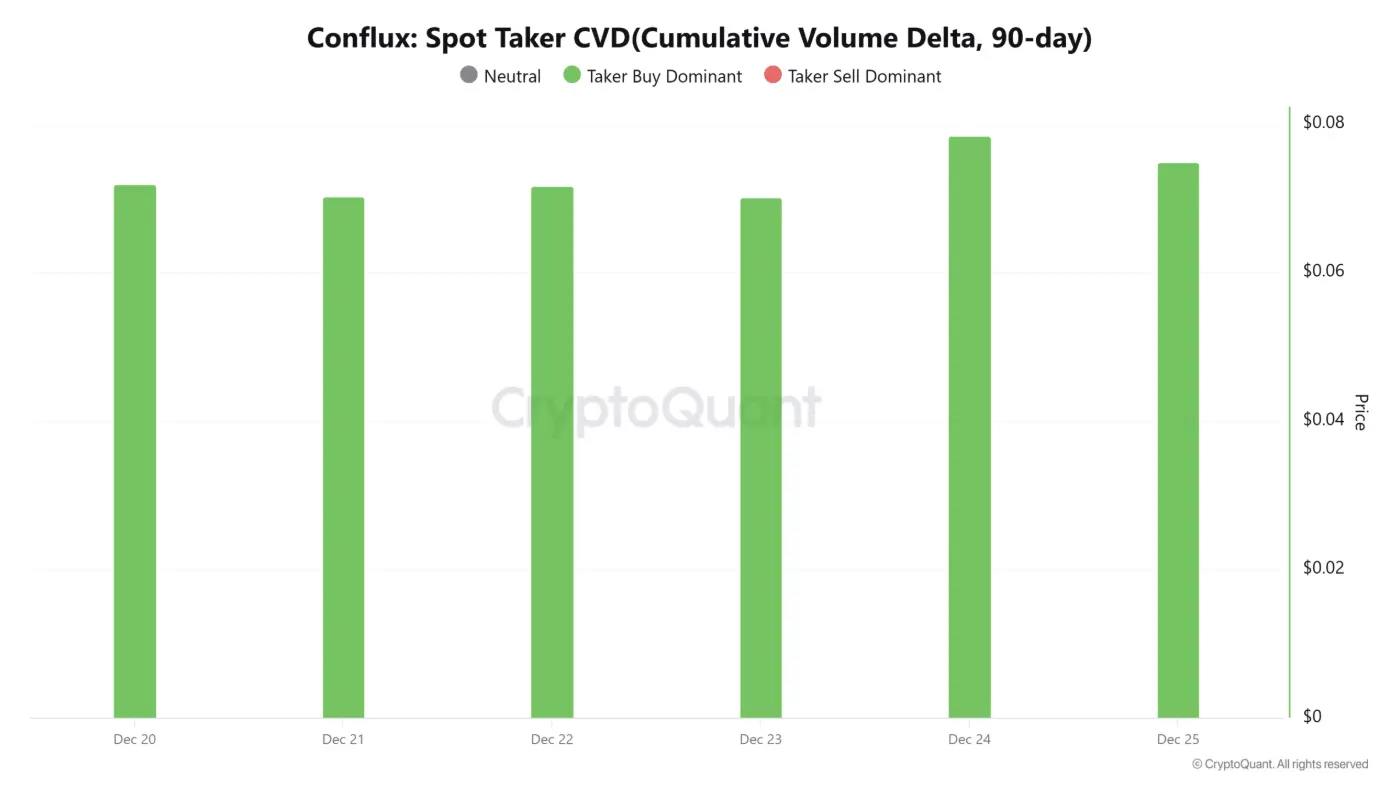
 Source: Coinalyze Notably, spot demand is not only concentrated on Binance but also spreading across the entire market, indicating systemic buying pressure rather than isolated activity. Supporting this view, CryptoQuant’s Spot Taker CVD data shows bullish control increasing to the highest weekly level on December 24, confirming the emergence of a new and strong demand wave for CFX.
 Source: CryptoQuant## Profit-taking pressure returns as price stalls
Although the market is showing signs of recovery, distribution signals have quickly appeared. Data from CoinGlass shows that Spot Netflow unexpectedly turned positive for the first time in nearly three weeks of silence.
At the time of writing, net inflow into exchanges reached about $1.73 million — the highest since August. This indicates an increasing amount of tokens being deposited onto exchanges, a typical signal associated with profit-taking after short-term price rallies.
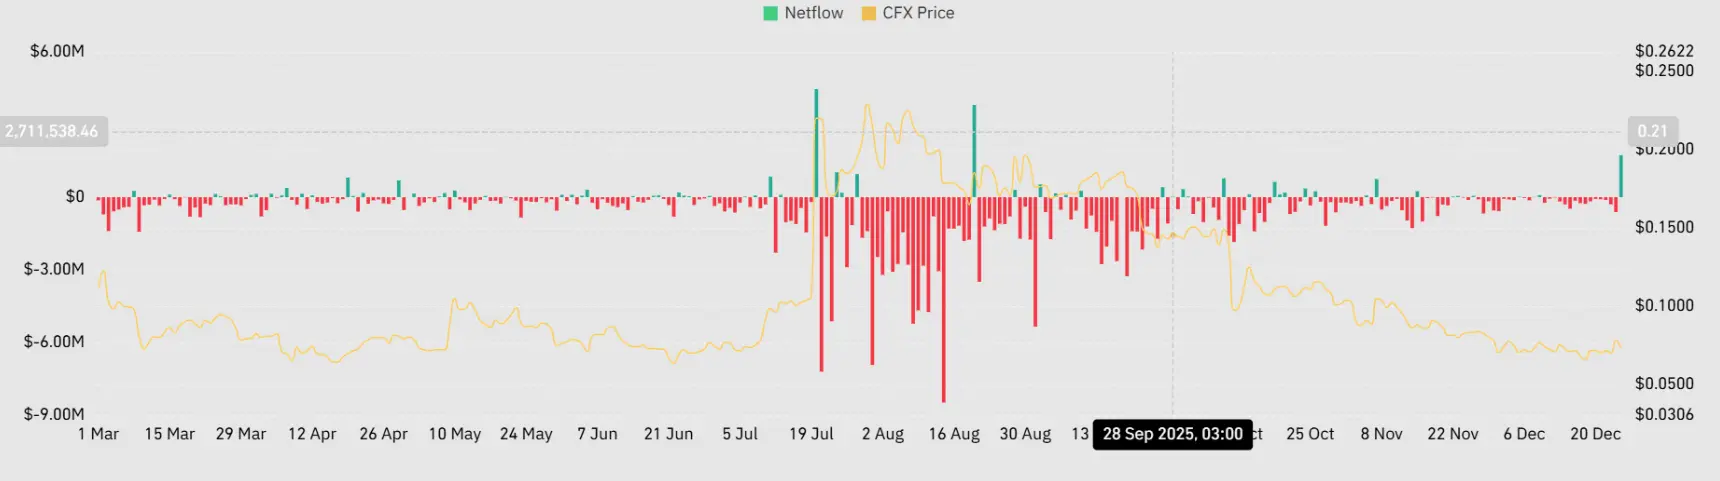 Source: CoinGlass Historically, such profit-taking phases often create new selling pressure for CFX, especially when the overall market trend has not yet been firmly established. This raises concerns that the current recovery could soon face significant challenges.
Is it just a short-term “bubble”?
Current technical signals depict a picture of intense indecision and lack of clear consensus.
Specifically, Conflux’s RSI once broke into positive territory, reaching 54, before quickly cooling down and retreating to around 47 at the time of writing. This movement indicates increased selling pressure, absorbing much of the previous buying momentum and halting the upward movement.
Meanwhile, the Trend Strength Index (TSI) remains deeply in negative territory, at -11, reflecting that the downtrend still dominates and selling pressure has not shown clear signs of weakening.
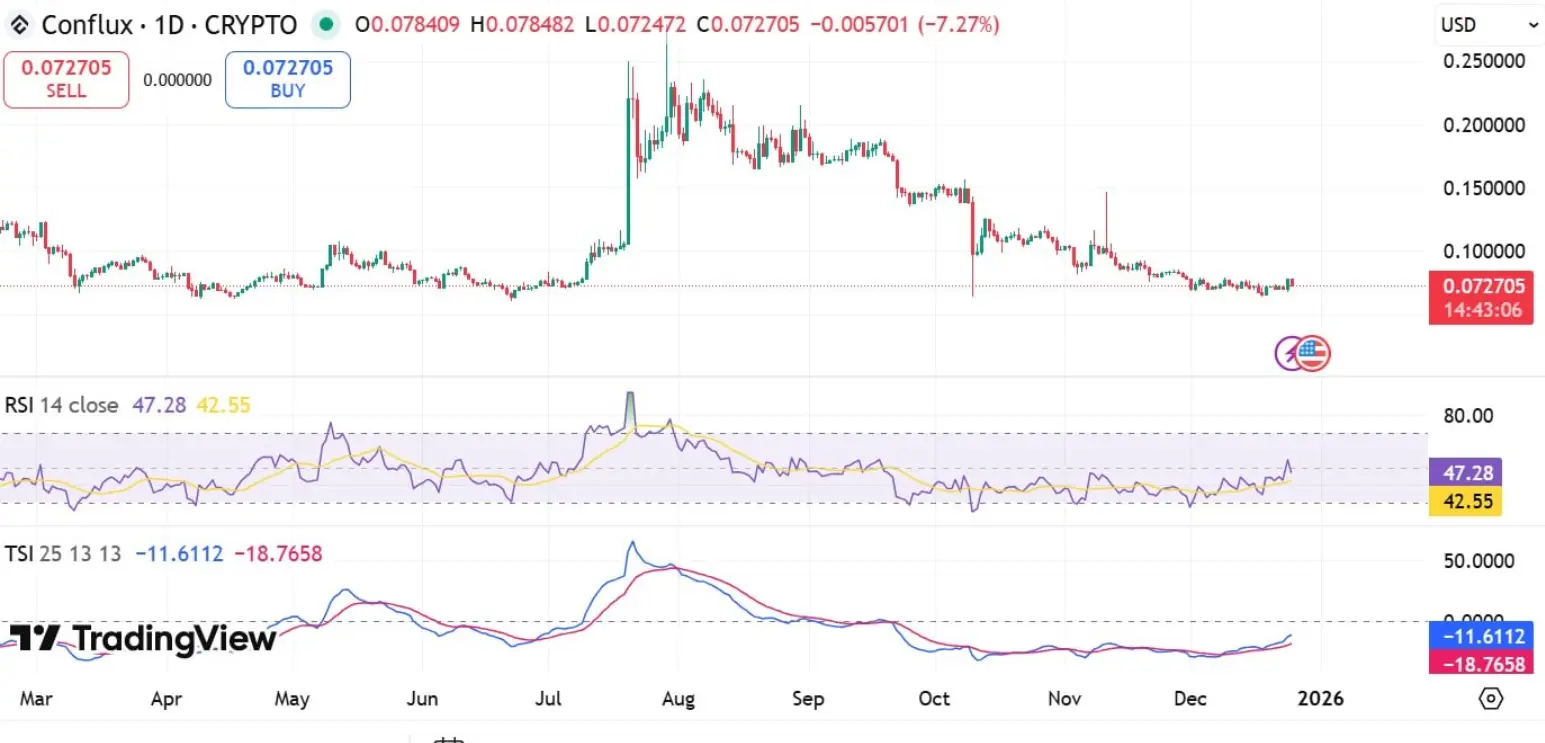 Source: TradingView These conflicting signals suggest the market is in a fierce tug-of-war, with bulls and bears continuously contesting short-term trend control. Therefore, the next price move will largely depend on which side can dominate the other.
In a positive scenario, if the bulls sustain the momentum they have built, Conflux could target resistance around $0.093. Conversely, if selling pressure returns and gains the upper hand, CFX faces the risk of a deeper correction, retreating to the $0.068 zone.
Disclaimer: The information on this page may come from third parties and does not represent the views or opinions of Gate. The content displayed on this page is for reference only and does not constitute any financial, investment, or legal advice. Gate does not guarantee the accuracy or completeness of the information and shall not be liable for any losses arising from the use of this information. Virtual asset investments carry high risks and are subject to significant price volatility. You may lose all of your invested principal. Please fully understand the relevant risks and make prudent decisions based on your own financial situation and risk tolerance. For details, please refer to
Disclaimer.
Related Articles
Bitcoin risks 50% drop as BTC’s positive correlation with US stocks grows
Bitcoin (BTC) erased much of its US-Iran war-driven gains this week, moving back in sync with the broader downtrend in risk assets, mainly US equities.
Key takeaways:
Bitcoin’s positive flip in S&P 500 correlation has historically preceded average declines of around 50% since 2018.
BTC
Cointelegraph6m ago
Impact of the Current US–Israel–Iran War on Cryptocurrency: Market Volatility, Bitcoin Trends & Future Outlook (2026)
🌍 Introduction
The ongoing geopolitical conflict involving the United States, Israel, and Iran has created shockwaves across global financial markets. From rising oil prices to falling stock indices, every asset class is being affected — including cryptocurrency.
In 2026, crypto is no
Cryptoknowmics11m ago
BTC Price Fluctuation Analysis
# BTC 2026-03-23 11:00–11:15(UTC)Price Anomaly Deep Attribution Report
## I. Executive Summary and Core Conclusions
During the time window of 2026-03-23 11:00–11:15(UTC), BTC price return was +3.51%, showing significant anomaly. This report systematically traces the causes of price anomaly through quantitative indicators including on-chain data, trading volume, position changes, and capital flows, combined with market structure and behavioral analysis. Conclusions show that this round of anomaly was primarily driven by institutional capital inflows (ETF net purchases), futures market leverage
GateNews20m ago
Crypto Market Declines As Fear Grips Investors
The crypto market is down, with a total market cap of $2.36T. Bitcoin and Ethereum have dipped by 0.82% and 2.47%, respectively. Nonetheless, some altcoins have surged significantly. DeFi TVL has decreased, while NFT sales volume has increased. Blockchain social apps are gaining traction amid geopolitical tensions.
BlockChainReporter33m ago
Solana Price Under Pressure, Can Institutional Buying Support Help SOL Return to $100?
Solana (SOL) has recently hovered around $86-87, declining nearly 7% over the past week, related to overall crypto market weakness. Clear classification of crypto assets by U.S. regulators benefits institutional investors. Capital flows show robust institutional demand, with continuous net inflows into Solana ETFs. Technical analysis shows SOL below the $90 resistance level, with support at $85. Investors should monitor institutional dynamics and technical indicators to gauge short-term trends.
GateNews1h ago
Bitcoin MACD Reignites Red Alert, Bulls May Face Risk of Sharp Drop
Bitcoin bulls should be alert to the sell signal indicated by the MACD indicator. Recent weakening momentum may cause a price correction. Historical patterns show that whenever the MACD drops below the zero line, prices tend to fall sharply. Given the tense geopolitical situation, traders should monitor technical indicator changes, manage risks appropriately, and operate cautiously.
GateNews1h ago
