
Date: Thu, Dec 18, 2025 | 11:00 AM GMT
The broader cryptocurrency market has been experiencing choppy price action over the past several weeks, a phase that began after the sharp sell-off on October 10. That correction dragged Ethereum (ETH) down by nearly 27% over the last 60 days, keeping sustained pressure on major altcoins, including DEX token** Aster ($ASTER).**
ASTER has fallen more than 25% over a week alone, extending its 60-day decline to roughly 42%. While the short-term trend remains firmly bearish, a closer look at the chart suggests something more constructive may be developing beneath the surface.
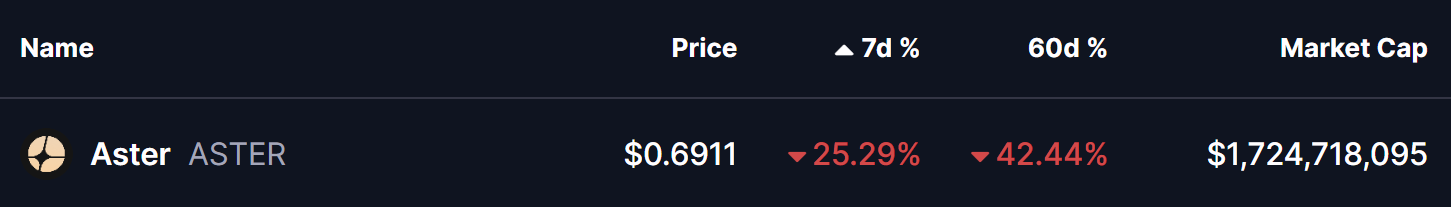
Source: Coinmarketcap
Interestingly, ASTER’s current structure is beginning to resemble the bottoming pattern previously seen in Hyperliquid (HYPE), a setup that ultimately led to a powerful trend reversal earlier this year.
ASTER Mirrors HYPE’s Bottoming Path
Aster appears to be tracing a price structure that closely aligns with HYPE’s April 2025 fractal — a period that preceded a multi-hundred-percent rally.
HYPE’s move began with a sharp correction following its all-time high. That decline eventually forced price below the 50-day moving average, confirming a shift in momentum. Rather than collapsing further in a straight line, HYPE transitioned into a rounding bottom structure, reflecting a gradual slowdown in selling pressure and the early stages of accumulation.
The token ultimately found its floor after a steep 73% drawdown from its peak, a point that marked clear seller exhaustion. From there, momentum shifted decisively. A clean reclaim of the 50-day moving average acted as the key confirmation signal, setting the stage for a breakout from the rounding bottom. What followed was a powerful 434% rally, making it one of HYPE’s most notable reversals of the year.

HYPE and ASTER Fractal Chart/Coinsprobe (Source: Tradingview)
Now, ASTER appears to be walking a similar road.
After topping out near its all-time high around $2.42, ASTER entered a prolonged corrective phase and slipped below its 50-day moving average. The chart now shows price carving out a potential rounding bottom, with the $1.30–$1.40 region acting as a key neckline zone. This structure closely mirrors HYPE’s pre-bottom behavior, as highlighted in the comparative chart.
What’s Next for ASTER?
If this fractal continues to unfold, ASTER may still face some near-term downside pressure. A deeper move toward the $0.60 area would complete a decline of roughly 73% from its all-time high — the same magnitude of correction where HYPE previously established its bottom.
From a bullish standpoint, the first meaningful signal to watch is a reclaim of the 50-day moving average, currently hovering near the $1.04 level. A sustained move above this zone would suggest that bearish momentum is weakening. If followed by a decisive breakout above the neckline resistance, ASTER could transition into a broader recovery phase, potentially echoing the type of upside expansion HYPE experienced after confirming its reversal.
Key Risk Note
While fractal similarities can offer valuable context, they do not guarantee identical outcomes. Market conditions, liquidity dynamics, and broader sentiment can differ significantly from one asset to another. Confirmation remains critical, and downside invalidation levels should be respected if the structure fails to hold.
For now, ASTER appears to be approaching a critical inflection point. Whether this evolving structure turns into a confirmed bottom or merely a pause before further weakness will depend on how price behaves around its moving averages and key support zones in the days ahead.
Disclaimer: The views and analysis presented in this article are for informational purposes only and reflect the author’s perspective, not financial advice. Technical patterns and indicators discussed are subject to market volatility and may or may not yield the anticipated results. Investors are advised to exercise caution, conduct independent research, and make decisions aligned with their individual risk tolerance.
Disclaimer: The information on this page may come from third parties and does not represent the views or opinions of Gate. The content displayed on this page is for reference only and does not constitute any financial, investment, or legal advice. Gate does not guarantee the accuracy or completeness of the information and shall not be liable for any losses arising from the use of this information. Virtual asset investments carry high risks and are subject to significant price volatility. You may lose all of your invested principal. Please fully understand the relevant risks and make prudent decisions based on your own financial situation and risk tolerance. For details, please refer to
Disclaimer.
Related Articles
Dogecoin Transaction Volume Spikes to $800M, Up 241% in 24 Hours
Gate News message, April 21 — Dogecoin's on-chain transaction volume surged to nearly $800 million on April 16, marking the highest single-day volume recorded in 2026, according to data from crypto analyst Ali Martinez citing Santiment. The volume jumped 241% within 24 hours from April 15, when it s
GateNews36m ago
Shiba Inu Breakout Gains Strength as Volume Surges
Key Insights
Shiba Inu’s breakout above the triangle pattern gains strength as rising volume and higher lows confirm growing demand and a sustained bullish market structure shift.
Derivatives activity jumps significantly with volume surpassing $249 million while open interest rises,
CryptoNewsLand1h ago
Shiba Inu Sees 82.5B Token Outflow as Market Structure Shifts
Key Insights
Shiba Inu saw 82.5 billion tokens exit exchanges within 24 hours, signaling reduced supply pressure and increasing accumulation behavior among larger holders.
Exchange net flows remain positive as inflows persist, yet rising outflows suggest a gradual balance forming between
CryptoNewsLand1h ago
XRP Price Near $1.45 as ETF Inflows Build Pressure
Key Insights
Institutional XRP ETF inflows reached $41.6 million over four days, lifting assets under management above $1.08 billion and strengthening market confidence.
XRP faces strong resistance near $1.45, where CoinGlass data highlights a short max
CryptoNewsLand1h ago
XRP Expands to Solana as wXRP Drives DeFi Access
Key Insights
Wrapped XRP on Solana surpasses 834,000 tokens, enabling new DeFi access while strengthening cross-chain liquidity and expanding XRP utility beyond its native ledger.
Ethereum and Solana dominate DeFi activity, while XRP Ledger trails significantly, driving the need for
CryptoNewsLand1h ago
