As the crypto and commodities markets brace for Thursday’s U.S. CPI release and Friday’s widely expected Bank of Japan rate hike, Bitcoin, gold, and silver are flashing mixed signals—hinting at potential volatility ahead.
- Bitcoin shows short-term relief but remains trapped under heavy macro resistance.
- Gold’s structural uptrend is intact, yet momentum divergences suggest an impending pause.
- Silver is in full price discovery mode, but overbought conditions warn of near-term exhaustion.
Bitcoin: Relief Rally Fading Against Bearish Structure
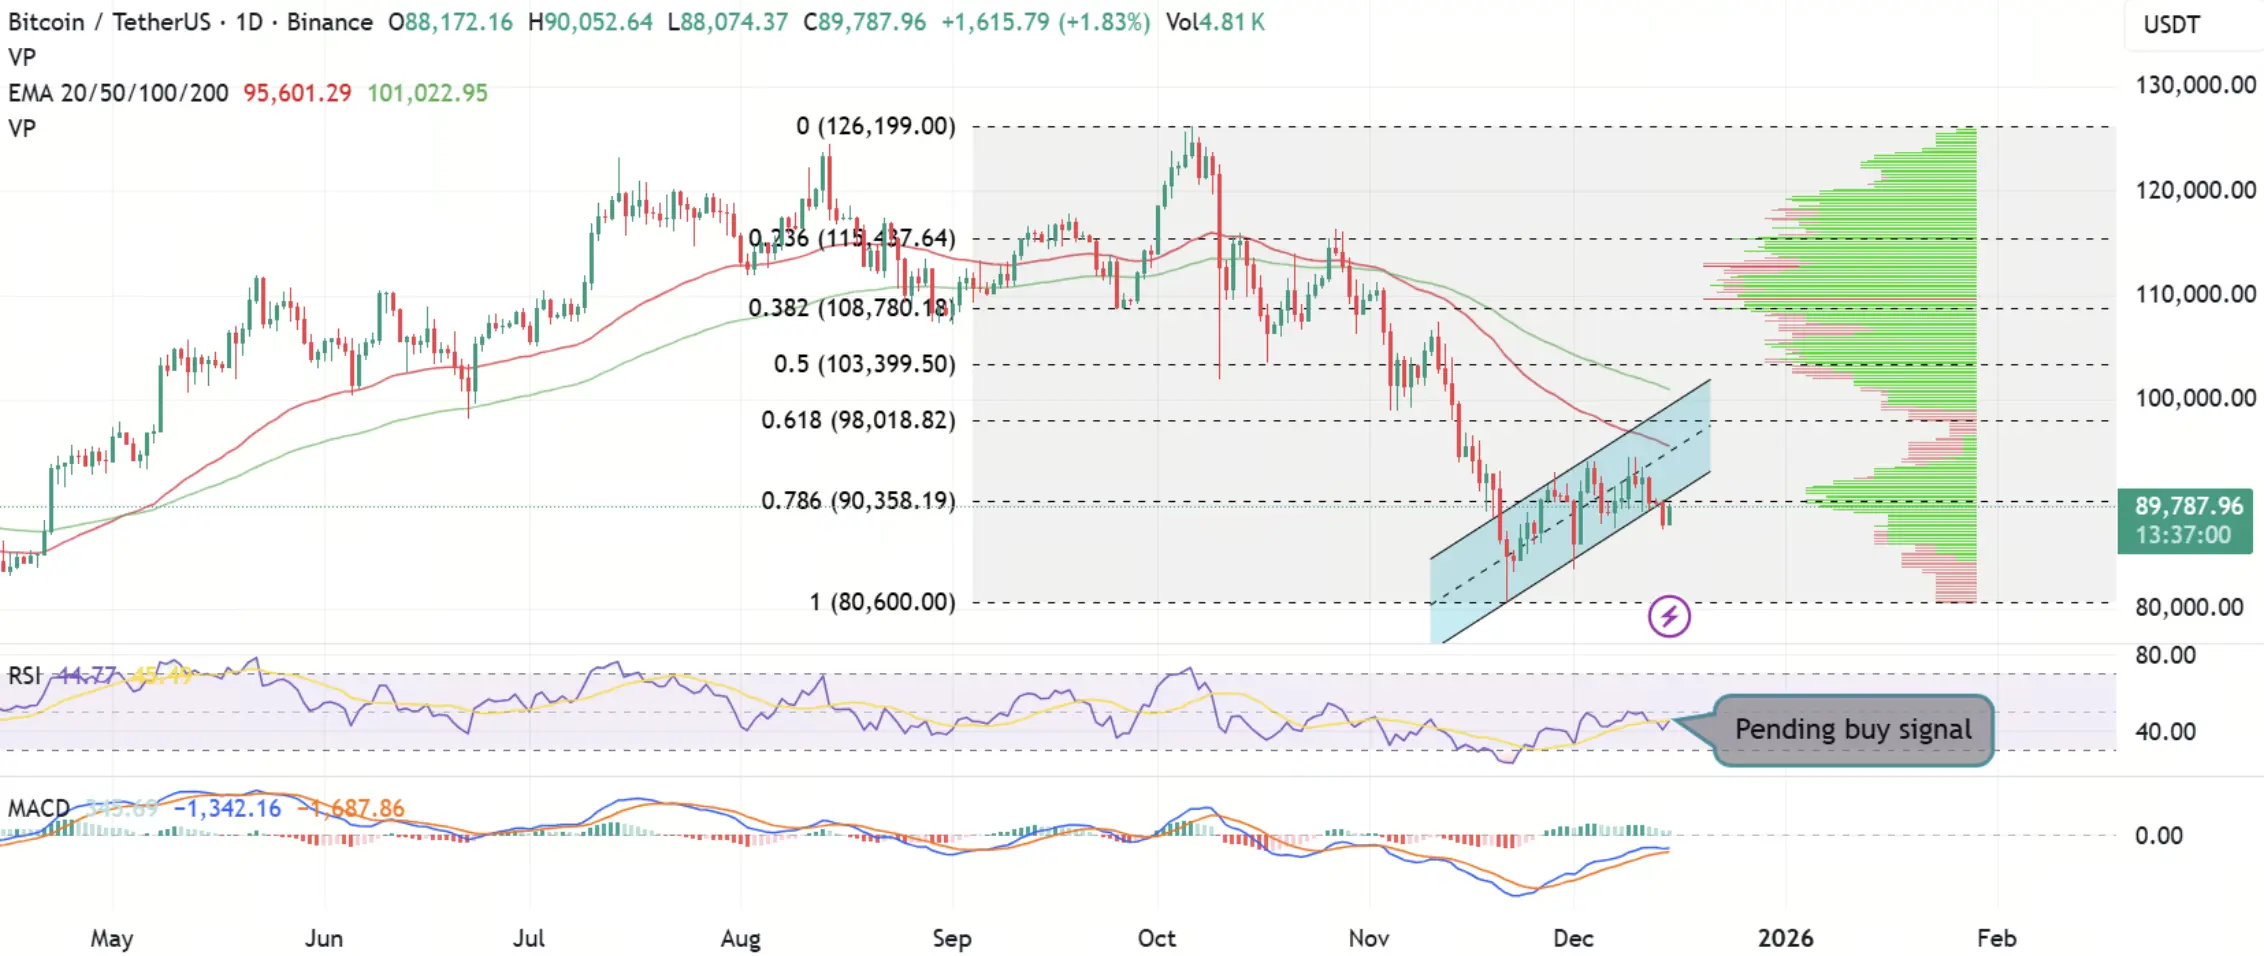
Bitcoin’s daily chart reflects a counter-trend bounce rather than a confirmed reversal. After breaking down from an ascending channel, the recovery from sub-$80,000 lows appears to be losing steam following the steep drop from October’s $126,000 peak.
(Sources: TradingView)
Price sits below critical moving averages—the 50-day EMA at $95,601 and 100-day EMA at $101,022—which continue to act as dynamic overhead resistance.
Momentum indicators offer modest encouragement: the RSI has climbed from oversold levels into the mid-40s, with a pending bullish crossover on the horizon. The MACD histogram remains positive (though fading), signaling that sellers have not fully taken control.
Volume Profile highlights significant overhead supply from late buyers between $90,000 and higher, reinforcing the risk of rejection on any push upward.
For a genuine bullish shift, Bitcoin needs a decisive close above the channel’s lower boundary and a reclaim of $100,000—ideally with confirmation beyond the 61.8% Fibonacci retracement at $98,018.
Until then, range-bound trading with downside risk on failed rallies remains the base case. Early stabilization signs are present, but macro headwinds dominate.
Gold: Strong Trend Nears Resistance as Momentum Wanes
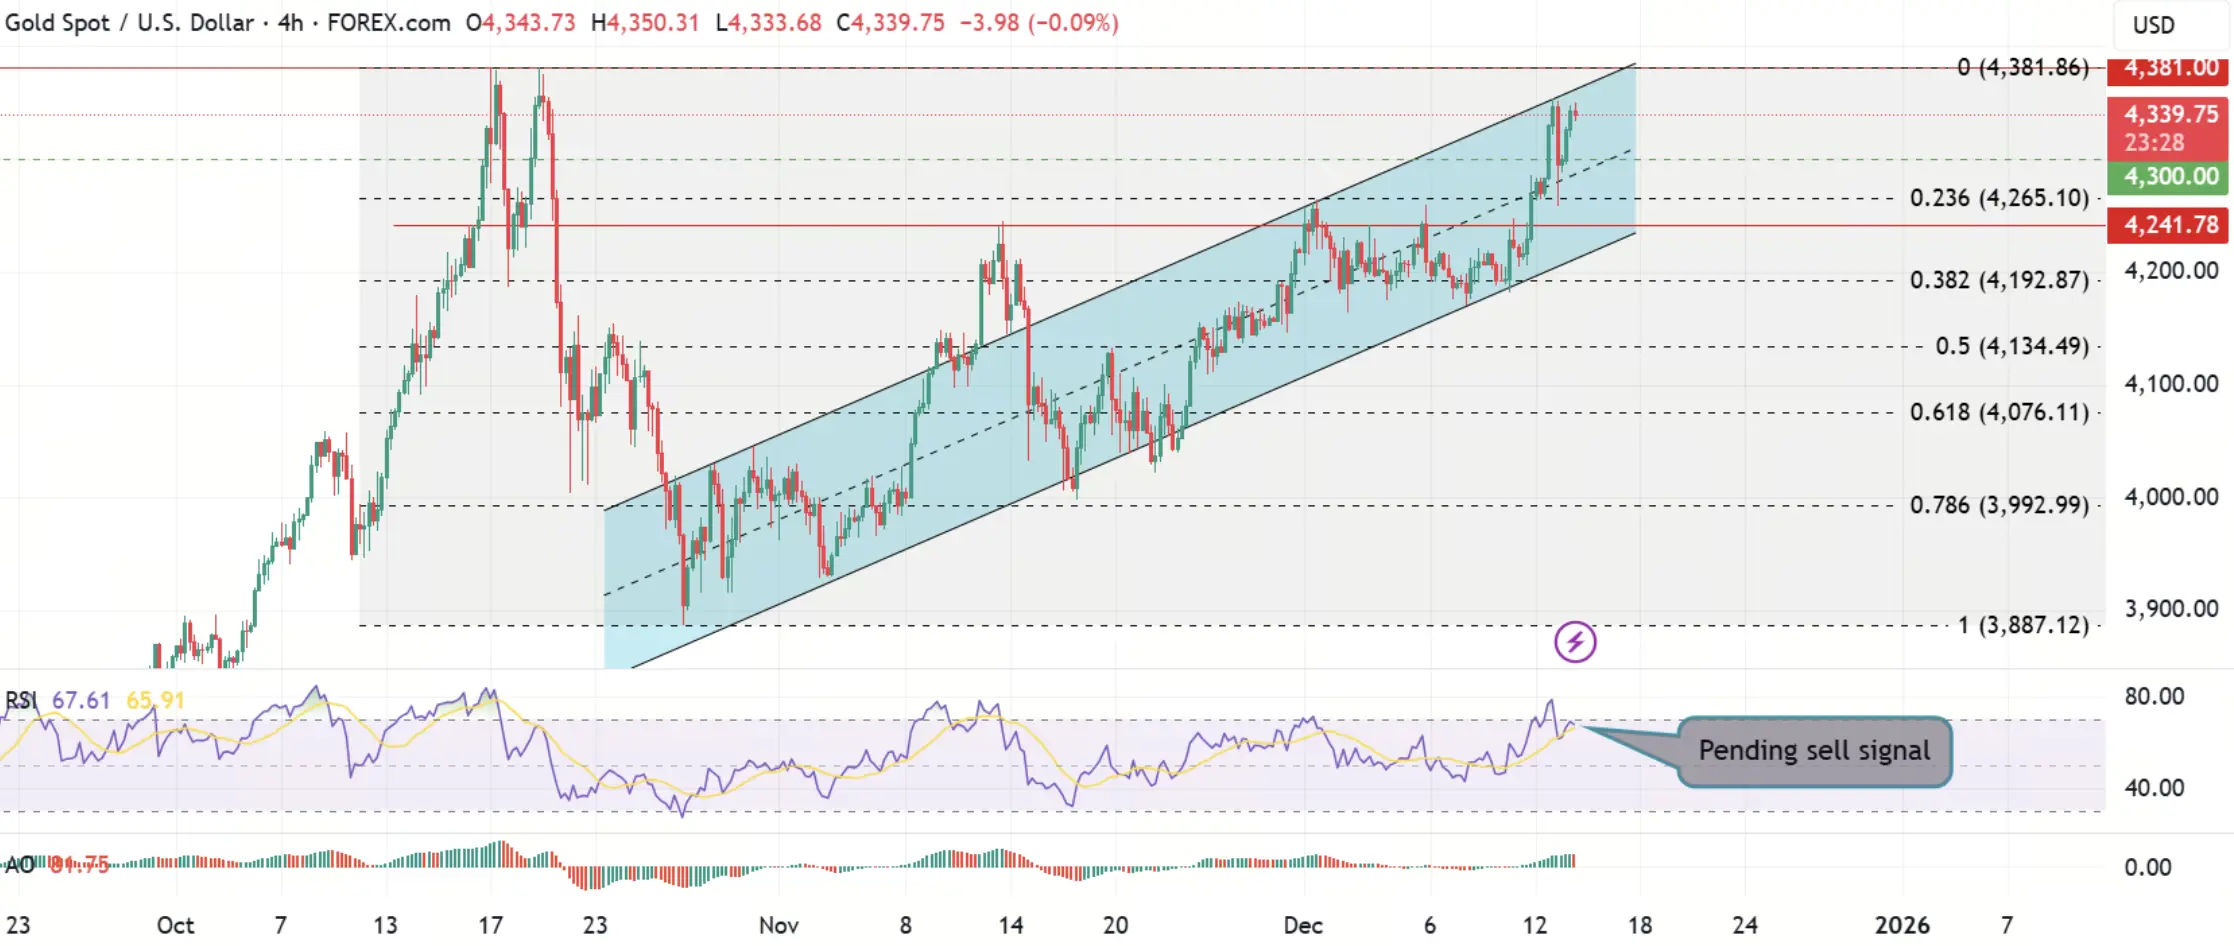
Gold’s 4-hour chart continues to respect a clean ascending channel, consistently posting higher highs and lows throughout November and December. Price is now challenging the all-time high near $4,381.
(Sources: TradingView)
The structural uptrend remains firmly bullish, but momentum is showing cracks. The RSI has rolled over from elevated territory into the mid-to-high 60s, flashing a pending bearish crossover.
This divergence doesn’t spell reversal—it points to a likely healthy pullback toward channel support, offering better entries for longs.
Fibonacci levels align with this view: retracements to $4,265 (23.6%) or $4,193 (38.2%) would stay constructive. Only a break below $4,134 (channel support) or $4,076 (lower timeframe close) would raise serious concerns.
Medium-term bias stays positive, but chasing new highs here carries elevated risk of consolidation or correction.
Silver: Breakout Power Meets Overextension Warning
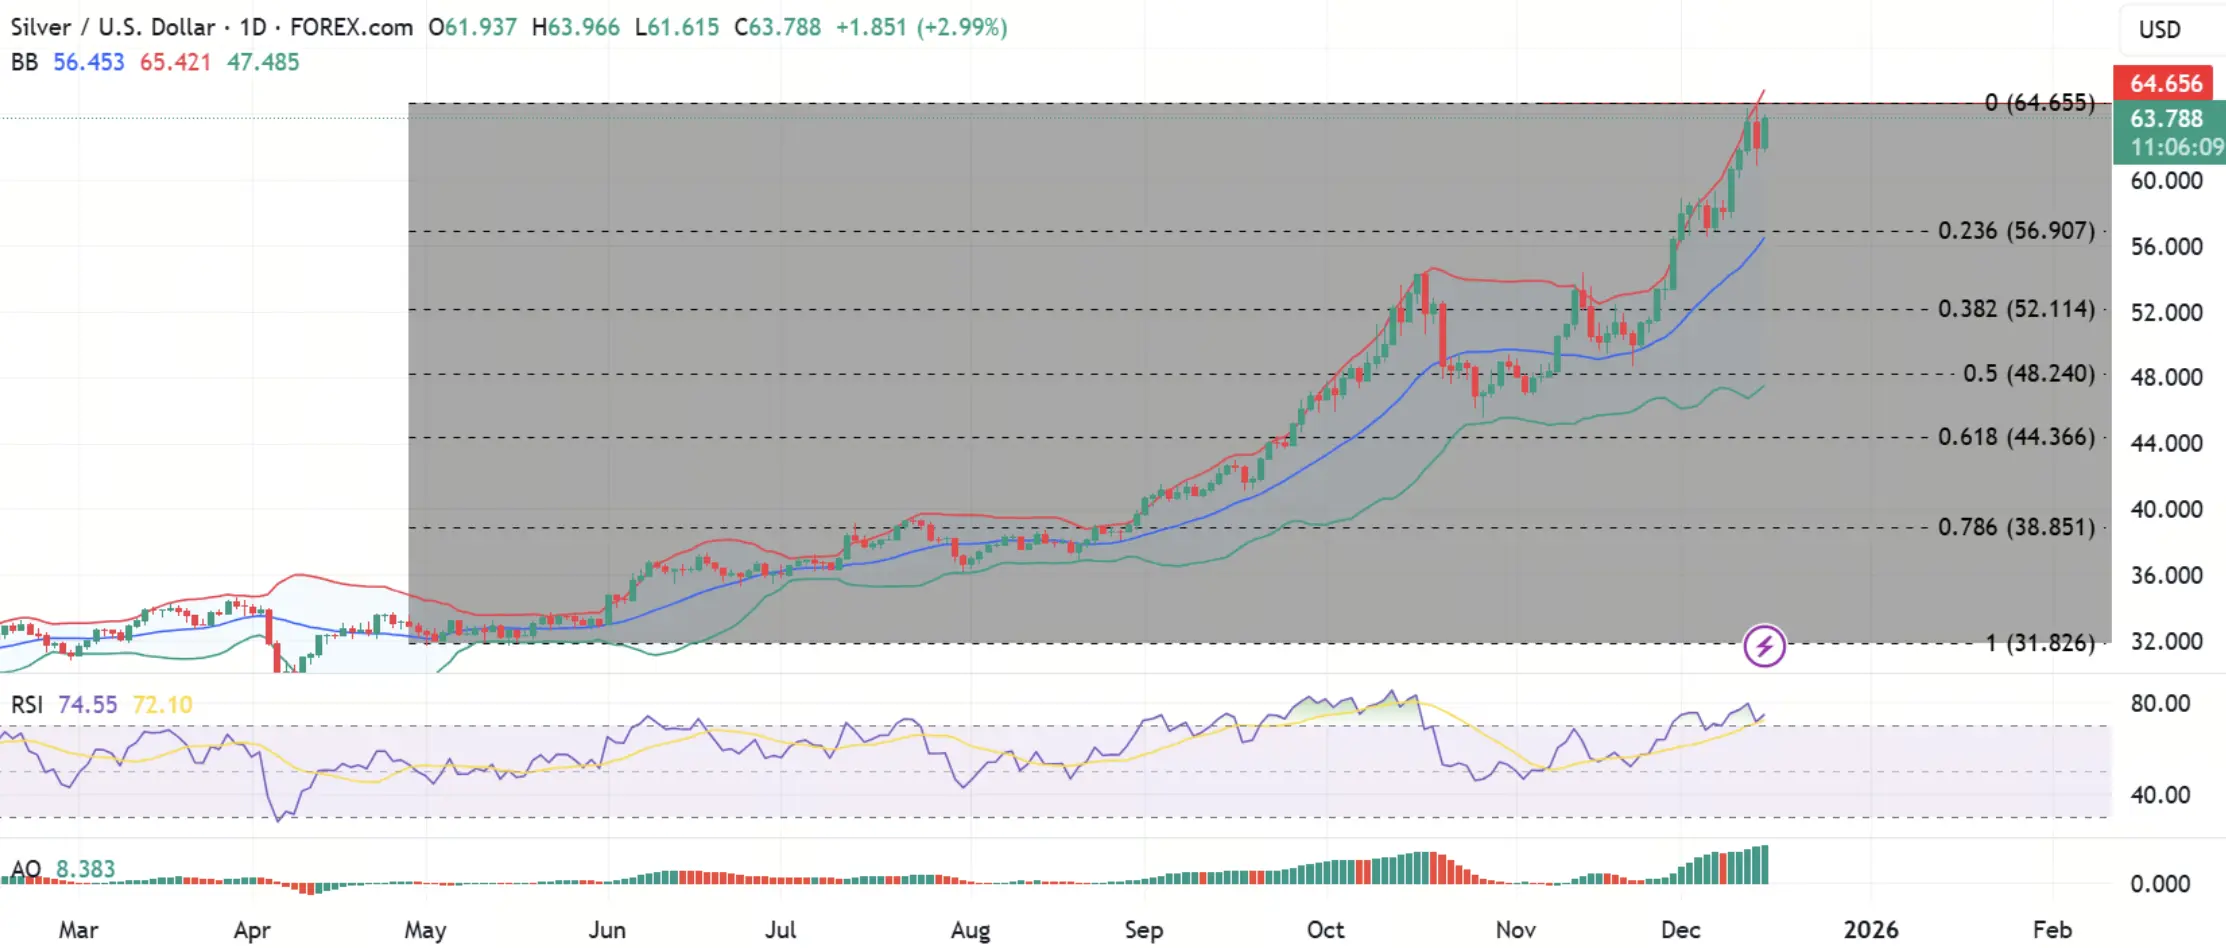
Silver’s daily chart is the most aggressively bullish of the trio, surging into the $64–$65 resistance zone with a clear series of higher highs and lows since mid-year.
The trend is supported by a rising Bollinger Band midline and sustained trading above key moving averages.
(Sources: TradingView)
However, momentum indicators scream caution: RSI near 74 signals deeply overbought conditions—historically a precursor to pullbacks rather than immediate collapses. The Awesome Oscillator remains strongly positive, confirming underlying bullish strength.
Downside watch levels:
- $56.90 (23.6% Fibonacci) – shallow, healthy retracement zone.
- $52.10 (38.2% Fibonacci) – would test trend conviction.
- Below $44.56 (61.8% Fibonacci) – invalidates the bullish structure.
Upside potential beyond $65 opens significant extension if cleared convincingly.
Silver remains in a powerful uptrend, but overbought readings demand respect—volatility and mean reversion are likely before the next sustainable leg higher.
Outlook Ahead of CPI and BoJ Decision
With major macro catalysts looming—U.S. CPI on Thursday and a near-certain BoJ hike on Friday—Bitcoin, gold, and silver are primed for swings.
Bitcoin faces the toughest structural hurdles, gold looks poised for a tactical pause within a bull trend, and silver offers the strongest momentum but with the highest near-term correction risk.
Traders should prioritize risk management: wait for confirmation on breakouts and use defined support levels for entries on pullbacks.
Disclaimer: The information on this page may come from third parties and does not represent the views or opinions of Gate. The content displayed on this page is for reference only and does not constitute any financial, investment, or legal advice. Gate does not guarantee the accuracy or completeness of the information and shall not be liable for any losses arising from the use of this information. Virtual asset investments carry high risks and are subject to significant price volatility. You may lose all of your invested principal. Please fully understand the relevant risks and make prudent decisions based on your own financial situation and risk tolerance. For details, please refer to
Disclaimer.
Related Articles
BTC falls 0.44% in 15 minutes: ETF fund outflows and derivatives shorts add to the slide
From 21:45 to 22:00 (UTC) on April 19, 2026, the BTC price dropped by 0.44% within 15 minutes. The candlestick range was 74,366.1 to 74,789.3 USDT, with an amplitude of 0.57%. Short-term volatility was concentrated. During this period, the trading volume for large orders rose significantly, market attention increased, and volatility intensified.
The main driving force behind this deviation was that U.S. spot Bitcoin ETFs saw a large net outflow of $291 million over two days from April 18 to April 19. This reflected institutional funds pulling away in the short term, which led to a marked increase in sell pressure in the spot market. At the same time, BTC perpetual contract
GateNews1h ago
BTC falls below 74000 USDT
Gate News bot message, Gate market data shows that BTC has fallen below 74000 USDT, with a current price of 73979.6 USDT.
CryptoRadar1h ago
BTC dips slightly by 0.53% in 15 minutes: whale transfers increase sell pressure and amplified liquidity widen the short-term drop
From 17:45 to 18:00 (UTC) on 2026-04-19, within 15 minutes BTC’s spot price fell -0.53%, with a price range of 74648.4 to 75212.8 USDT and a swing of 0.75%. During this period, market attention increased, volatility clearly accelerated, and the magnitude of the abnormal move exceeded typical levels for the same timeframe.
The main driver behind this abnormal move was that large-whale accounts concentrated transfers of BTC to a certain major exchange; the All Exchanges Whale Ratio (EMA14) rose to a near-ten-month high, and sell pressure increased significantly in a short time, becoming a direct cause of the spot price decline.
GateNews5h ago
BTC falls below 75,000 USDT
Gate News bot message, Gate quotes show that BTC has fallen below 75,000 USDT, with a current price of 74,985.2 USDT.
CryptoRadar5h ago
BTC breaks through 76000 USDT
Gate News bot message, Gate market shows, BTC breaks through 76000 USDT, current price is 76071.4 USDT.
CryptoRadar9h ago
