
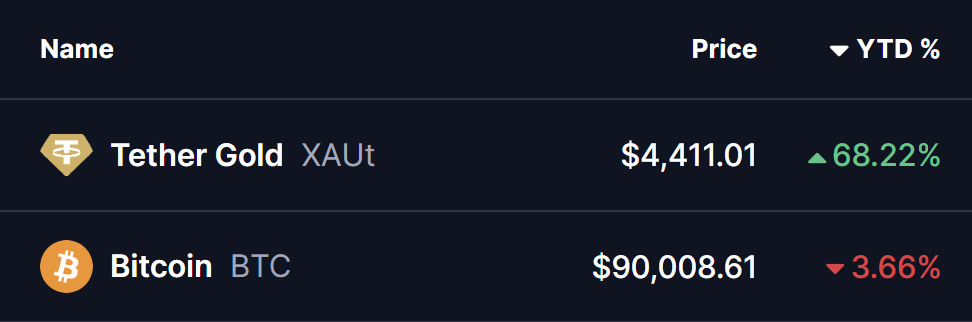
Gold has officially punched through the $4,400 mark, hitting a fresh all-time high of $4,421 today, December 22, 2025. This historic move crowns a blistering year for the “yellow metal,” which is now up over 68% in 2025 while **Bitcoin (BTC),** often called Digital Gold, is down 3.79% this year.
While gold dominates the headlines, seasoned analysts are looking at a different chart: The Bitcoin-to-Gold Fractal. Historically, Bitcoin doesn’t move with gold—it follows it with a strategic delay.
Source: Coinmarketcap
Historical Gold Fractal Hints at Bullish Potential
The latest analysis shared by crypto analyst @Osemka8 highlights how Bitcoin’s current price action closely mirrors the structure that played out for gold during the 1970s.
Back then, gold experienced a strong initial rally, followed by a multi-year consolidation phase that frustrated investors and created doubts about further upside. That pause ultimately proved to be a launchpad, as gold later entered a parabolic expansion phase that redefined its valuation for decades.
When overlaying Bitcoin’s long-term chart against gold’s historical fractal, the similarities become difficult to ignore. Bitcoin’s rise from its early-cycle lows mirrors gold’s initial breakout phase, while the current multi-month consolidation near the $85,000–$90,000 range closely aligns with gold’s mid-cycle pause before its next leg higher.
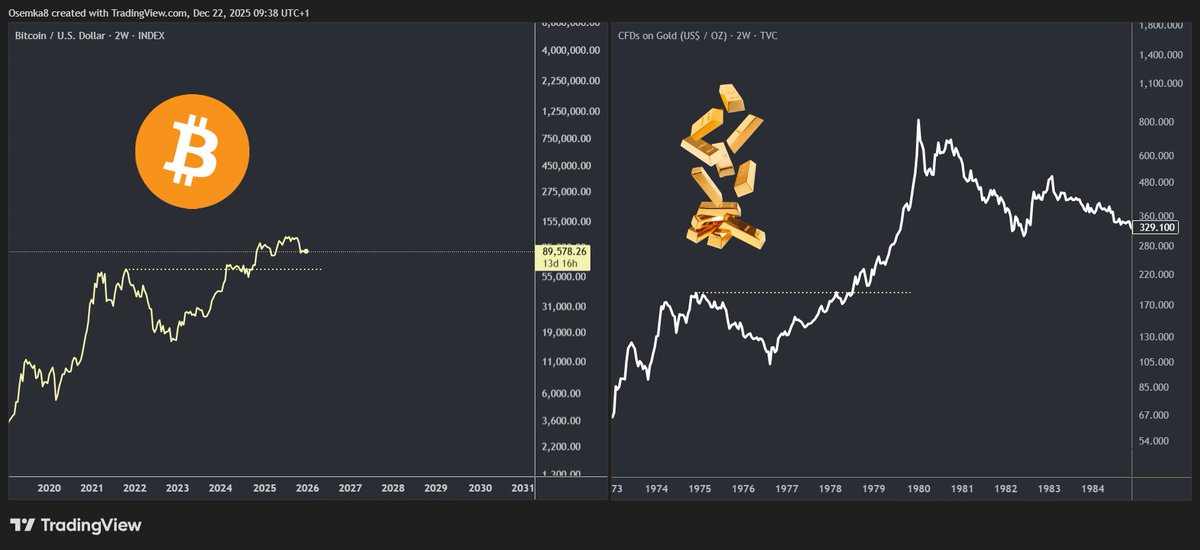
BTC-GOLD Fractal Chart/Credits: @Osemka8 (X)
The chart suggests that Bitcoin is not breaking down — it is digesting gains, much like gold did before its historic surge.
Bitcoin’s Consolidation May Be Strength, Not Weakness
Despite gold stealing the spotlight, Bitcoin has quietly maintained a higher-timeframe structure of higher highs and higher lows. The recent correction from the $120,000 region appears more consistent with a macro reset than a trend reversal.
Much like gold in the 1970s, Bitcoin’s current range-bound behavior may be acting as a transfer of supply from short-term traders to longer-term holders. This phase often feels slow and unconvincing, but historically, it has preceded some of Bitcoin’s strongest expansion moves.
Another key similarity lies in relative underperformance. In past cycles, Bitcoin has often lagged traditional hedges during periods of macro uncertainty, only to later outperform them once confidence returns and liquidity expands.
What’s Next for BTC?
If the gold-to-Bitcoin fractal continues to play out, Bitcoin’s current consolidation could represent the final base before a renewed upside phase. A sustained break above the upper consolidation range would likely shift sentiment rapidly, opening the door for a broader trend continuation toward new highs.
That said, fractals are not guarantees. They serve as historical context rather than precise forecasts. Timing, macro liquidity conditions, and investor sentiment will all play critical roles in determining whether Bitcoin follows gold’s historic footsteps.
For now, the chart delivers a clear message: gold has already moved — and Bitcoin may simply be next in line.
Disclaimer: The views and analysis presented in this article are for informational purposes only and reflect the author’s perspective, not financial advice. Technical patterns and indicators discussed are subject to market volatility and may or may not yield the anticipated results. Investors are advised to exercise caution, conduct independent research, and make decisions aligned with their individual risk tolerance.
Disclaimer: The information on this page may come from third parties and does not represent the views or opinions of Gate. The content displayed on this page is for reference only and does not constitute any financial, investment, or legal advice. Gate does not guarantee the accuracy or completeness of the information and shall not be liable for any losses arising from the use of this information. Virtual asset investments carry high risks and are subject to significant price volatility. You may lose all of your invested principal. Please fully understand the relevant risks and make prudent decisions based on your own financial situation and risk tolerance. For details, please refer to
Disclaimer.
Related Articles
Bitcoin 8-Hour Average Funding Rate Turns Negative at -0.01%
Gate News message, April 22 — According to Coinglass data, Bitcoin's 8-hour average funding rate across the network currently stands at -0.01%, indicating a slight bearish sentiment among futures traders.
Among major exchanges, funding rates vary: one exchange at -0.0007%, another at -0.0033%, a th
GateNews49m ago
BTC 24H up 5.01%, current price 79399.3 USDT
Gate News bot message, Gate market data shows, BTC has risen 5.01% in the last 24 hours, current price is 79399.3 USDT.
CryptoRadar57m ago
MicroStrategy Could Drive Bitcoin to $10M If It Accumulates 7.5% Supply, Saylor Says
MicroStrategy aims for 7.5% of Bitcoin supply, implying $10M per BTC; as of Apr 19 it held 815,061 BTC (~3.88%) for $61.56B, needing ~3.62% more to target saturation in Saylor’s long‑term accumulation plan.
Abstract: MicroStrategy seeks to accumulate roughly 7.5% of Bitcoin supply, a threshold Saylor suggests could push BTC to about $10 million and slow purchases thereafter. By April 19 it owned 815,061 BTC (≈3.88% of supply) for $61.56B and would require about 3.62 percentage points more to reach the target, indicating a approaching saturation of its long-run accumulation strategy.
GateNews1h ago
Bitcoin Liquidation Cascade: $2.054B Long Liquidation at $74,880, $1.224B Short Liquidation at $82,692
Coinglass data show BTC below $74,880 could trigger $2.054B in long liquidations on major CEXs; BTC above $82,692 could trigger $1.224B in short liquidations.
GateNews2h ago
Bitcoin and Ethereum Spot ETFs Record Consecutive Net Inflows; BTC ETFs Reach $99.08B in Assets
Abstract: Bitcoin and Ethereum spot ETFs posted net inflows on Apr 21, extending multi-day streaks. BTC inflows were led by BlackRock’s IBIT and Grayscale, with GBTC outflows; ETH inflows were led by ETHA, with ETHE outflows.
Summary: Bitcoin and Ethereum spot ETFs posted Apr 21 inflows, extending gains; BTC led by IBIT and Grayscale with GBTC outflows, NAV $99.08B (6.54%). ETH inflows topped by ETHA, ETHE outflows; NAV $13.66B, inflows $12.05B.
GateNews3h ago
Expert Observes a Bullish 90-Day Bitcoin Pattern Repeating, BTC Could Hit $145,000 ATH Target
Expert observes a bullish 90-day Bitcoin pattern repeating.
He declares accumulation phase complete and expects manipulation phase to start.
BTC could hit $145,000 ATH target in the final distribution phase.
The crypto market has been moving in an upwards direction after weeks of
CryptoNewsLand3h ago