

Bitcoin’s recent price action has been frustrating for a lot of traders. Rallies during the day keep getting sold into, while overnight moves often look calmer or even slightly constructive.
When you zoom out and look at session-based data, the reason becomes much clearer. According to analysis shared by NoLimit, most of the selling is coming from the U.S. and Europe, while Asia is quietly doing the opposite.
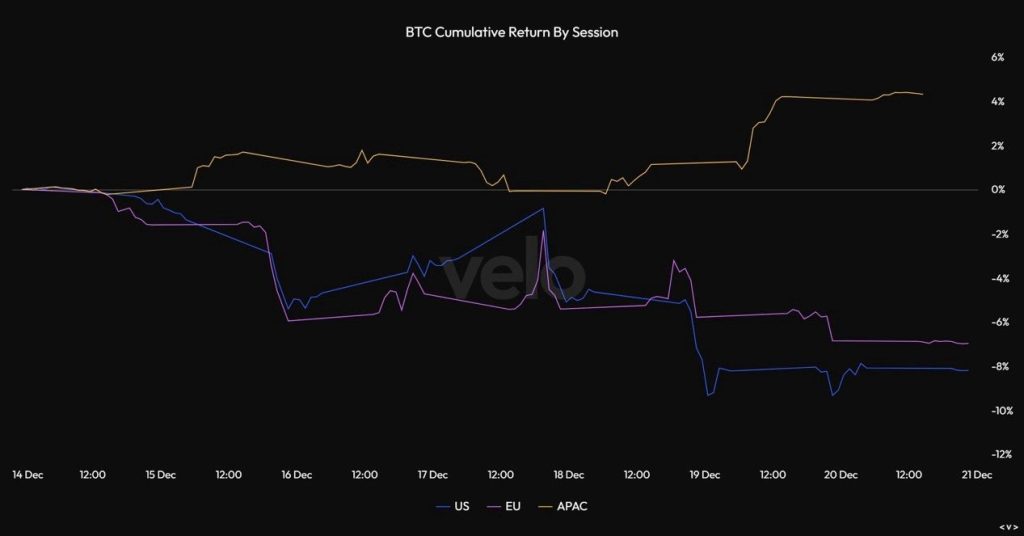
The chart shows Bitcoin’s cumulative return by session, and it tells that story clearly. It’s the same asset, but completely different behavior depending on which part of the world is active.
- U.S. and European Trading Hours Are Dragging BTC Price Lower
- Asia Is Quietly Buying the Dips
- BTC Session Flows Show a Familiar Setup
- What Comes Next For Bitcoin?
U.S. and European Trading Hours Are Dragging BTC Price Lower
During U.S. trading hours, shown in blue on the chart, Bitcoin has been bleeding lower almost consistently. Losses tend to build throughout the session, making the U.S. market the main source of downside pressure. The European session, shown in purple, follows a similar path, though the selling there appears more gradual.
This isn’t random selling. It lines up with what’s happening behind the scenes. ETF rebalancing near year-end, tax-related selling, and a broader risk-off stance from funds are all playing a role.
With macro uncertainty still hanging over markets, many Western investors seem more focused on cutting exposure than taking new risk.
Asia Is Quietly Buying the Dips
Asia tells a very different story. The orange line on the chart shows steady accumulation during Asian trading hours. Instead of reacting to intraday volatility, buyers in this region appear to be treating pullbacks as opportunities.
This helps explain a pattern many traders have noticed. Bitcoin often stabilizes or even moves higher overnight, only to give those gains back once U.S. markets open. Asia absorbs supply, and then Western markets push the price lower again.
BTC Session Flows Show a Familiar Setup
However, as NoLimit stated, such behavior is nothing out of the ordinary. This also happened in the March 2019 crisis, then the March 2020 flash crash, and at the end of 2022.
Both times Western markets led the selling during times of uncertainty, meanwhile the buyers in Asia quietly built up their positions.

Source: X/@NoLimitGains
Those moments didn’t lead to instant reversals, but they did lay the groundwork for future recoveries. Over time, the BTC price followed the steady accumulation rather than short-term fear.
What this chart really shows is that recent Bitcoin drops aren’t necessarily about demand disappearing. They’re more about where the selling is coming from. ETF adjustments and fund de-risking hit during U.S. and EU hours, while Asia continues to buy into weakness.
That doesn’t mean a bottom is guaranteed right away, but it does add important context. Bitcoin’s price action looks very different when viewed through session flows instead of just headlines or short-term charts.
Read Also: Whales Are Still Selling Bitcoin: A Warning Sign for BTC Price
What Comes Next For Bitcoin?
For now, Bitcoin remains under pressure during Western trading hours, while Asia keeps accumulating in the background.
As NoLimit indicates, the BTC price eventually tends to follow the buyers. Watching who is consistently stepping in may matter more than reacting to every intraday dip.
Disclaimer: The information on this page may come from third parties and does not represent the views or opinions of Gate. The content displayed on this page is for reference only and does not constitute any financial, investment, or legal advice. Gate does not guarantee the accuracy or completeness of the information and shall not be liable for any losses arising from the use of this information. Virtual asset investments carry high risks and are subject to significant price volatility. You may lose all of your invested principal. Please fully understand the relevant risks and make prudent decisions based on your own financial situation and risk tolerance. For details, please refer to
Disclaimer.
Related Articles
BTC falls 0.44% in 15 minutes: ETF fund outflows and derivatives shorts add to the slide
From 21:45 to 22:00 (UTC) on April 19, 2026, the BTC price dropped by 0.44% within 15 minutes. The candlestick range was 74,366.1 to 74,789.3 USDT, with an amplitude of 0.57%. Short-term volatility was concentrated. During this period, the trading volume for large orders rose significantly, market attention increased, and volatility intensified.
The main driving force behind this deviation was that U.S. spot Bitcoin ETFs saw a large net outflow of $291 million over two days from April 18 to April 19. This reflected institutional funds pulling away in the short term, which led to a marked increase in sell pressure in the spot market. At the same time, BTC perpetual contract
GateNews1h ago
BTC falls below 74000 USDT
Gate News bot message, Gate market data shows that BTC has fallen below 74000 USDT, with a current price of 73979.6 USDT.
CryptoRadar1h ago
BTC dips slightly by 0.53% in 15 minutes: whale transfers increase sell pressure and amplified liquidity widen the short-term drop
From 17:45 to 18:00 (UTC) on 2026-04-19, within 15 minutes BTC’s spot price fell -0.53%, with a price range of 74648.4 to 75212.8 USDT and a swing of 0.75%. During this period, market attention increased, volatility clearly accelerated, and the magnitude of the abnormal move exceeded typical levels for the same timeframe.
The main driver behind this abnormal move was that large-whale accounts concentrated transfers of BTC to a certain major exchange; the All Exchanges Whale Ratio (EMA14) rose to a near-ten-month high, and sell pressure increased significantly in a short time, becoming a direct cause of the spot price decline.
GateNews5h ago
BTC falls below 75,000 USDT
Gate News bot message, Gate quotes show that BTC has fallen below 75,000 USDT, with a current price of 74,985.2 USDT.
CryptoRadar5h ago
BTC breaks through 76000 USDT
Gate News bot message, Gate market shows, BTC breaks through 76000 USDT, current price is 76071.4 USDT.
CryptoRadar9h ago
