Date: Mon, Dec 22, 2025 | 06:56 AM GMT
The broader altcoin market has experienced choppy and largely directionless price action over the past several weeks, a phase that began after the sharp sell-off on October 10. That correction dragged Ethereum (ETH) down from the sub-$4,700 region to the $3,000 area, leaving traders cautious and overall risk appetite muted. Over the last 60 days alone, ETH has declined by nearly 21%, reinforcing a short-term bearish narrative across the altcoin space.
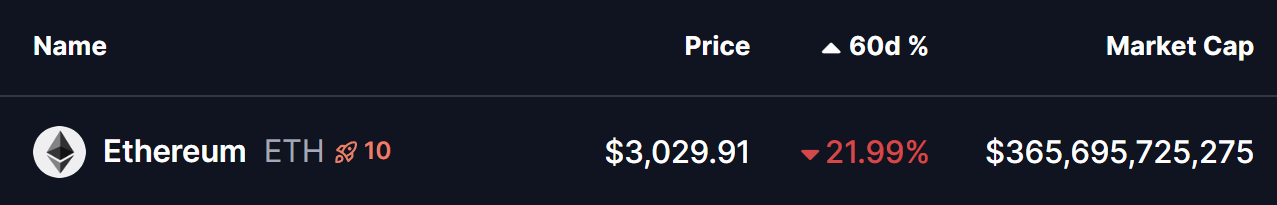
Source: Coinmarketcap
However, beneath the surface, the higher-timeframe technical structure is starting to hint at something far more constructive. Long-term signals on the ETH/BTC chart are now aligning in a way that has historically preceded major altcoin expansions, raising the possibility that the current weakness could be laying the groundwork for a bullish reversal into 2026.
ETH/BTC Chart Hints at a Bullish Altcoin Expansion
According to the latest analysis shared by @el_crypto_prof, the ETH/BTC weekly chart has once again recreated a structure that closely mirrors previous cycle transitions. This setup focuses on the interaction between the SMA100 and EMA100, two moving averages that have historically defined the beginning and end of major altcoin cycles.
In past market cycles, altcoin bull markets have tended to begin when the SMA100 crosses below the EMA100 — a bearish crossover that, counterintuitively, has marked long-term bottoms rather than tops. These moments often coincided with peak pessimism, underperformance of ETH versus BTC, and broad disinterest in altcoins.
Conversely, altcoin bull markets have historically ended when the SMA100 crosses back above the EMA100, signaling overheating conditions and the return of Bitcoin dominance.
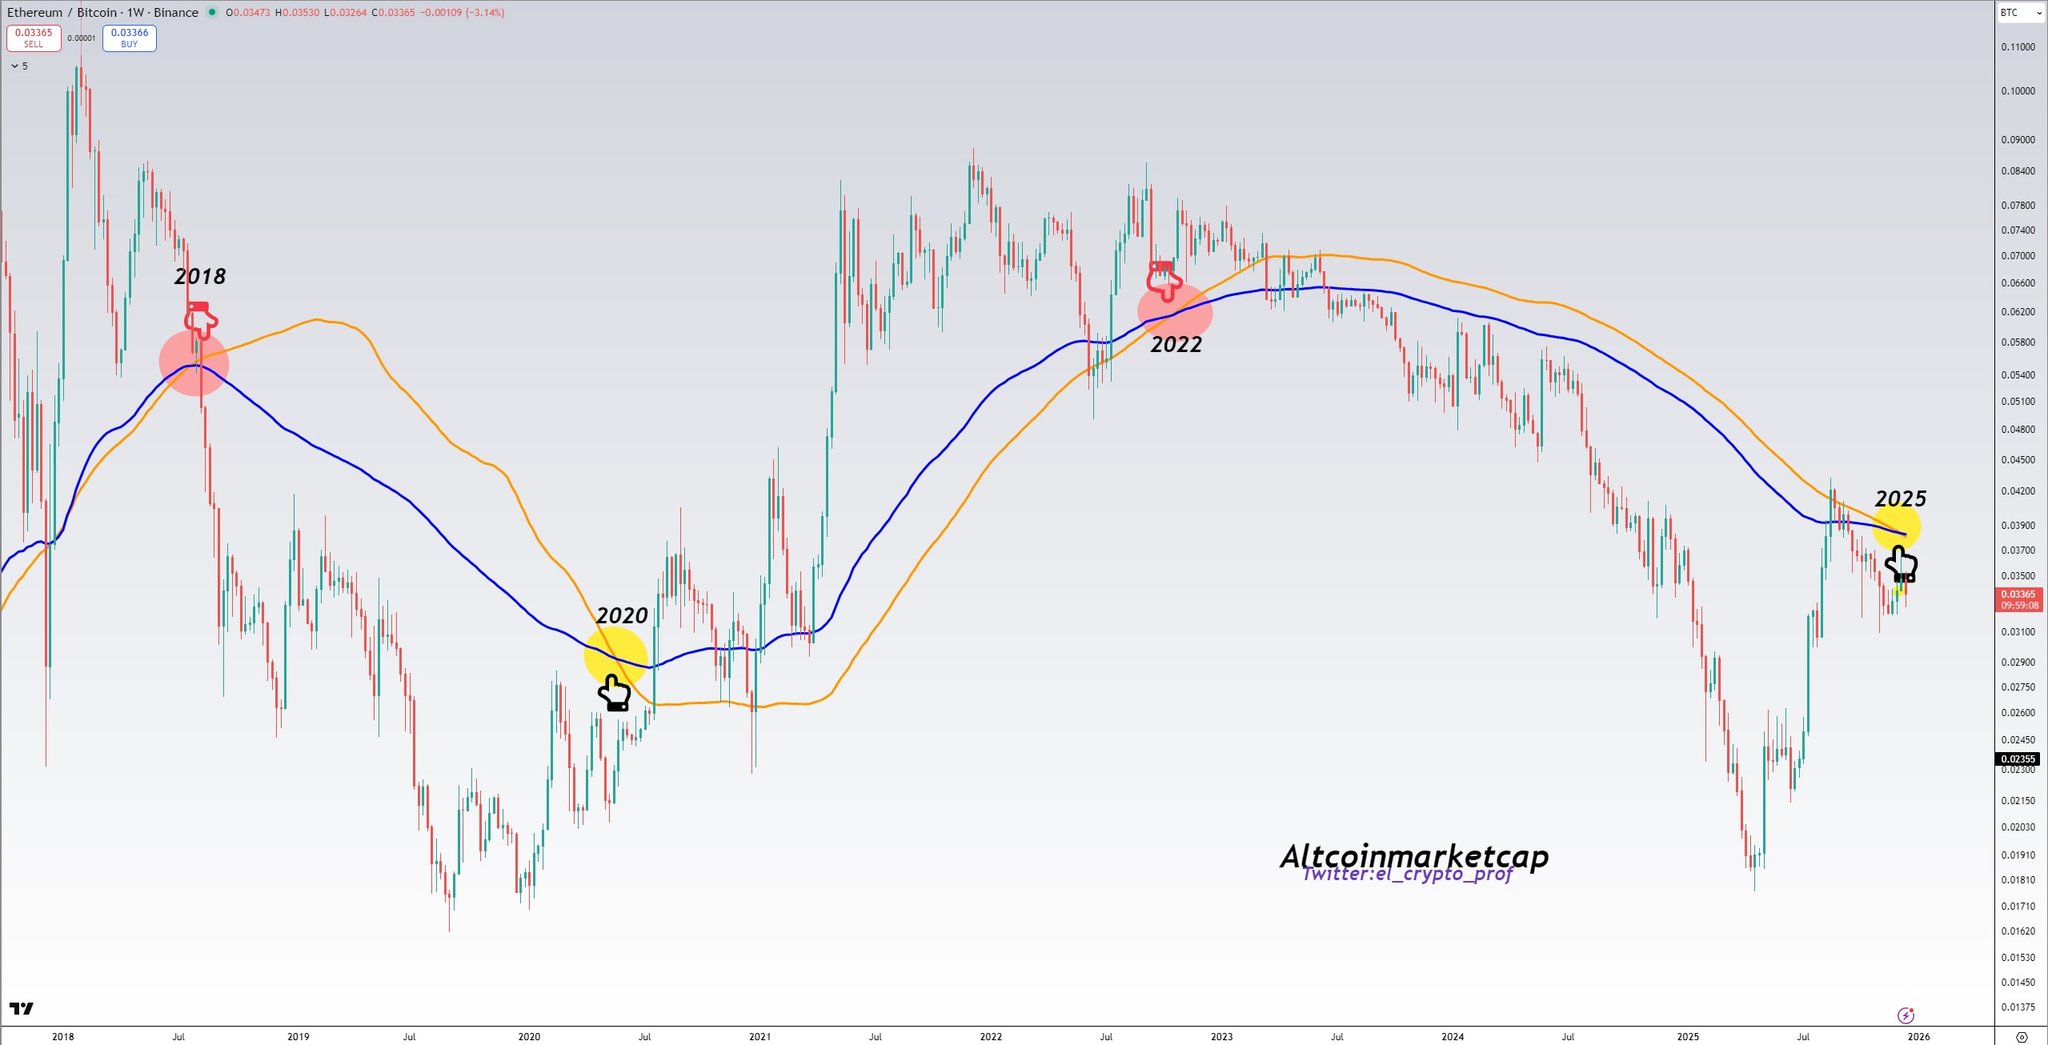
ETH-BTC Pair Chart/Credits: @el_crypto_prof (X)
The chart highlights three key moments:
In 2018, the bullish crossover marked the end of the altcoin cycle and preceded prolonged underperformance.
In 2020, the bearish crossover aligned closely with the start of a powerful altcoin expansion that carried into 2021.
In 2022, the bullish crossover once again signaled exhaustion and the onset of another prolonged correction.
Now, in 2025, the ETH/BTC pair has once again printed a bearish SMA100–EMA100 crossover, placing the market at a familiar inflection point. Historically, this has been the zone where altcoins quietly transition from distribution to accumulation.
What’s Next for Altcoins?
If this long-term setup continues to play out as it has in previous cycles, the coming months could mark the early stages of a broader altcoin recovery rather than the continuation of a downtrend. While short-term volatility and further downside cannot be ruled out, the structural signal suggests that downside risk may be gradually diminishing.
For altcoins, this phase has typically been characterized by range-bound price action, selective accumulation, and patience — followed by a sharp expansion once momentum returns and capital begins rotating out of Bitcoin.
Importantly, this is not a timing signal for immediate upside. Long-term moving average crossovers operate on a macro scale and often precede major rallies by months. But they do provide context: historically, these moments have offered some of the best risk-reward conditions for long-term altcoin exposure.
As 2026 approaches, the ETH/BTC chart suggests the altcoin market may be closer to a structural reset than many currently expect. If history repeats, today’s consolidation could ultimately be remembered as the calm before the next major altcoin cycle.
Disclaimer: The views and analysis presented in this article are for informational purposes only and reflect the author’s perspective, not financial advice. Technical patterns and indicators discussed are subject to market volatility and may or may not yield the anticipated results. Investors are advised to exercise caution, conduct independent research, and make decisions aligned with their individual risk tolerance.
Disclaimer: The information on this page may come from third parties and does not represent the views or opinions of Gate. The content displayed on this page is for reference only and does not constitute any financial, investment, or legal advice. Gate does not guarantee the accuracy or completeness of the information and shall not be liable for any losses arising from the use of this information. Virtual asset investments carry high risks and are subject to significant price volatility. You may lose all of your invested principal. Please fully understand the relevant risks and make prudent decisions based on your own financial situation and risk tolerance. For details, please refer to
Disclaimer.
Related Articles
Bittensor Price Jumps Above $300 After Nvidia CEO Remarks
Key Insights:
The Bittensor price surged over 20% in 24 hours, crossing $300 after Nvidia CEO remarks boosted confidence in decentralized AI adoption.
Trading volume exceeded $677 million, marking the highest level since November and signaling strong participation and improving liquidity
CryptoNewsLandJust Now
观点:比特币受制于7.2万美元下方,链上四大指标显示需求走弱
比特币价格持续低于7.2万美元,市场需求减弱,投资者开始抛售,短期上涨空间受限。链上活跃度和矿业算力下降,矿工盈利能力疲弱,市场对矿工抛售的担忧加剧。
BlockBeatNews1m ago
XRP Burn Rate Surges 313% as Network Activity Climbs
Key Insights
XRP burn rate surged 313% in one day, reaching 2,491 tokens, reflecting strong transaction growth and heightened network demand during the recent rally.
Large XRP holders increased, with addresses holding over 100,000 XRP rising to 32,054, signaling continued accumulation
CryptoNewsLand5m ago
Is Solana (SOL) 'Hidden Gem?' Long/Short Ratio Signals Unusual Activity - U.Today
Longs piling up
Market leaning bullish
After a larger decline Solana is currently trading in a weak recovery phase around $84-$85. The price is still under pressure on longer time frames, but it is making an effort to stabilize locally. Although the structure is not yet bullish, it is also no lon
UToday14m ago
XRP Eyes 37% Rally to $2 as Rare 'Golden Cross' Signal Appears on Daily Price Chart - U.Today
According to current chart data by TradingView, XRP has successfully confirmed an important technical signal, known as a golden cross, which sets an ambitious target for the price — a 37% increase in the near term
Is breakout above 200-day moving average next?
At the moment, XRP’s price has
UToday34m ago
Here’s Why Siren (SIREN) Price Is Exploding
SIREN's price surged by 135% due to speculation, fueled by increased futures trading and leveraged investments. Despite a bullish chart pattern, significant risks arise from supply concentration. Caution is advised as the volatile price may reverse.
CaptainAltcoin51m ago
