Date: Fri, Dec 19 2025 | 12:45 PM GMT
The broader cryptocurrency market is showing relative strength despite concerns around the Japan rate hike. Cooling U.S. inflation has helped both Bitcoin (BTC) and Ethereum (ETH) hold in the green, and this stability is beginning to spill over into select altcoins, including Stellar (XLM).
XLM has posted modest gains today, but beyond the short-term price move, the daily chart is starting to reveal an emerging technical structure that could set the stage for a more meaningful recovery if key levels continue to hold.
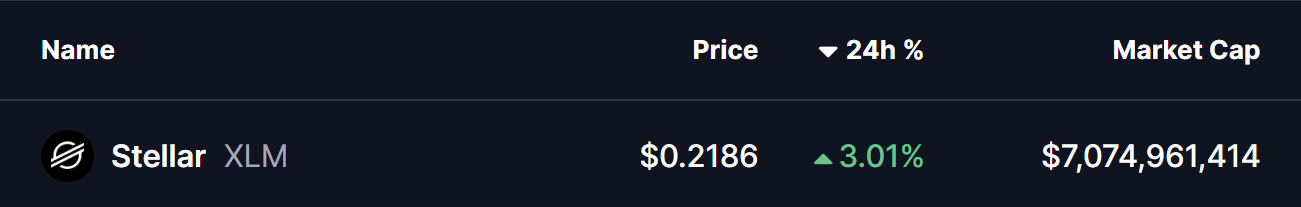
Source: Coinmarketcap
Harmonic Pattern Signals Potential Upside
On the daily timeframe, XLM appears to be forming a Bearish Cypher harmonic pattern — a setup that often generates upside momentum during its final CD leg before price reaches the Potential Reversal Zone (PRZ).
The pattern began at point X near the $0.3113 region, where XLM topped out before entering a sharp corrective phase. Price then declined into point A, followed by a rebound toward point B. From there, XLM rolled over again and extended lower into point C around the $0.2029 area, completing the core structure of the pattern.
Since tagging this low, XLM has started to stabilize and grind higher, currently trading near the $0.2188 level. This slow but steady recovery suggests that selling pressure may be fading, with buyers beginning to defend the recent lows more aggressively.
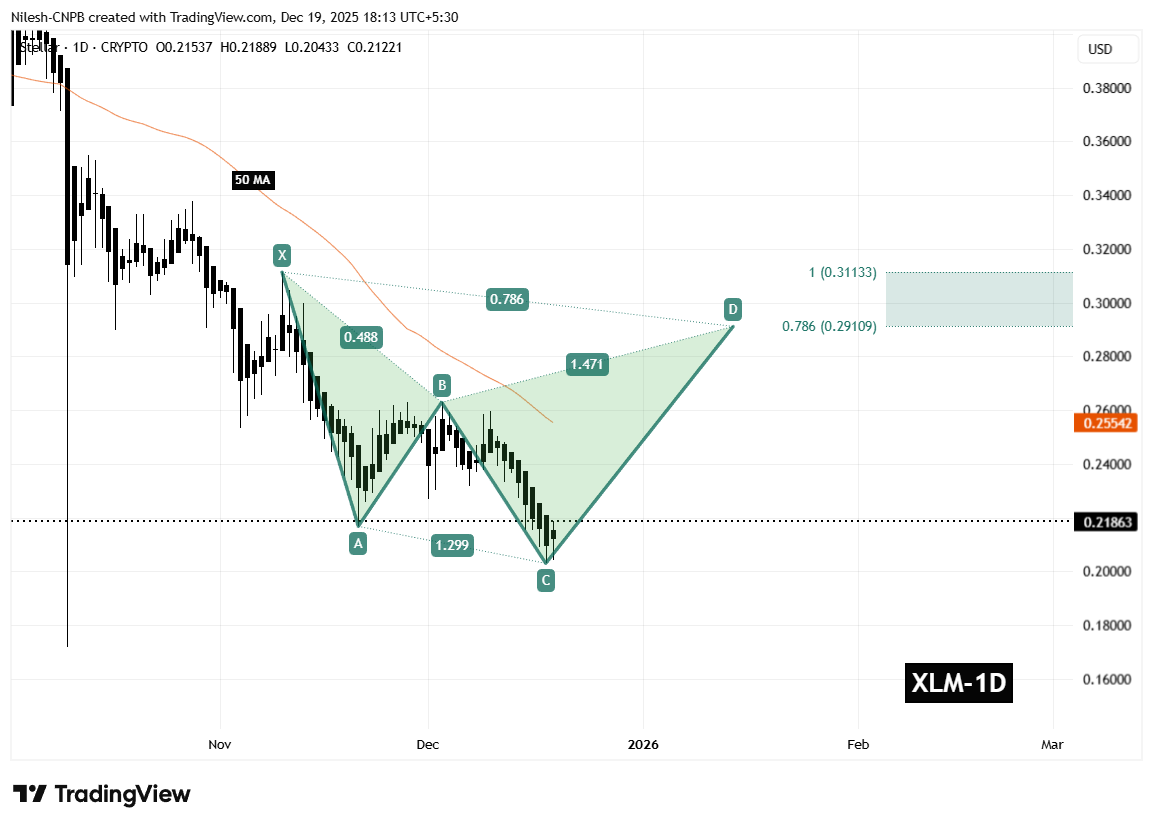
Stellar (XLM) Daily Chart /Coinsprobe (Source: Tradingview)
A key technical factor aligning with this structure is the 50-day moving average, currently positioned near $0.2554. This moving average has consistently acted as dynamic resistance throughout the downtrend and represents an important hurdle for bulls to overcome in the near term.
What’s Next for XLM?
In the short term, the most critical level to monitor is the C-leg support around $0.2029. As long as XLM holds above this zone, the harmonic pattern remains valid and the bullish CD-leg scenario stays intact.
If price continues to build strength from this base, the next major test will be a reclaim of the 50-day moving average near $0.2554. A decisive break and close above this level would signal improving momentum and could accelerate upside continuation.
Based on the harmonic structure, the projected upside targets sit within the Potential Reversal Zone, defined between the 0.786 Fibonacci extension near $0.2910 and the 1.0 extension around $0.3113. Reaching this zone would represent a potential upside of roughly 40–45% from current price levels, making it a key area where profit-taking or stronger resistance could emerge.
On the downside, failure to hold above the $0.2029 support would significantly weaken the bullish setup. A breakdown below this level could invalidate the harmonic structure and expose XLM to deeper downside pressure before any sustainable recovery attempt develops.
For now, the chart suggests Stellar is sitting at an important technical crossroads. While confirmation is still needed, the presence of a well-defined harmonic pattern indicates that a short- to medium-term bounce remains a realistic possibility if buyers continue to defend current levels and reclaim key resistance zones.
Disclaimer: The views and analysis presented in this article are for informational purposes only and reflect the author’s perspective, not financial advice. Technical patterns and indicators discussed are subject to market volatility and may or may not yield the anticipated results. Investors are advised to exercise caution, conduct independent research, and make decisions aligned with their individual risk tolerance.
Disclaimer: The information on this page may come from third parties and does not represent the views or opinions of Gate. The content displayed on this page is for reference only and does not constitute any financial, investment, or legal advice. Gate does not guarantee the accuracy or completeness of the information and shall not be liable for any losses arising from the use of this information. Virtual asset investments carry high risks and are subject to significant price volatility. You may lose all of your invested principal. Please fully understand the relevant risks and make prudent decisions based on your own financial situation and risk tolerance. For details, please refer to
Disclaimer.
Related Articles
Bitcoin 'done' with 85% crashes, says Cathie Wood amid new $34K target
Bitcoin (BTC) is “done” with drawdowns of 85% or more from all-time highs, says ARK Invest CEO, Cathie Wood.
Key points:
Bitcoin will not see another correction of 85% or more versus its latest all-time high, Cathie Wood argues.
A new prediction sees $34,000 becoming the next BTC
Cointelegraph1h ago
Cathie Wood: BTC has entered a mature stage; 85%-95% will either experience a deep drop or become a thing of the past
ARK Invest founder Cathie Wood says Bitcoin has entered a mature phase, and that the large drawdowns of the past may be behind us— even a future 50% pullback would be considered progress. She noted that Bitcoin has grown into a mature monetary system and asset class.
GateNews1h ago
Ripple CTO Emeritus Challenges 'No-Freeze' Stablecoin Idea, What Are Risks? - U.Today
Ripple CTO Emeritus David Schwartz critiqued Omid Malekan's stablecoin prediction, questioning the feasibility of a non-intervention model in complying with legal obligations. Schwartz's inquiries highlighted potential challenges in redeeming stablecoins if issuers don't intervene, as well as implications for fractional reserve practices.
UToday1h ago
BTC is trading in a tight range around $67,000, and SOL futures open interest hits a new two-month high
On April 3, the crypto market continued to trade in choppy conditions. Bitcoin was consolidating around $67,000, maintaining its broader downward trend that began last October. The futures market saw thin trading, with Solana futures open interest hitting a new high, and the volatility index falling to its lowest level since February. Market structure indicates that short positions are increasing.
GateNews2h ago
Crypto consolidates as volatility cools and futures markets tilt bearish
The crypto market continued to exhibit signs of choppiness on Friday, with bitcoin BTC$66,729.05 trading at $67,000 in the middle of a trading range that spans back to early February.
A selection of altcoins picked up during the lower liquidity Asia hours, prompting the likes of ALGO and RENDER to
CoinDesk2h ago
Reputed Crypto Trader Calls the Bottom at $54,000 BTC Price, Bullish Expectations Grow
Reputed crypto trader calls the bottom at $54,000 BTC price.
This led to a massive surge in price pump expectations.
The price of BTC could rally towards new ATH prices after the bottom is set.
The price of Bitcoin (BTC) continues to trade in the $66,000 price range, hinting at
CryptoNewsLand3h ago
