Ethereum price has plummeted over 6% in the last 24 hours, with a monthly decline of 27%. The technical chart has also broken below the key bearish flag continuation pattern. On-chain data shows that the NUPL indicator, which measures the unrealized profits of long-term holders, is sliding towards the June cycle low area, which highly coincides with the target level near $2140 indicated by technical analysis. Currently, Ethereum has dropped below its strongest cost basis support wall, and if it cannot quickly recover $2840, the next target range for the bottoming out may be locked in between $2260 and $2140.
Technical Pattern Breakdown: Bearish Flag Establishes Downward Target
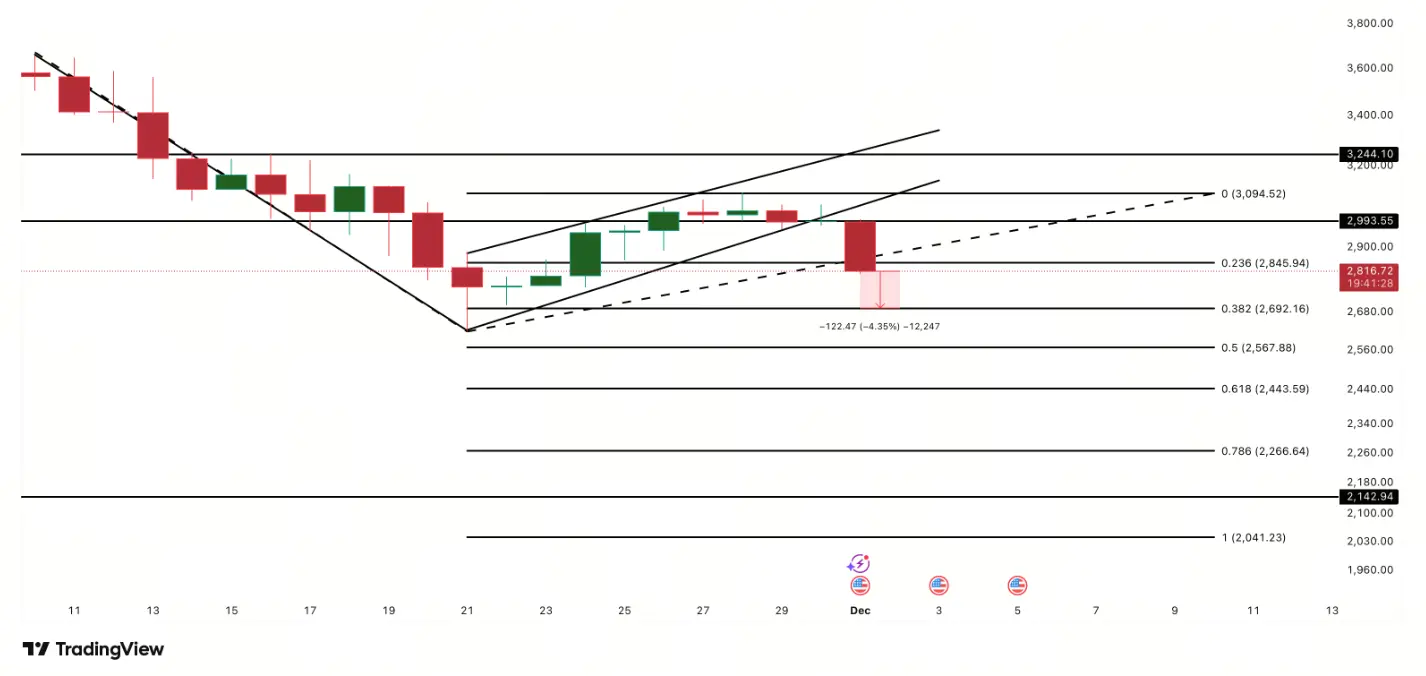
Ethereum recently broke down from a clear bearish flag pattern. This key shift began when its price was resisted and fell back at $2990, breaking below the one-week ascending channel. The so-called “flag” is a common continuation pattern in Technical Analysis, with the previous sharp fall of 28.39% from the high forming the “flagpole,” while the subsequent consolidation formed the “flag.” The current price has fallen below the lower edge of the flag, marking the end of the consolidation, and the downtrend may continue.
(Source: TradingView)
According to the measurement rules of the flag pattern, the theoretical downside target activated by this breakout is around $2140. This target represents a potential decline of nearly 28% from the breakout point, providing a clear technical bearish signal for the market. A breakout of this pattern typically indicates that selling pressure is in absolute control, and unless a strong reversal signal occurs, the likelihood of the price inertia descending to the target area is increasing.
Therefore, from a purely technical analysis perspective, the short to medium-term outlook for Ethereum has become quite severe. The market is closely watching whether the price will follow the guidance of this classic pattern and test the key area downwards.
On-chain data confirms: Long-term holder confidence is weakening
The breakout of the technical chart has been corroborated by on-chain core data. The Long-Term Holder Unspent Profit/Loss (NUPL) metric is a key tool for observing the sentiment of core market participants; it measures whether long-term holders are overall in an unrealized profit or loss state. This metric has been declining continuously since August 22, indicating that long-term holders are gradually reducing their unrealized profits, showing signs of softening confidence in their positions.
Despite NUPL recording a short-term low of 0.36 on November 21, it is still some distance away from the six-month cycle low of 0.28 set on June 22. Looking back at history, when NUPL touched 0.28 in June, the price of Ethereum hovered around 2230 USD, after which the market experienced a strong rebound of over 116%.
Currently, if the market's pessimistic sentiment intensifies, causing the NUPL indicator to drop back to the cyclical low zone of 0.28, then based on Ethereum's recent local high of about 2990 USD, the implied price correction range is approximately between 20% and 25%. This range is highly consistent with the 28% decline indicated by the bearish flag pattern (target 2140 USD), both pointing towards the price range of 2140 USD to 2230 USD. This is the clearest cross-validation signal in this analysis, indicating that technical and on-chain data have formed a bearish resonance.
Support Layer by Layer Collapses: Exploring Potential Bottom Areas
As the key support level has been breached, the price structure of Ethereum has become increasingly fragile. The cost basis distribution heatmap shows that the strongest cost support wall is located between $2801 and $2823, with approximately 3.591 million ETH purchased in this range. However, the price has fallen below $2840, putting significant pressure on this core support area.
If the bulls cannot quickly organize a counterattack to regain and stabilize above 2840 USD or even 2990 USD, then the bears will continue to control the situation. Once weakness persists, the price may test a series of key levels downward according to trend extension theory.
key price levels and fall path
- First Level: 2690 USD, located about 4.5% below the current price.
- Second checkpoint: 2560 USD, a fall of about 4.6% from 2690 USD.
- Third Level: $2440, a fall of about 4.8% from $2560.
- Strong support area: $2260, which is only 2% higher than the $2230 corresponding to the June NUPL bottom.
- Final Target Area: 2140 USD, which is the full measured target of the bearish flag, located about 28% below the breakout area.
If the price of Ethereum effectively falls below 2266 USD, the scenario of falling towards the target of 2140 USD will become the most likely situation. Of course, there is still a reversal path in the market, but this requires Ethereum to show strong buying power: first, it must recover to 2840 USD, then break through 2990 USD, and finally ensure a daily close above 3090 USD. Only when the price breaks through 3240 USD (an increase of about 15% from the current level) will the entire bearish pattern be thoroughly invalidated.
Multidimensional Perspective on Ethereum Market Analysis
In addition to technical patterns and on-chain indicators, understanding the current market also requires a broader perspective. Firstly, the macro monetary policy environment, especially market expectations of the Federal Reserve's interest rate policy, continues to affect the liquidity of all risk assets, and the cryptocurrency market is no exception. Secondly, the ecological development of the Ethereum network itself, such as the adoption rate of Layer 2, changes in staking rates, and the roadmap for subsequent major upgrades, are the intrinsic cornerstones that determine its long-term value. Short-term price fluctuations may be dominated by emotions and technical aspects, but the medium to long-term trend will ultimately revert to fundamentals.
For investors, maintaining caution is the primary principle amidst such clear multiple bearish signals. In the short term, it is important to focus on whether the area between 2260 USD and 2140 USD will form an effective buying support, as well as whether the NUPL indicator will show signs of bottoming out. Any attempts to catch a falling knife should be regarded as high-risk operations, and it is recommended to adopt a strategy of gradual, small purchases while setting strict stop-losses. For trend traders, it is a more prudent choice to reduce holdings on rallies or remain on the sidelines until the price clearly recovers to 2840 USD.
Overall, Ethereum is facing triple pressures from technical breakdown, declining confidence among on-chain holders, and loosening cost support. Although the crypto market is known for its extreme volatility and rapid reversals, under the current signal combination, seeking a new bottom seems to be the path of least resistance. Whether the market will find a new cycle starting point in the range of $2140 to $2260 will depend on whether the macro environment can warm up, whether the Ethereum ecosystem can continue to attract funds, and more importantly—whether market panic will be completely released at that moment. Investors need to buckle up and prepare for the potentially bumpy journey ahead.
Disclaimer: The information on this page may come from third parties and does not represent the views or opinions of Gate. The content displayed on this page is for reference only and does not constitute any financial, investment, or legal advice. Gate does not guarantee the accuracy or completeness of the information and shall not be liable for any losses arising from the use of this information. Virtual asset investments carry high risks and are subject to significant price volatility. You may lose all of your invested principal. Please fully understand the relevant risks and make prudent decisions based on your own financial situation and risk tolerance. For details, please refer to
Disclaimer.
Related Articles
ETH rises 1.21% in 15 minutes: ETF inflows and whale fund transfers resonate to drive up the price.
2026-03-30 00:15 to 00:30 (UTC), within the 15-minute window ETH’s price surged 1.21% quickly, rising from 1981.9 USDT to 2023.69 USDT, with a range of 2.11%. Market attention increased in tandem; during this period, the ETH/USDT trading volume rose by about 15% compared with the previous interval, the buy order ratio reached 62%, overall volatility intensified, and it attracted a large influx of capital into the spotlight.
The primary driving force behind this unusual move is that ETF inflows hit a new high, while multiple institutions’ funds continued adding to their ETH holdings, causing the circulating supply to decrease significantly.
GateNews40m ago
A certain whale address purchased 5,039 ETH, bringing their total holdings to 138,200 ETH.
Gate News message, March 30, according to Onchain Lens monitoring, a whale address purchased 5,039 ETH for about $10 million. This address currently holds a total of 138,234 ETH, valued at approximately $274 million, and there is also a loan position of about $142.3 million.
GateNews49m ago
ETH breaks through 2000 USDT
Gate News bot message, Gate market shows that ETH has broken through 2000 USDT, current price is 2003.49 USDT.
CryptoRadar53m ago
Ethereum Flippening Odds Rise as Bitcoin Stays Out
Ethereum’s effort to reclaim the market’s No. 2 spot is facing a different obstacle this year: a booming stablecoin economy. While Bitcoin remains the dominant benchmark, the faster-growing sector of dollar-denominated crypto assets is reshaping how capital flows through the space, with USDT
CryptoBreaking1h ago
Ethereum Teams Propose ‘Economic Zone’ to Unify Layer-2 Ecosystems
A new collaborative framework proposed by developers from Gnosis and Zisk, with support from the Ethereum Foundation, aims to knit Ethereum’s sprawling layer-2 ecosystem into a more cohesive execution fabric. The initiative, dubbed the Ethereum Economic Zone (EEZ), envisions cross-rollup
CryptoBreaking1h ago
