Stellar price (XLM) is approaching the key resistance area around 0.256 USD at the time of writing on Tuesday, after surging more than 10% in just the past two days. At the same time, the Total Value Locked (TVL) on the network has also set a new all-time high, indicating the ecosystem is expanding strongly and further reinforcing confidence in the uptrend. Technically, if XLM can close above the 0.256 USD level, the next upward momentum is likely to be triggered.
Stellar’s TVL hits new highs
Data from DefiLlama shows that XLM’s TVL has reached an all-time high of 169.30 million USD on Tuesday. This development reflects robust expansion in the Stellar ecosystem, as more users are depositing assets or interacting with protocols built on the network. The rising TVL also provides further support for the recent price rally of XLM.
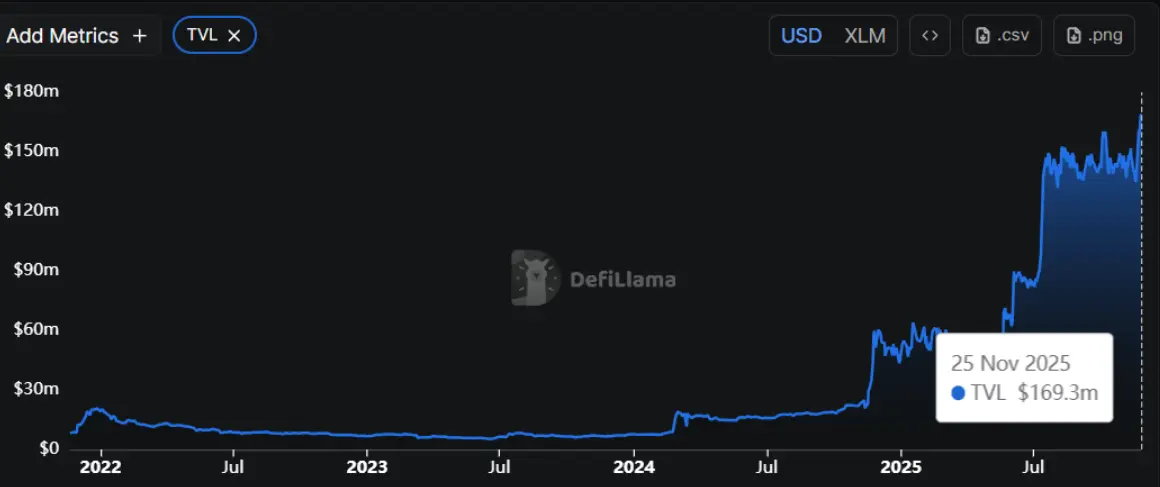 BiXLM TVL chart | Source: DefiLlama
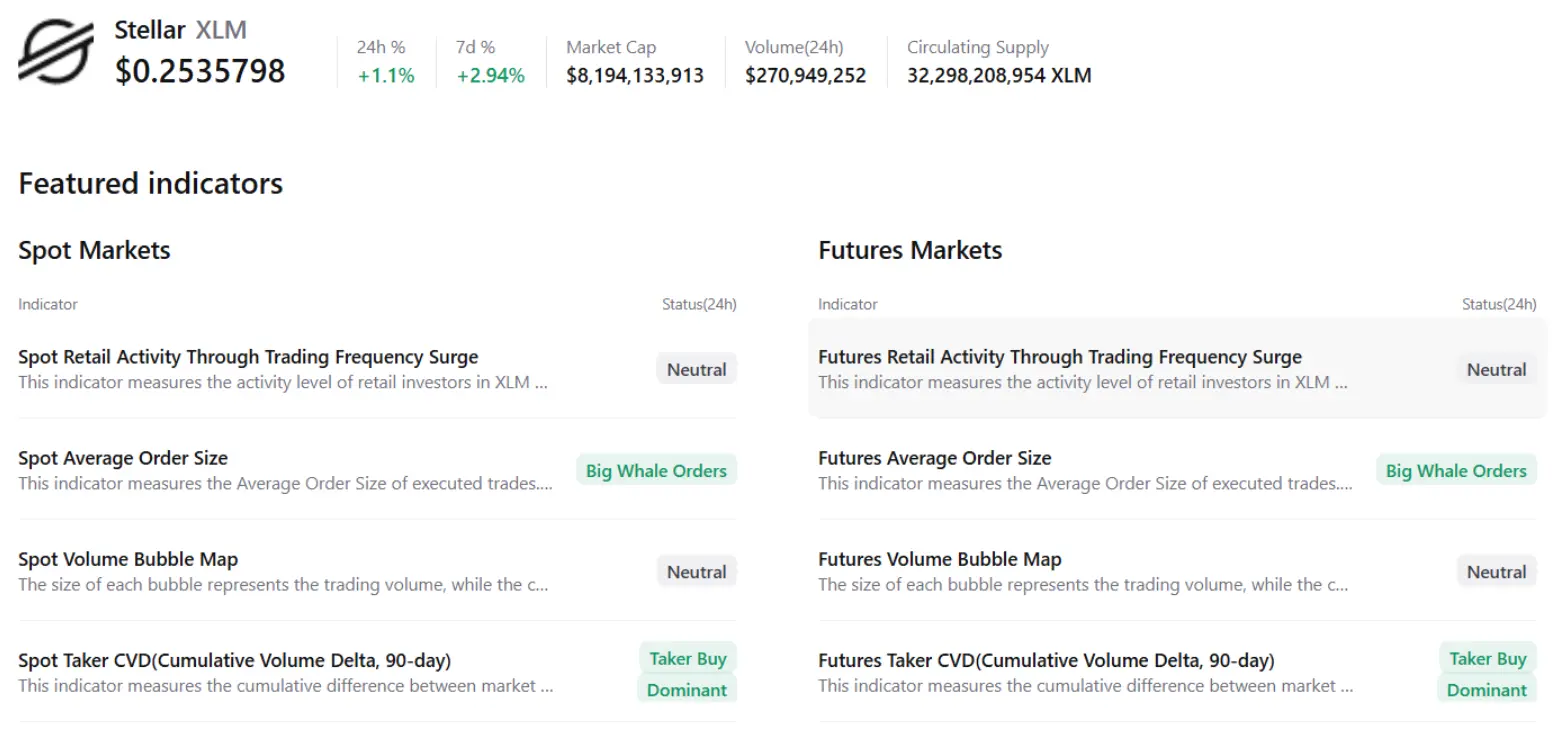
At the same time, aggregated data from CryptoQuant continues to reinforce the optimistic outlook. Both spot and derivatives markets for XLM have seen substantial inflows from “whales,” indicating significant buying pressure—a signal that often precedes the formation of a new upward move.
BiXLM TVL chart | Source: DefiLlama
At the same time, aggregated data from CryptoQuant continues to reinforce the optimistic outlook. Both spot and derivatives markets for XLM have seen substantial inflows from “whales,” indicating significant buying pressure—a signal that often precedes the formation of a new upward move.
Stellar price forecast: XLM bulls eye a breakout
Stellar price touched and reacted well at the weekly support area of 0.221 USD on Friday, before bouncing more than 10% over the next three days. As of Tuesday afternoon, XLM is approaching the 38.20% Fibonacci retracement level at 0.256 USD (measured from the October 6 high at 0.413 USD to the October 10 low at 0.160 USD). This is also the upper edge of the descending wedge pattern, creating a key resistance zone that investors need to watch closely.
If XLM can break out and close above the 0.256 USD area on the daily timeframe, the rally is likely to extend to the 50-day EMA around 0.292 USD.
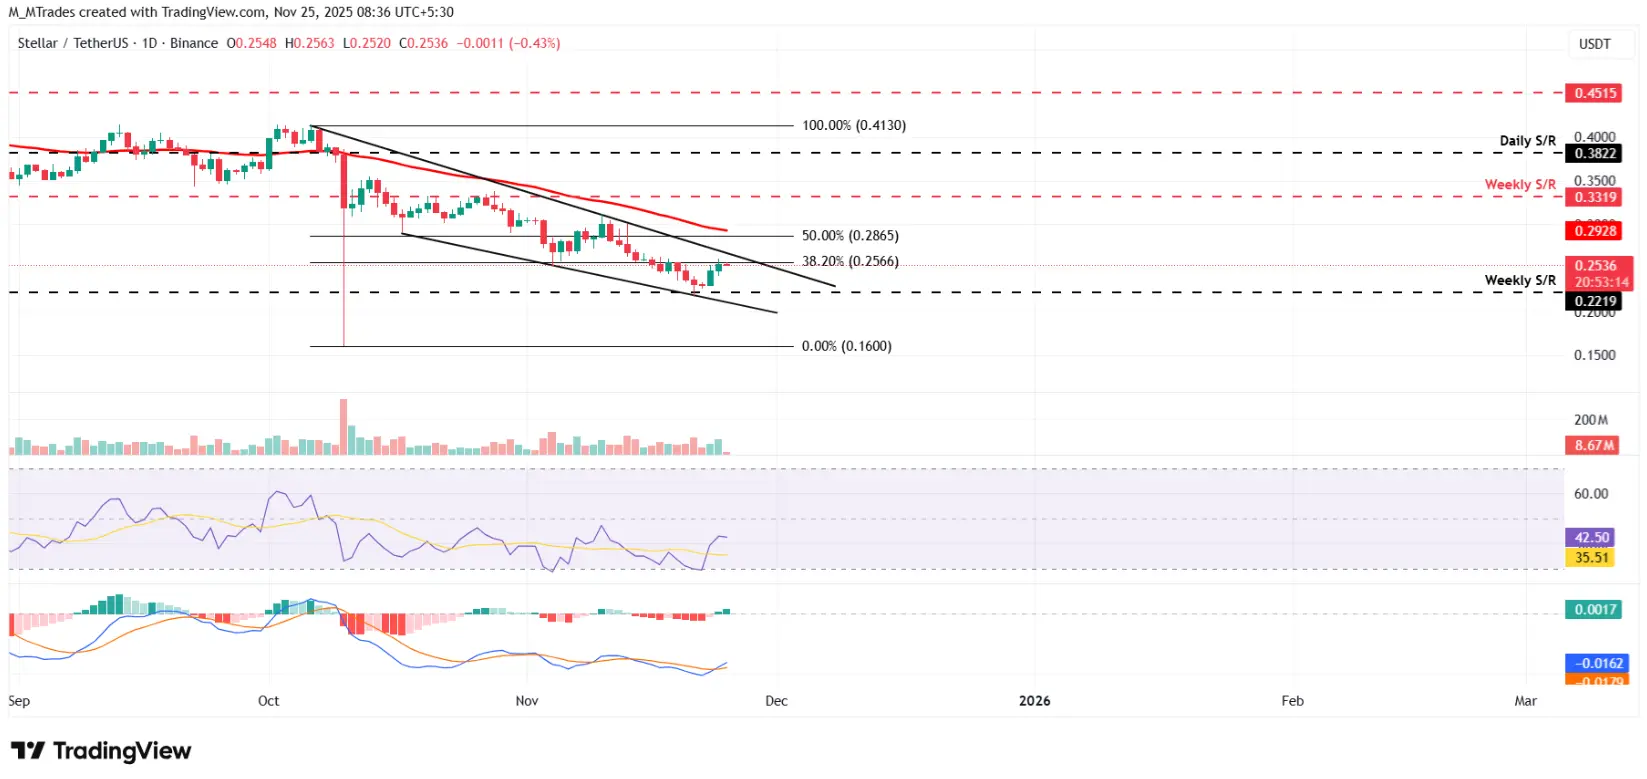 BiDaily XLM/USDT chart | Source: TradingView
On the daily chart, the RSI is currently at 42 and heading toward the neutral 50 zone, indicating that selling pressure is weakening. A move by the RSI above this level would be an important signal to reinforce the recovery momentum. At the same time, the MACD just recorded a bullish crossover on Monday, signaling a buy and continuing to support the bullish scenario.
BiDaily XLM/USDT chart | Source: TradingView
On the daily chart, the RSI is currently at 42 and heading toward the neutral 50 zone, indicating that selling pressure is weakening. A move by the RSI above this level would be an important signal to reinforce the recovery momentum. At the same time, the MACD just recorded a bullish crossover on Monday, signaling a buy and continuing to support the bullish scenario.
On the downside, if selling pressure returns, XLM may retrace to retest the weekly support area at 0.221 USD.
SN_Nour
Disclaimer: The information on this page may come from third parties and does not represent the views or opinions of Gate. The content displayed on this page is for reference only and does not constitute any financial, investment, or legal advice. Gate does not guarantee the accuracy or completeness of the information and shall not be liable for any losses arising from the use of this information. Virtual asset investments carry high risks and are subject to significant price volatility. You may lose all of your invested principal. Please fully understand the relevant risks and make prudent decisions based on your own financial situation and risk tolerance. For details, please refer to
Disclaimer.
