On the social network X, many influencers like to use M2 growth charts or a weakening USD to predict that Bitcoin is “about to explode.” These comparisons attract engagement but flatten the real relationship, which is actually complex and changes over time. They matter, but they do not operate in the simple, linear way that many people imagine.
M2 Liquidity and Its Delayed Impact on Bitcoin
Money printing, which increases global M2 money supply, is often believed to drive Bitcoin’s price with a lag of about 12 weeks (approximately 84 days). The reason is that when new liquidity is injected into circulation, it takes time to make its way into the Bitcoin market.
Analysis shows that an 84-day lag is more accurate than the commonly cited 12 weeks, so all charts and models are based on this timeframe. Liquidity creates a “pulling force”—much like gravity—leading to multi-month rallies when markets are stable.
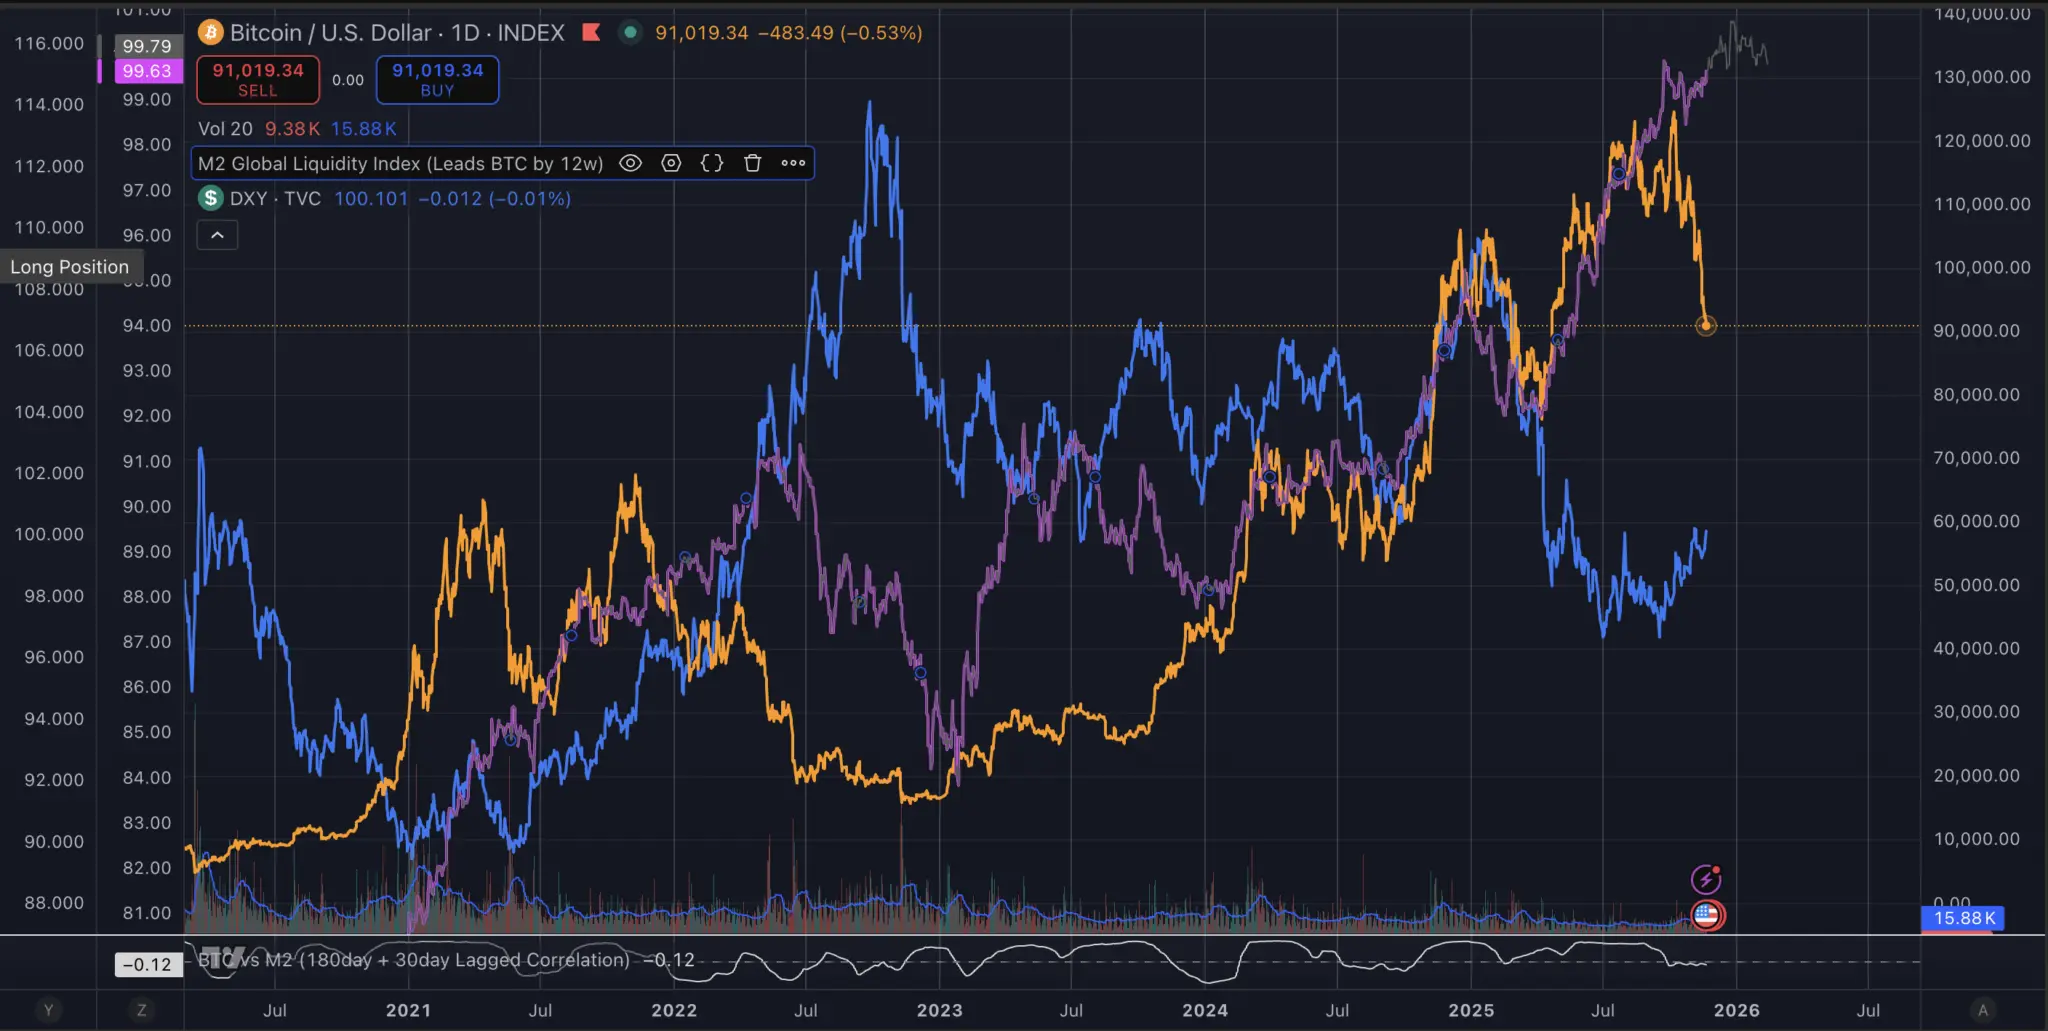 Bitcoin, M2 money supply (84-day lag) and the US dollar since 2020### Two Main Clocks: Liquidity and the USD
Bitcoin actually “follows” two cycles:
- Liquidity (M2): slow impact, shapes long-term uptrends.
- US Dollar (DXY): fast impact, controls short-term pullbacks or corrections.
However, these two factors rarely peak at the same time. Daily price data from the last 12 months shows:
- Liquidity moves in tandem with Bitcoin price during slow-moving cycles.
- The USD has an inverse, faster impact, especially when the dollar strengthens sharply.
- The relationship between Bitcoin, M2, and DXY changes with market cycles and is not fixed.
Broadly, the long-term relationship is defined as follows:
- Correlation BTC vs M2 (84-day lag): 0.78
- Correlation BTC vs M2 (84-day lead): 0.77
- Correlation BTC vs DXY: −0.58
- Correlation M2 vs DXY: −0.71
These numbers describe the long-term context and do not reflect daily fluctuations. Based on daily log returns data, same-day correlation is nearly zero, indicating that “USD up, Bitcoin down” is a lagging phenomenon and does not happen instantly.
 Bitcoin, M2 money supply (84-day lag) and the US dollar since 2020### Lags and Market Rhythms
A test of daily returns lag shows:
- Bitcoin reacts to liquidity with about a 42-day lead at a correlation of 0.16.
- Bitcoin reacts inversely to DXY with about a 33-day lead at a correlation of −0.20.
This means:
- Liquidity is a slow pull, driving stable rallies lasting several months.
- The USD acts like a quick throttle, creating short-term pressure, either “cooling off” rallies or intensifying pullbacks.
- When M2 and DXY are aligned, Bitcoin’s path is smoother. When they conflict, correlations fall apart, and previously effective lags no longer hold.
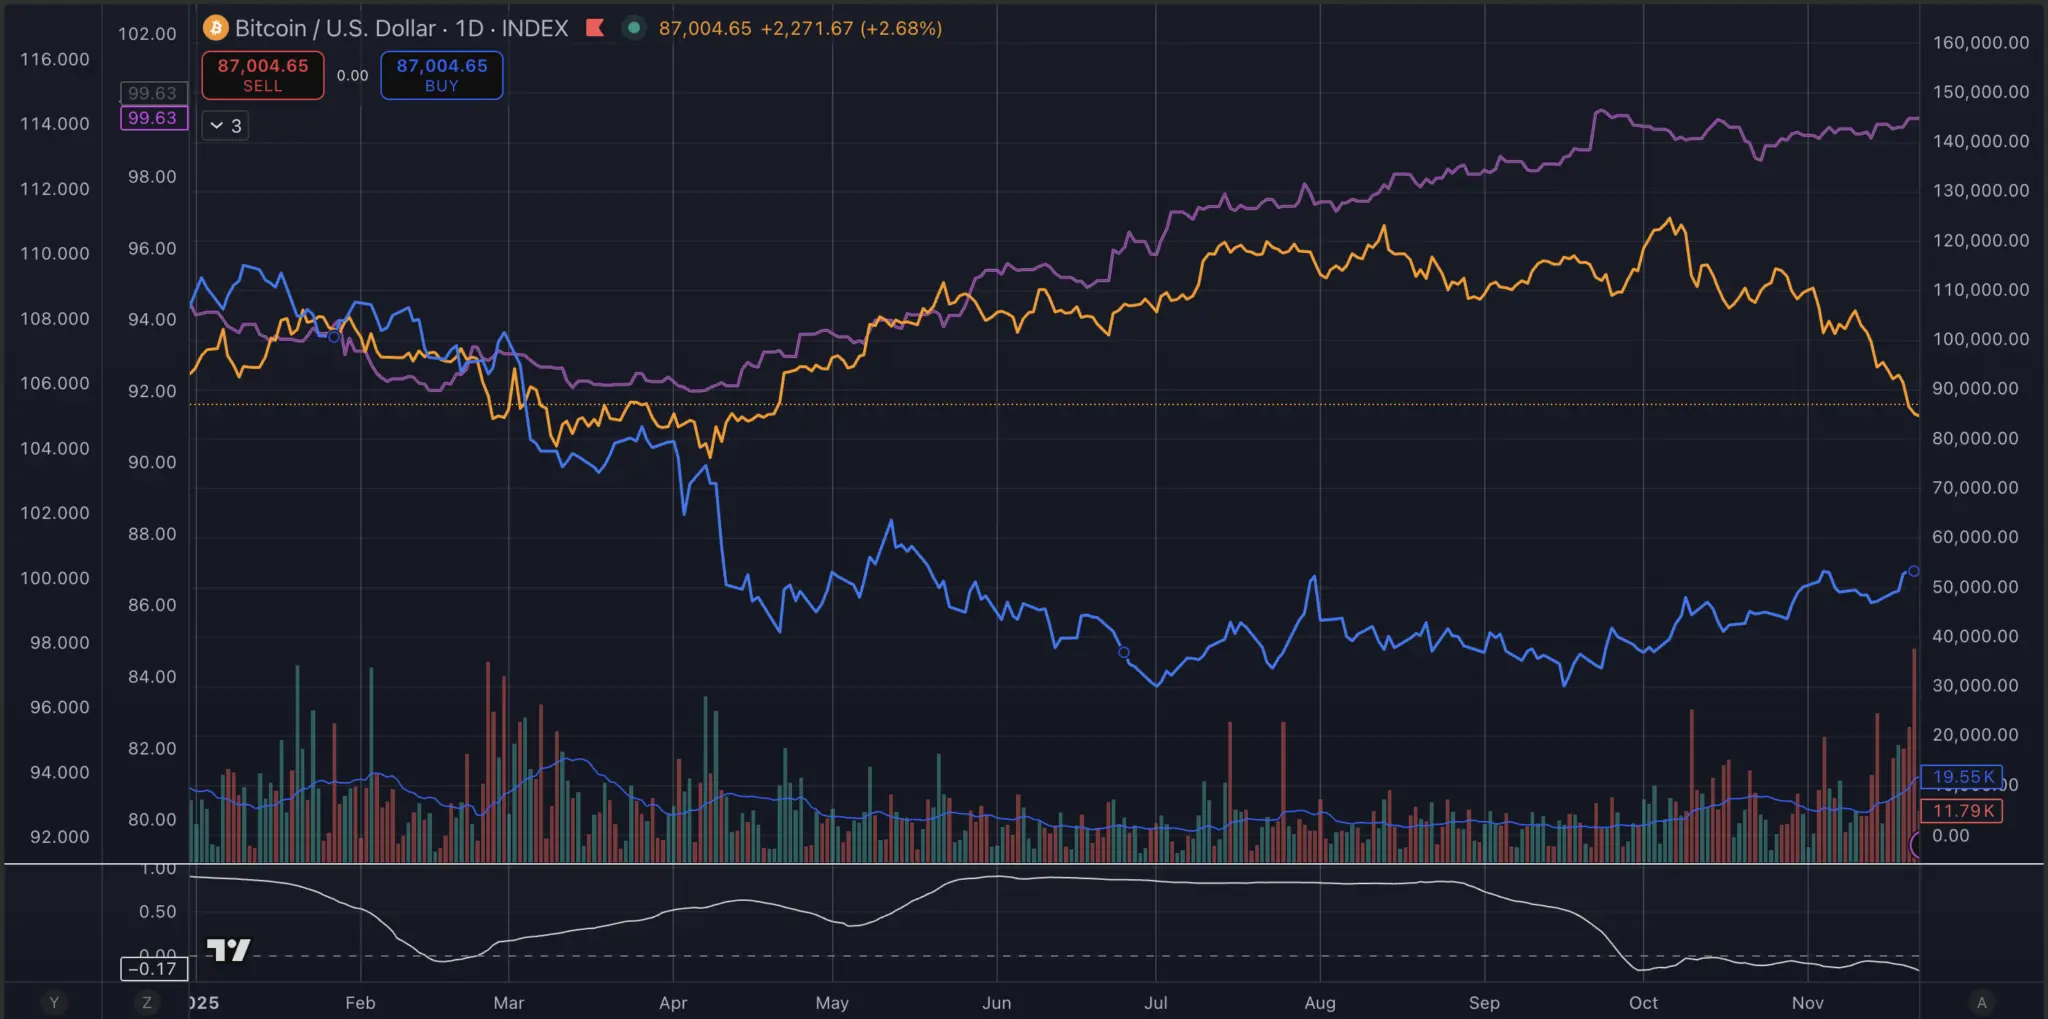
The Relationship by Market Cycle
Breaking down by the 2025 cycle:
-
Before the peak 10/6/2025:
- BTC vs M2 (84d lag): 0.89
- BTC vs M2 (84d lead): 0.87
- BTC vs DXY: −0.58
→ In the uptrend phase, M2 leads well, and price moves in sync with M2.
-
After the peak 10/6/2025 (to 11/20/2025):
- Liquidity reverses: correlation BTC vs M2 ≈ −0.49
- DXY still exerts opposing pressure: BTC vs DXY ≈ −0.60
→ In the downtrend, M2 continues to rise but Bitcoin price falls, so M2 “no longer leads” as before.
The 180-day rolling correlation chart between BTC and M2 (84d lag) illustrates clearly:
- Peak at 0.94 (12/26/2024) → strong rally phase, M2 leads.
- Low point −0.16 (9/30/2025) → late cycle, strong USD weakens the relationship.
- Latest value −0.12 (11/20/2025).
Thus, the relationship is not a single variable that “explains” Bitcoin, but a conditional framework that changes over time.
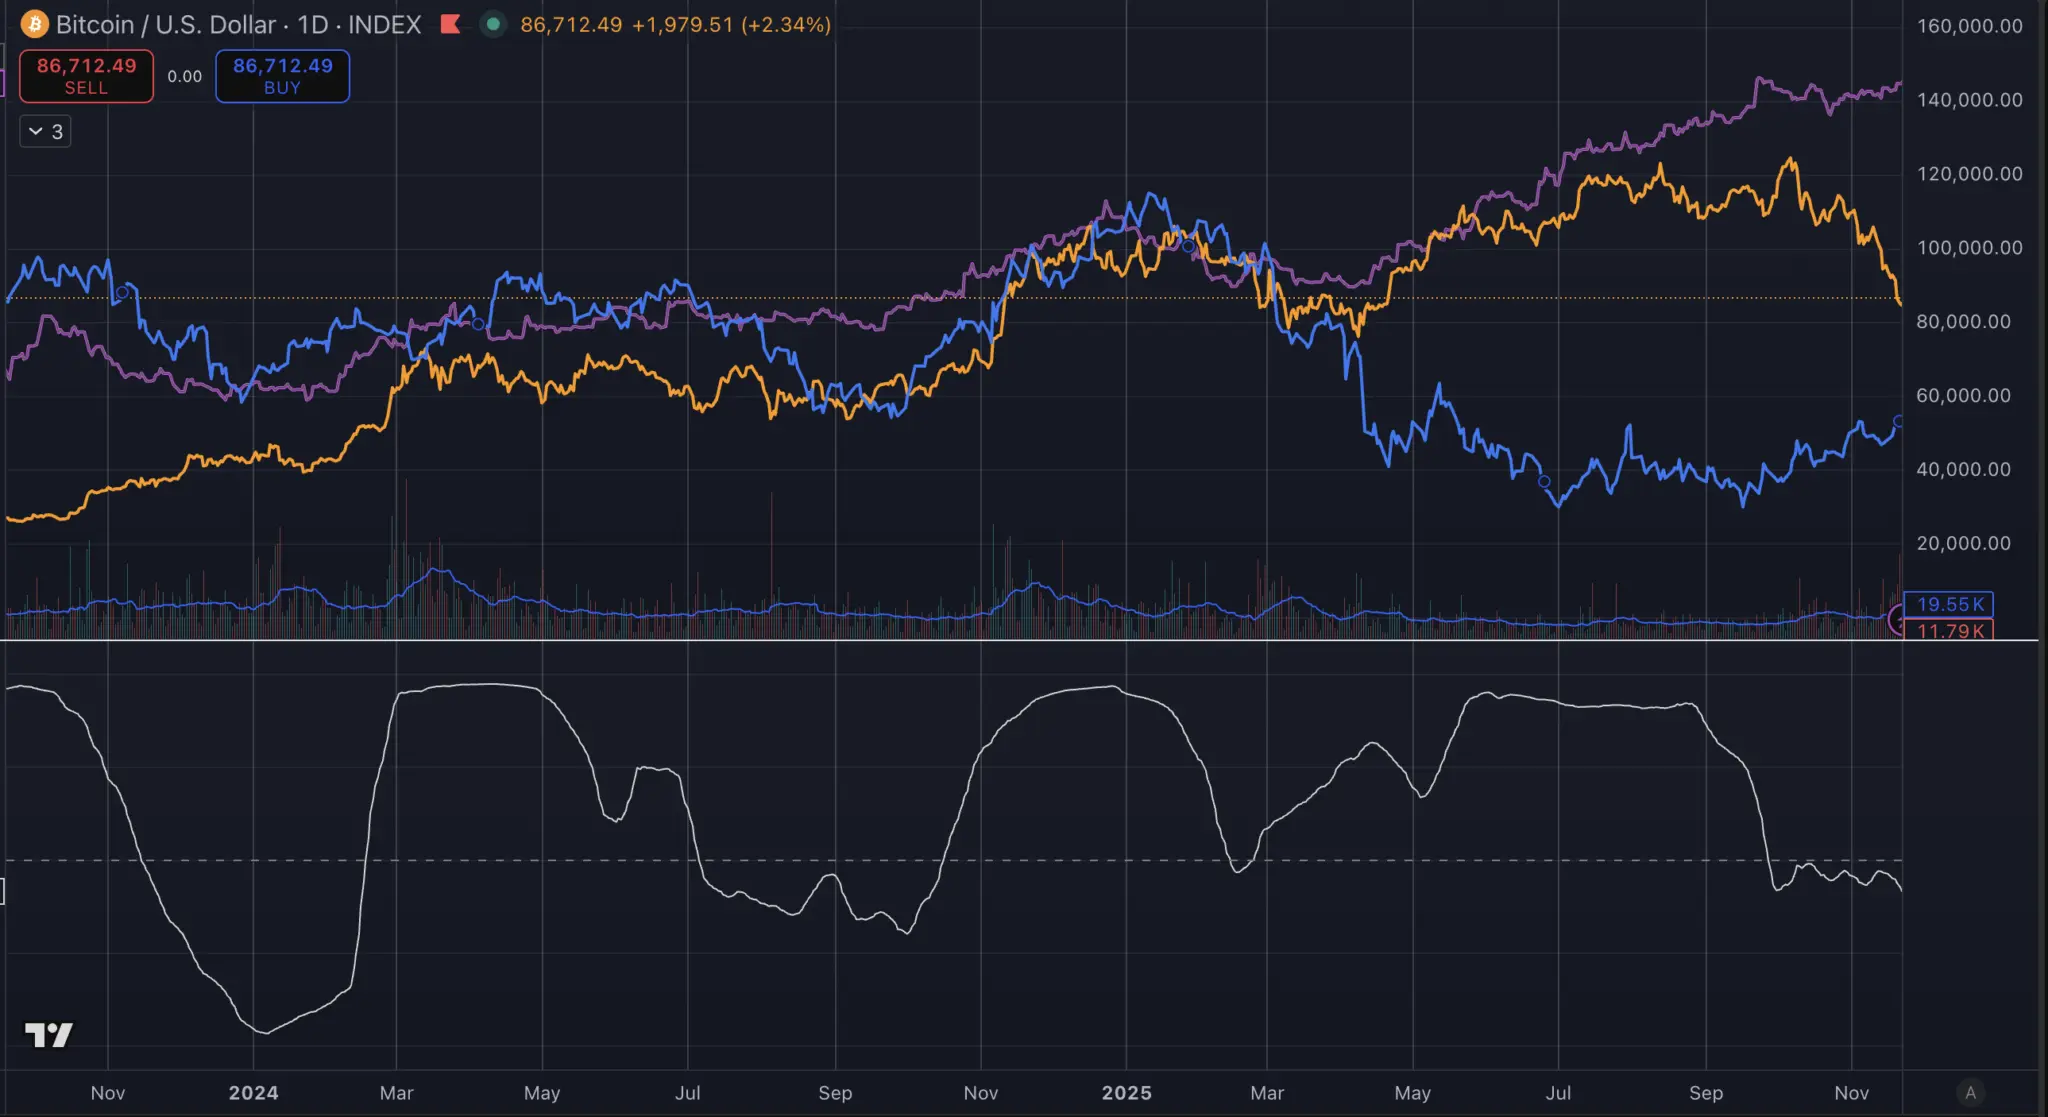 Torrelation between Bitcoin and M2 (84-day lag) over more than 180 days### Practical Analytical Framework
A simple but effective approach:
- Track the slope of M2 and DXY over 1–3 month windows using log returns, not levels. Only rely on M2 when both are aligned.
- Allow flexible lag, not fixed, as the optimal lag changes with each cycle.
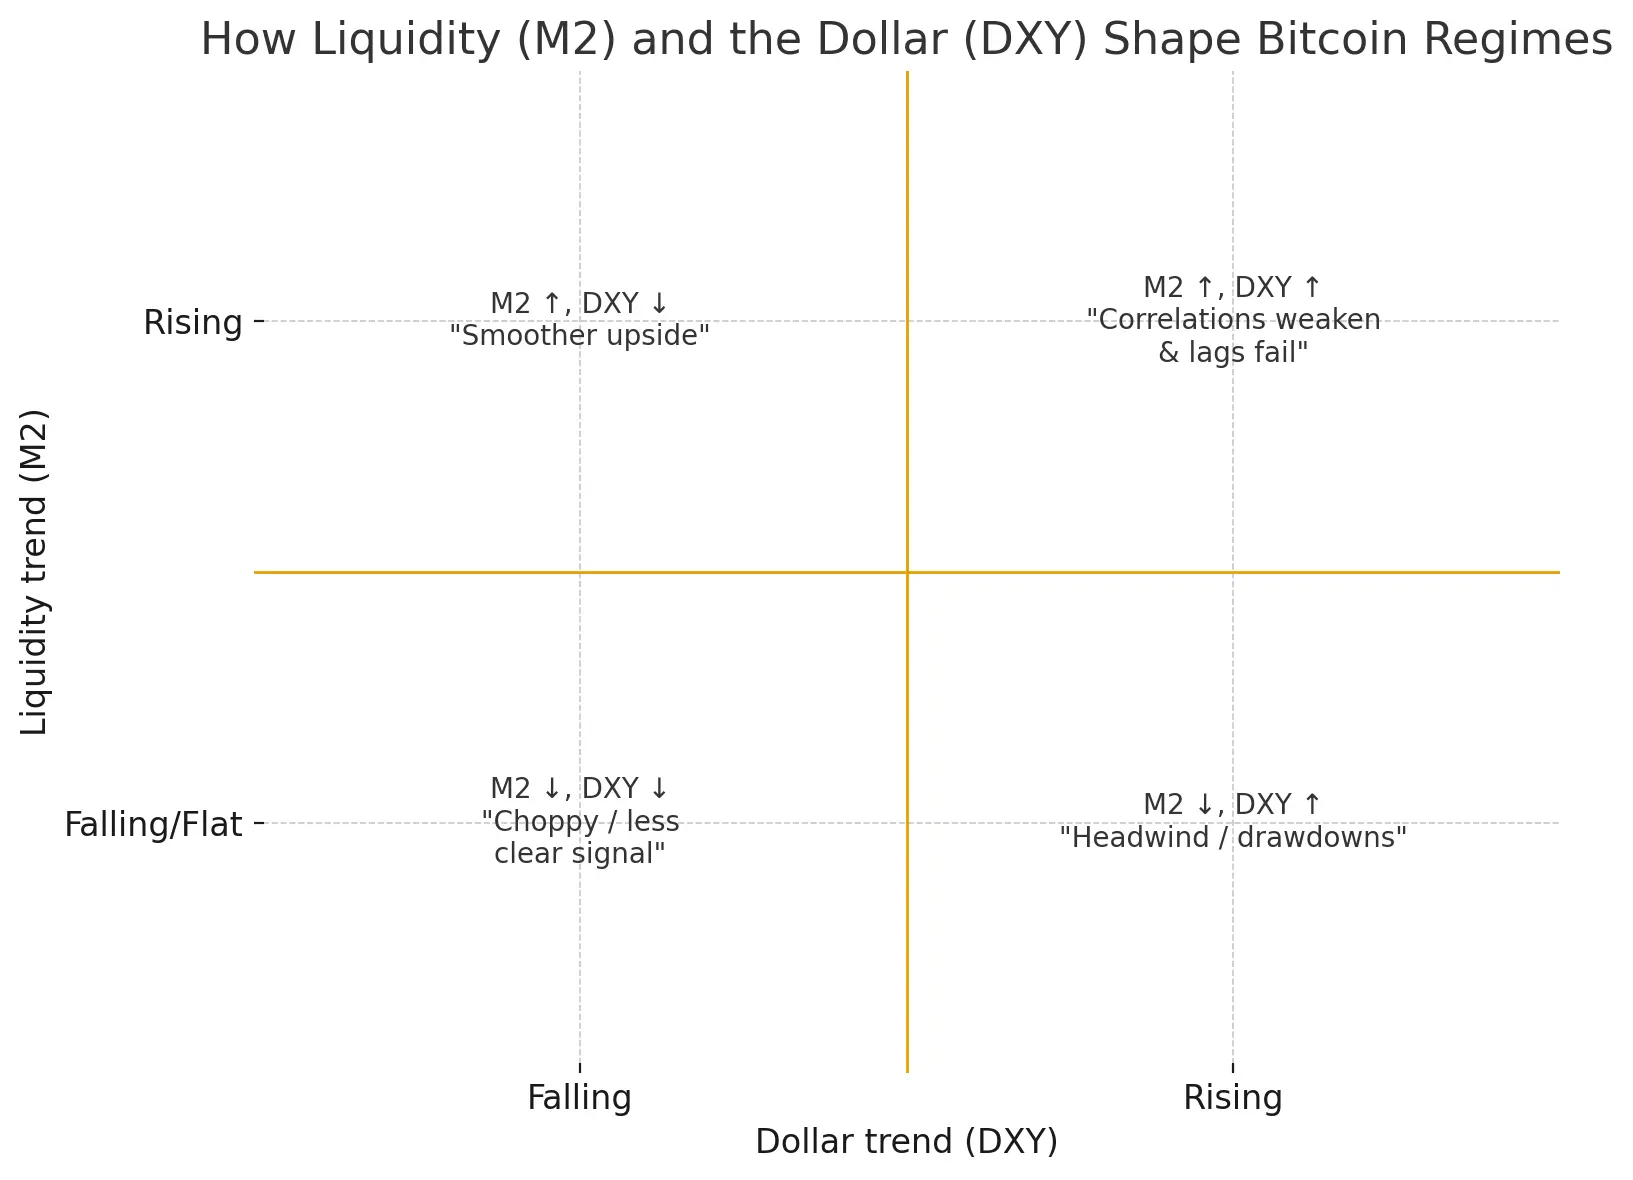
General Principles:
- M2 liquidity dominates multi-month uptrends when the USD is stable or weakening.
- The USD dominates short-term swings when it is in a strong uptrend.
- When both are aligned, uptrends are smooth; when they conflict, correlation drops and forecasting becomes harder.
Key Data Summary Table
| Metric |
Series |
Period |
Value |
Notes |
| Level corr |
BTC vs M2 (84d lag) |
Full sample |
0.78 |
203 days |
| Level corr |
BTC vs M2 (84d lead) |
Forward sample |
0.77 |
203 days |
| Level corr |
BTC vs DXY |
Full sample |
−0.58 |
203 days |
| Return corr |
BTC vs M2 (same day) |
Full sample |
0.02 |
162 days |
| Return corr |
BTC vs DXY (same day) |
Full sample |
0.04 |
162 days |
| Best lag corr |
M2 leads BTC |
Lag 42 days |
0.16 |
n = 120 |
| Best lag corr |
DXY leads BTC |
Lag 33 days |
−0.20 |
n = 129 |
| Pre-peak level corr |
BTC vs M2 (84d lag) |
Before 10/6 |
0.89 |
Uptrend |
| Post-peak level corr |
BTC vs M2 (84d lag) |
After 10/6 |
−0.49 |
Downtrend |
| Rolling corr panel |
BTC vs M2 (84d lag) |
Max |
0.94 |
12/26/2024 |
| Rolling corr panel |
BTC vs M2 (84d lag) |
Min |
−0.16 |
9/30/2025 |
| Rolling corr panel |
BTC vs M2 (84d lag) |
Latest |
−0.12 |
11/20/2025 |
Conclusion:
The Bitcoin – M2 – USD relationship is not simple; it’s not “M2 up → Bitcoin up” or “USD up → Bitcoin down” on a daily basis. It’s a combination of the slow rhythm of liquidity and the fast rhythm of the USD, changing with market cycles. This analytical framework helps investors identify long-term trends and short-term swings, rather than just looking at charts on social media.
Vuong Tien
Disclaimer: The information on this page may come from third parties and does not represent the views or opinions of Gate. The content displayed on this page is for reference only and does not constitute any financial, investment, or legal advice. Gate does not guarantee the accuracy or completeness of the information and shall not be liable for any losses arising from the use of this information. Virtual asset investments carry high risks and are subject to significant price volatility. You may lose all of your invested principal. Please fully understand the relevant risks and make prudent decisions based on your own financial situation and risk tolerance. For details, please refer to
Disclaimer.
Related Articles
Hashrate Index: Brazil and Venezuela Show Potential to Grow Latam's Bitcoin Mining Share
A new report on the state of bitcoin mining in Latam found that the region is lagging in bitcoin mining adoption, even as it holds vast energy resources. While Paraguay holds the fourth place in global hashrate, Hashrate Index picked Brazil and Venezuela as the nations to follow.
Key Takeaways:
A
Coinpedia22m ago
Michael Saylor: Bitcoin’s winter is over; institutional and sovereign adoption could fuel the next uptrend
Gate News message, April 25 — Michael Saylor, co-founder of MicroStrategy, said "winter's over" as Bitcoin climbed to approximately $78,000, signaling a shift in market sentiment.
According to analyst Mati Greenspan, recent market moves since the flash crash have been corrections within a broader bull market, with Bitcoin's bottom now in place. Greenspan believes the next leg of gains will be driven by "sovereign adoption," including central banks adding BTC alongside gold to their reserves.
Governments and institutions are increasingly incorporating Bitcoin into their holdings. The U.S. government currently holds approximately 300,000 BTC and has discussed establishing a strategic Bitcoin reserve. El Salvador continues making daily purchases, while the U.K. government and several U.S. state pension funds have added Bitcoin to their asset allocations.
GateNews1h ago
Bitcoin Faces $1.315B in Short Liquidations Above $81,596; $1.168B in Long Liquidations Below $74,236
Gate News message, April 25 — According to Coinglass data, if Bitcoin breaks above $81,596, short positions across major CEXs would face cumulative liquidations of $1.315 billion. Conversely, if BTC falls below $74,236, long positions would encounter cumulative liquidations of $1.168
GateNews1h ago
Bitcoin Perpetual Futures and ETFs Function Like Traditional Commodity Rental Model, Says Peng Fu
Gate News message, April 25 — Peng Fu, newly appointed chief economist at XinHuo Group, outlined his analysis of Bitcoin's underlying business logic in a series of posts on X today. According to Fu, the commercial models of Bitcoin perpetual futures and ETFs are fundamentally identical to the
GateNews1h ago
Whale Opens 16x Leveraged BTC Short on Hyperliquid, Position Worth $50.6M; Profits $720K from ETH Arbitrage
Gate News message, April 25 — A whale address beginning with 0x310 opened a 16x leveraged short position on 653 BTC on Hyperliquid in the past 30 minutes, valued at approximately $50.6 million at an average price of $77,470. The position has a liquidation price of $81,308 and currently ranks as the
GateNews1h ago