The volatility indicator for Bitcoin (BTC) is releasing rare signals. Several well-known traders have pointed out that the BTC monthly Bollinger Bands have reached the “maximum squeeze” state since 2009, and similar historical situations often lead to dramatic market movements. Technical patterns and capital flow data suggest that Bitcoin may be brewing a super pump towards $300,000.
Bollinger Bands 'Extreme Contraction' Indicates Major Market Movement
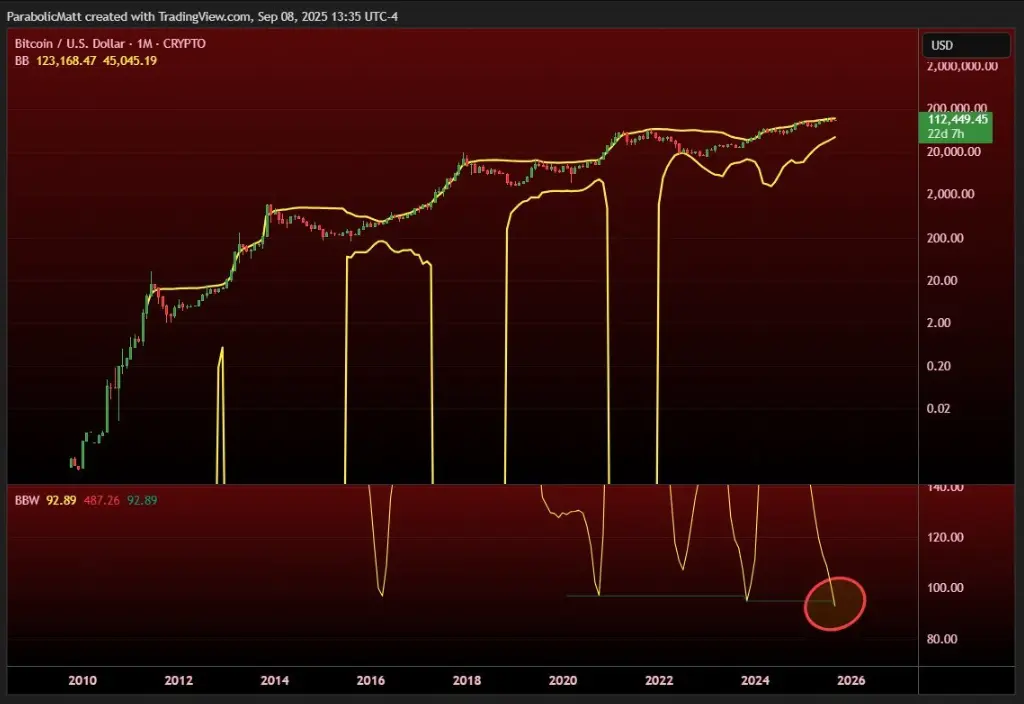
(Source: Trading View)
Crypto analyst Matthew Hyland pointed out that the Bitcoin monthly Bollinger Bands indicator has reached the tightest compression level in history, indicating that price fluctuations are about to intensify. Another analyst, Crypto Ceasar, also believes that this pattern has historically triggered strong pumps multiple times and predicts that BTC may welcome a hot fourth quarter market.
Crypto investor Giannis Andreou added that the pullbacks after the bull markets in 2012, 2016, and 2020 all occurred under similar technical backgrounds, and the current level of contraction is even more extreme, which could trigger price fluctuations more intense than before.
Cup Handle Pattern Locking 300,000 USD Target
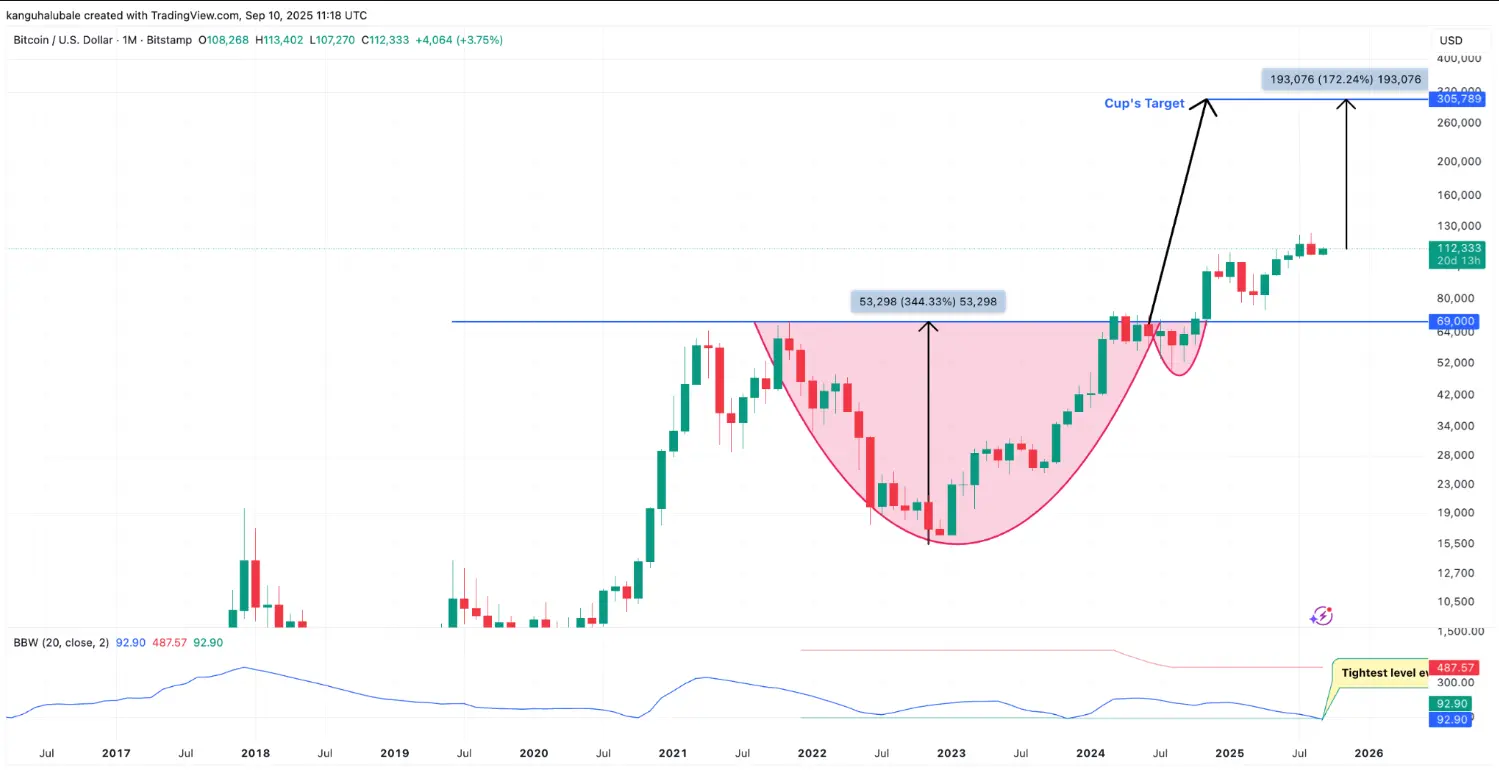
Technical analysis shows that Bitcoin broke through the classic “cup and handle” neckline of $69,000 in November 2024 and is currently still in the breakout confirmation stage. According to measurement targets, the potential pump of this pattern could push BTC up to $305,000, an increase of over 170% from the current price.
However, research by senior technical analyst Thomas Bulkowski indicates that the target achievement rate of the cup and handle pattern is about 61%, meaning that although the potential for a pump is huge, it is not a hundred percent guarantee.
Resonance of Capital and Macroeconomic Environment
(Source: Trading View)
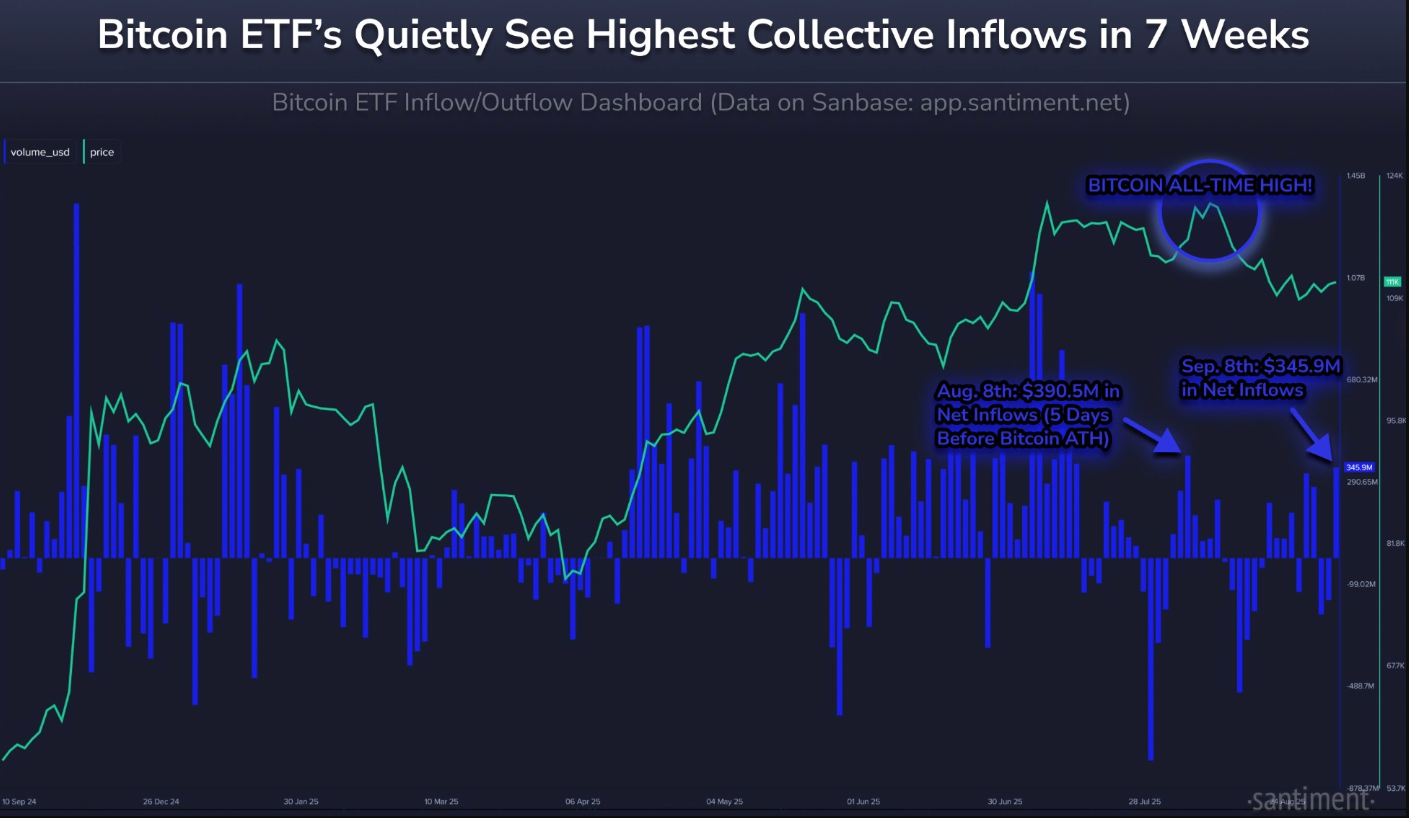
In addition to the technical aspects, the flow of funds also supports the bullish outlook for Bitcoin. Market data company Santiment pointed out that the recent inflow of Bitcoin spot ETFs has turned positive, indicating that institutional funds are returning. Historically, crypto bull markets are often accompanied by similar waves of capital inflow.
At the same time, the market expects the Federal Reserve to lower interest rates, combined with the continuous bullish signals from on-chain data, providing additional momentum for BTC. Some analysts even believe that Bitcoin may replicate the long-term upward trajectory of gold, first challenging $185,000, and then moving towards higher targets.
Short-term Risks and Potential Pullbacks
(Source: Trading View)
Despite the long-term bullish trend, analysts remind that BTC may still undergo a healthy pullback during the bull market cycle after reaching new highs, with a short-term potential retest of the $104,000 support level before launching a new round of attack. For medium to long-term investors, such pullbacks may present an opportunity to increase positions, but short-term traders need to be cautious of fluctuation risks.
Conclusion
The “extreme contraction” of the Bollinger Bands on the Bitcoin monthly chart and the breakout from the cup and handle pattern depict a potential surge for the market. If technical and capital signals ferment simultaneously, it is not a fantasy for BTC to hit 300,000 USD in 2025-2026. However, historical experience reminds us that any bullish pattern is accompanied by uncertainty, and investors should strike a balance between optimism and risk management.
Disclaimer: The information on this page may come from third parties and does not represent the views or opinions of Gate. The content displayed on this page is for reference only and does not constitute any financial, investment, or legal advice. Gate does not guarantee the accuracy or completeness of the information and shall not be liable for any losses arising from the use of this information. Virtual asset investments carry high risks and are subject to significant price volatility. You may lose all of your invested principal. Please fully understand the relevant risks and make prudent decisions based on your own financial situation and risk tolerance. For details, please refer to
Disclaimer.
Related Articles
Morgan Stanley Bitcoin ETF Drives 3-Fold Impact as 16,000 Advisors Open Path to Multi-Billion Demand
Bitcoin demand is set to expand rapidly as Morgan Stanley deploys its 16,000 advisors and launches a low-cost ETF, driving institutional inflows and strengthening crypto’s position in mainstream portfolios.
Key Takeaways:
Morgan Stanley’s 16,000 advisors unlock major bitcoin demand, driving
Coinpedia2h ago
DWF Labs Co-Founder: The current market is boring, but it hasn’t disappeared—builders or investors still have a lot to do.
DWF Labs co-founder Andrei Grachev said the market is currently in a “boring” phase, with many important activities quietly underway. He advised investors to stay patient and look for a better timing. He emphasized that opportunities still exist in the market—such as holding Bitcoin or participating in altcoins—and urged retail investors to keep learning and remain optimistic.
GateNews2h ago
Researchers propose a transaction scheme for quantum-resistant Bitcoin without needing a fork
Gate News message, on April 12, a researcher proposed a transaction scheme that enables quantum-resilient protection for Bitcoin without requiring a fork. At present, the quantum computing threat to Bitcoin is still at the theoretical level. Meanwhile, tech companies such as Google and Cloudflare have already begun preparing countermeasures and set a target timeline to complete the migration of quantum cryptography after 2029.
GateNews3h ago
Contract whale “sets 10 big targets first” — the short position is up $3.21 million; the BTC short opening price is $71,554.61.
Gate News message, April 12, according to on-chain analyst Ai Yi (@ai_9684xtpa) statistics, the short positions of the contract whale “first set 10 big targets” (@Jason60704294) are currently up $3.21 million. Of this, the BTC short positions are 2,567.49 BTC, with an opening price of $71,554.61, and an unrealized profit of $1.19M; the ETH short positions are 38,465.22 ETH, with an opening price of $2,248.74, and an unrealized profit of $2.03M.
GateNews3h ago
$789 Million Fresh Capital: Bitcoin ETFs See Highest Weekly Inflow Since February - U.Today
Bitcoin ETFs saw a significant resurgence with $789 million in weekly inflows, the highest since February. BlackRock led the charge, contributing 80% of this total, signaling renewed institutional interest in the market after a period of withdrawals.
UToday3h ago
