Solana (SOL) on-chain activity shows signs of cooling — the number of new addresses has dropped to the lowest level since April, yet the price has surpassed $219, reaching a seven-month high. Analysts warn that the RSI is approaching a sensitive area in the short term, and the market may be due for a technical pullback.
on-chain data shows that new funding momentum is weakening
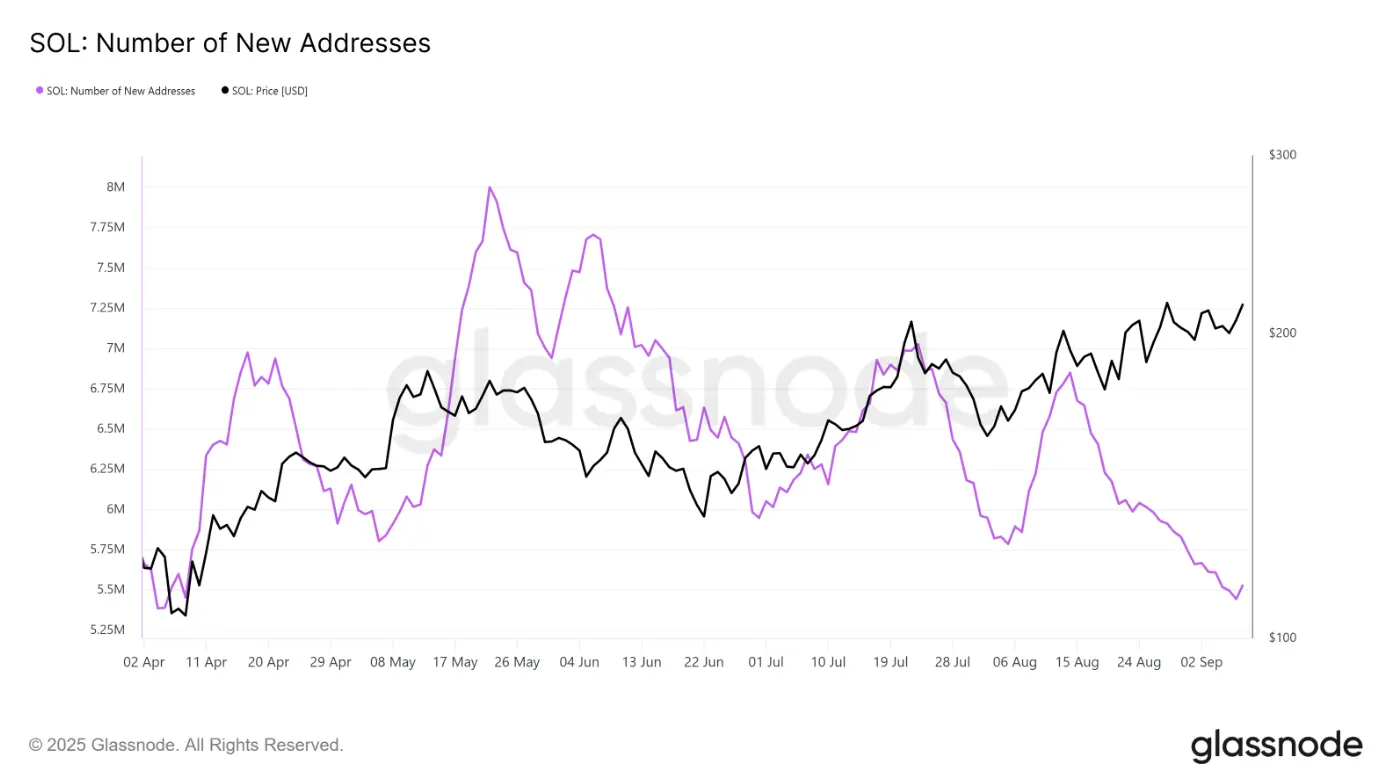
(Source: Glassnode)
According to Glassnode data, the number of new Solana addresses has fallen to a five-month low, indicating a decline in the willingness of new investors to enter the market.
In the cryptocurrency market, a decrease in the number of new addresses usually indicates a slowdown in growth momentum, especially after experiencing consecutive gains, as market participants tend to adopt a wait-and-see approach rather than chasing higher prices.
Technical Analysis: RSI Near Historical Reversal Zone
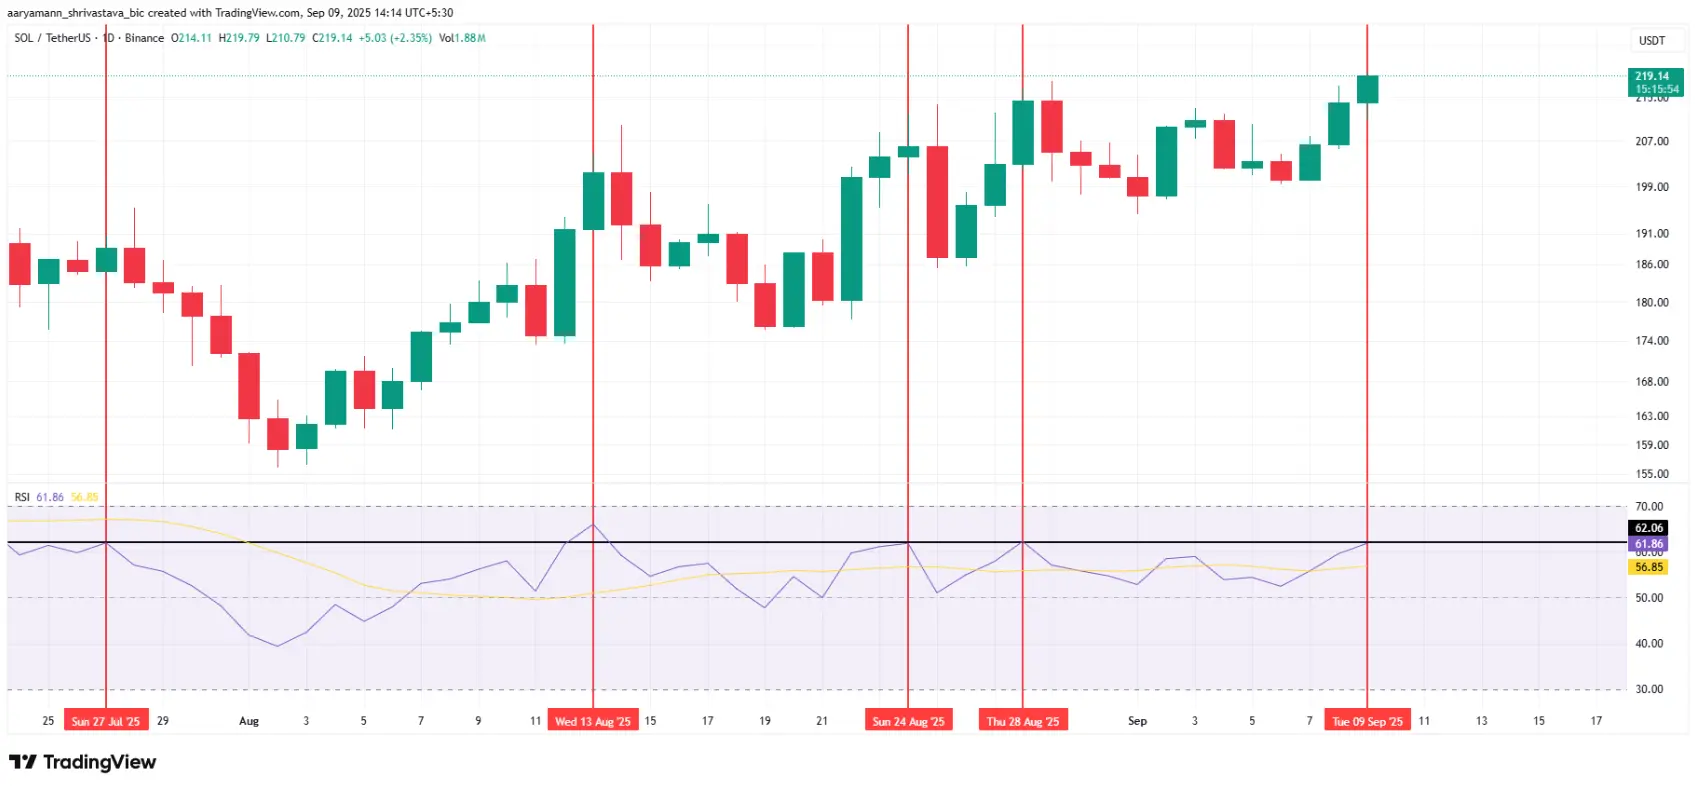 (Source: Trading View)
The daily chart shows that the relative strength index (RSI) of SOL is currently 61, close to the historical critical value of 62 that triggers a pullback.
Although traditionally an RSI above 70 is considered overbought, for Solana, multiple reversals in the past have occurred around RSI 62, indicating that the short-term upward trend may be approaching saturation.
Key Price Levels: Support at 214 USD, Resistance at 221 USD
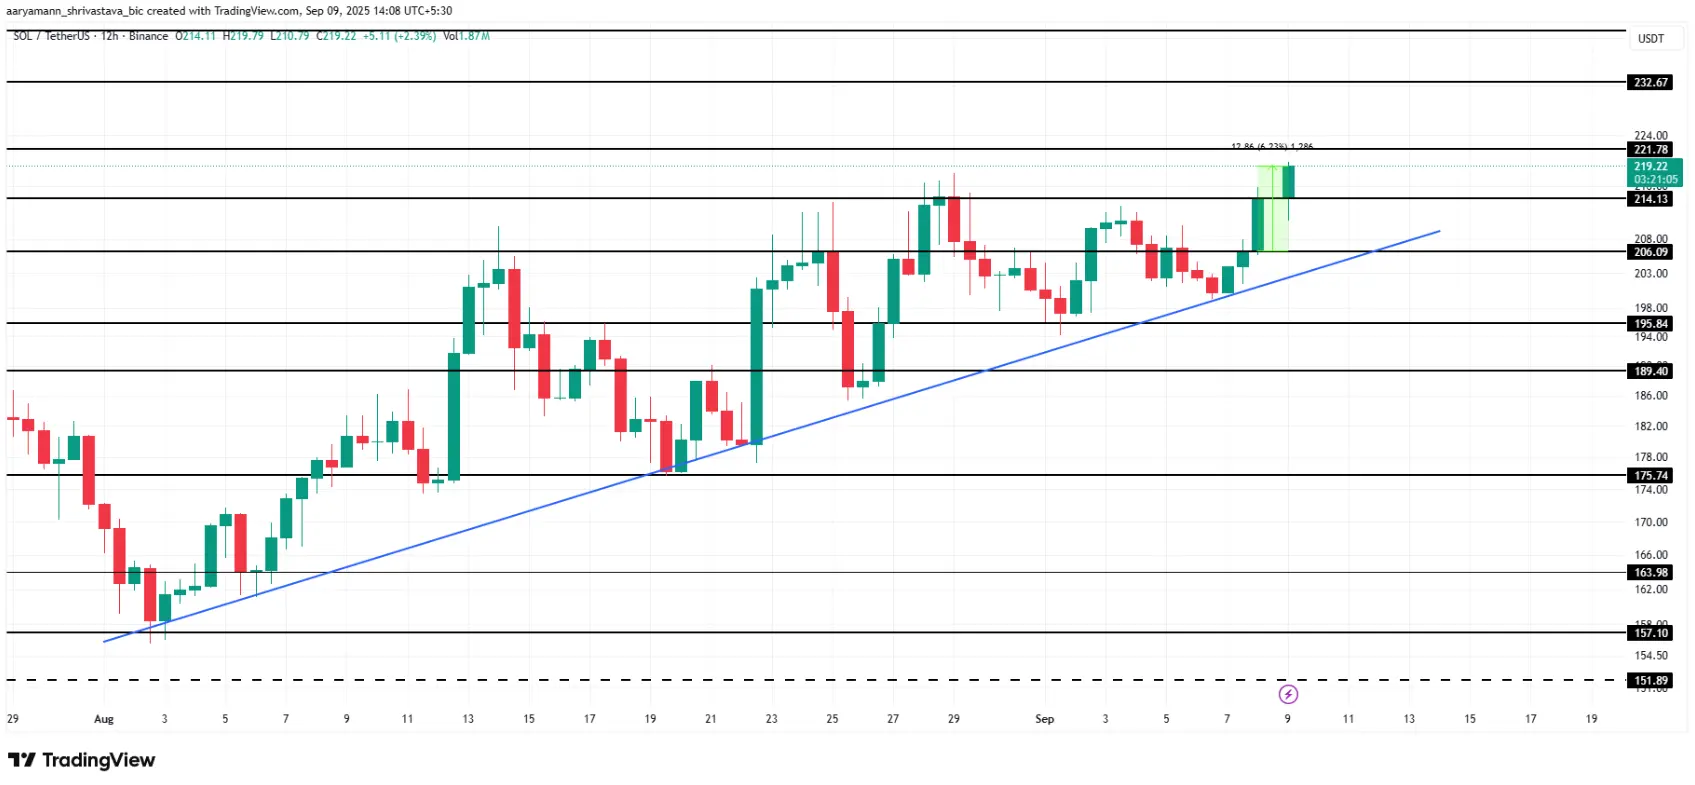
(Source: Trading View)
As of September 10, the SOL price is at 219 USD, stabilizing above the support level of 214 USD, and approaching the strong resistance area of 221 USD.
If it breaks through 221 dollars, it will break the pullback expectations and pave the way for further advances to 232 dollars; conversely, if buying momentum weakens, the price may pull back to 206 dollars, or even test the 195 dollars support.
Short-term Outlook: Pullback or Continuation of the Uptrend?
Bearish scenario: New addresses continue to decline + RSI close to reversal zone → Price retests the 206–195 USD range.
Bullish scenario: Demand surges sharply + Breaks 221 USD → Upside target points to 232 USD.
Although the long-term outlook remains optimistic, historical experience shows that short-term pullbacks after explosive surges are almost inevitable, and investors should be prepared for risk management.
Conclusion
Solana is currently in a contradictory period of “on-chain activity cooling vs price hitting new highs.” In the short term, the new address data and RSI signals both indicate a pullback risk, but if it breaks through key resistance, SOL is still expected to continue its upward trend. Investors need to closely monitor the battle between the 214 USD support and 221 USD resistance.
Disclaimer: The information on this page may come from third parties and does not represent the views or opinions of Gate. The content displayed on this page is for reference only and does not constitute any financial, investment, or legal advice. Gate does not guarantee the accuracy or completeness of the information and shall not be liable for any losses arising from the use of this information. Virtual asset investments carry high risks and are subject to significant price volatility. You may lose all of your invested principal. Please fully understand the relevant risks and make prudent decisions based on your own financial situation and risk tolerance. For details, please refer to
Disclaimer.
