Bitcoin (BTC) has recently faced resistance at the 120,000 USD level, falling 1.26% to 114,679 USD on August 23, marking the ninth consecutive trading day without breaking this psychological barrier. With Spot ETF funds flowing out for six consecutive days and a cumulative net outflow of 1.19 billion USD in August, concerns about weakened institutional demand are rising. Whether BTC can return to the 123,000 USD high in the future will depend on ETF fund flows, The Federal Reserve (FED) policies, and macroeconomic data.
ETF fund outflow pressure is increasing
According to Farside Investors data, as of the week of August 22, the United States BTC Spot ETF experienced a large outflow of funds:
iShares Bitcoin Trust (IBIT): Net outflow of $615 million, marking the first significant outflow since April 2025.
Fidelity Origin Bitcoin Fund (FBTC): Net outflow of 235.3 million USD
ARK 21Shares Bitcoin ETF (ARKB): Net outflow of 182.3 million USD
This week, a total of seven Spot ETF issuers reported net outflows totaling 1.179 billion USD, bringing the cumulative net outflow for August to 1.19 billion USD. This poses significant pressure on short-term demand for BTC.
ETH is also under pressure but shows relative resistance to falling
Ethereum (ETH) fell back after reaching a historical high of $4,890 on August 22, dropping 1.08% to $4,779 on August 23.
During the week, ETH Spot ETF experienced a net outflow of 241.1 million USD, but the cumulative net inflow for August still recorded 2.8 billion USD, outperforming BTC Spot ETF (which had a net outflow of 1.2 billion USD during the same period).
Since the beginning of July, the net inflow of ETH spot ETFs has reached 8.2 billion USD, while BTC has only seen 4.2 billion USD, indicating that institutional interest in ETH continues to grow.
Key Factors Influencing BTC Trends
In the coming weeks, the price trend of BTC will be influenced by multiple factors:
Legislative Progress: The U.S. Congress’s Review of the CLARITY Act
Macroeconomic data: US consumer confidence, GDP, unemployment claims, personal income and spending
The Federal Reserve (FED) policy: Chairman Powell and other officials’ positions on interest rates and inflation
ETF Fund Flow: Can Spot ETF Return to Net Inflow Status
Technical Analysis: $123,000 is the key breakout point
* Bitcoin (BTC)
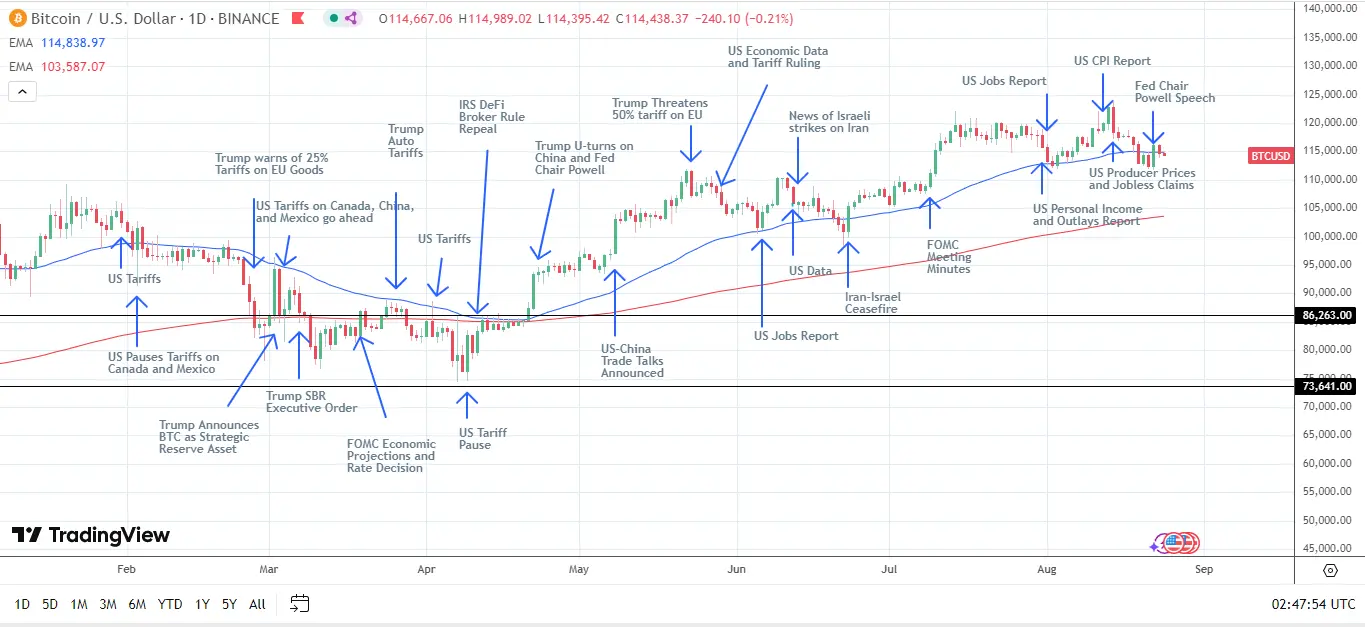
(Source: Trading View)
The current price is below the 50-day EMA but still above the 200-day EMA, maintaining a bullish long-term trend.
Upside target: Breaking through 115,000 USD will open up space to attack 120,000 USD. If it can maintain stability, it will challenge the historical high of 123,731 USD set on August 14.
Downside risk: A fall below $110,000 will test the 200-day EMA; if it fails to hold, $100,000 will become the next key support.
* Ethereum (ETH)
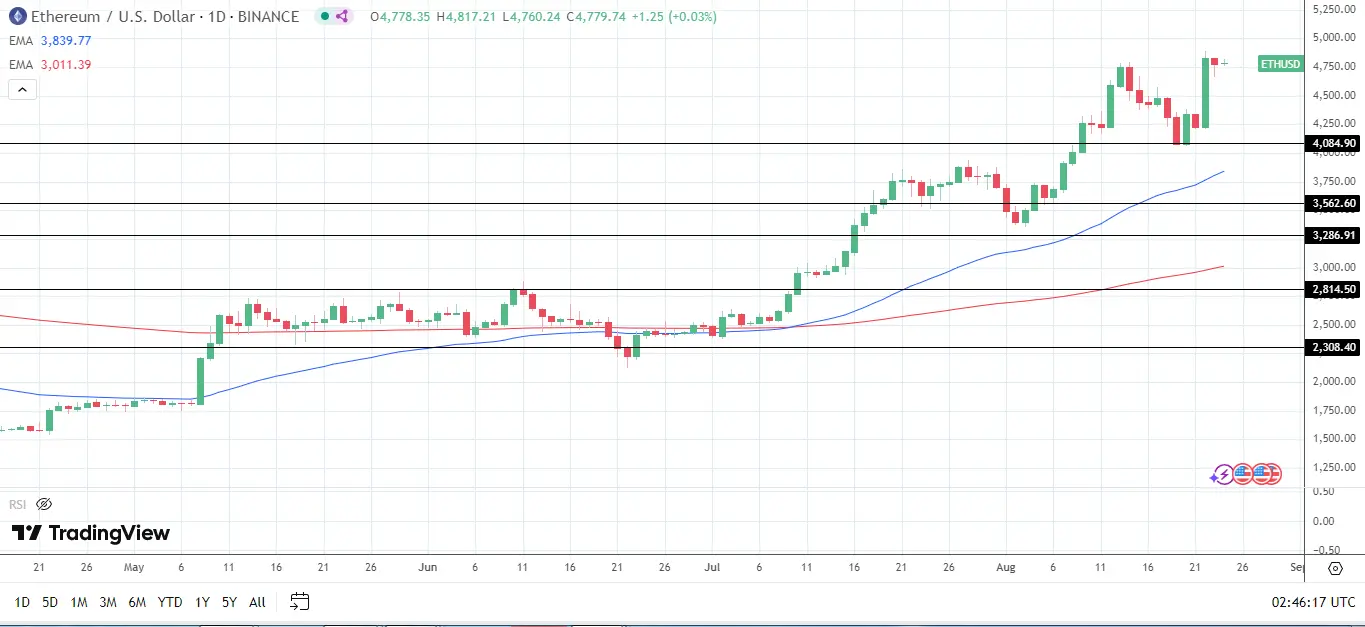
(Source: Trading View)
The price is still above the 50-day and 200-day EMA, maintaining a strong pattern.
Upside target: A breakthrough of 5,000 USD will lay the foundation for a challenge at 6,000 USD.
Downside risk: A fall below $4,750 will test the support at $4,500, with further support at $4,085.
Scenario Simulation
Bullish scenario: The Federal Reserve (FED) releases dovish signals, ETF fund inflows rebound, and crypto legislation gains bipartisan support, BTC is expected to return to $123,000 and set a new high.
Bearish Scenario: Rising risk of economic recession, The Federal Reserve (FED) turning hawkish, continuous capital outflows from ETFs, BTC may fall back to $110,000 or even test the $100,000 support.
Conclusion
Bitcoin is at a critical price range, with $123,000 being both a psychological barrier and a technical resistance level. The short-term trend will depend on the ETF capital flows and signals from The Federal Reserve (FED). For investors, closely monitoring macroeconomic data and changes in ETF capital will be key to determining the next move of BTC.
Disclaimer: The information on this page may come from third parties and does not represent the views or opinions of Gate. The content displayed on this page is for reference only and does not constitute any financial, investment, or legal advice. Gate does not guarantee the accuracy or completeness of the information and shall not be liable for any losses arising from the use of this information. Virtual asset investments carry high risks and are subject to significant price volatility. You may lose all of your invested principal. Please fully understand the relevant risks and make prudent decisions based on your own financial situation and risk tolerance. For details, please refer to
Disclaimer.