Bitcoin (BTC) has recently fallen below its ascending triangle structure after weeks of consolidation, dropping to $113,400, with a decline of over 2.75% in the past 24 hours. This technical breakdown has raised concerns in the market about the $110,000 support level, while also turning the 50-day MA ($115,870) into a new resistance level. As the price shifts into a corrective phase in the short term, traders are closely following whether BTC can hold the key neckline to avoid a deeper pullback.
Technical Breakout: Short-term Trend Reversal Correction
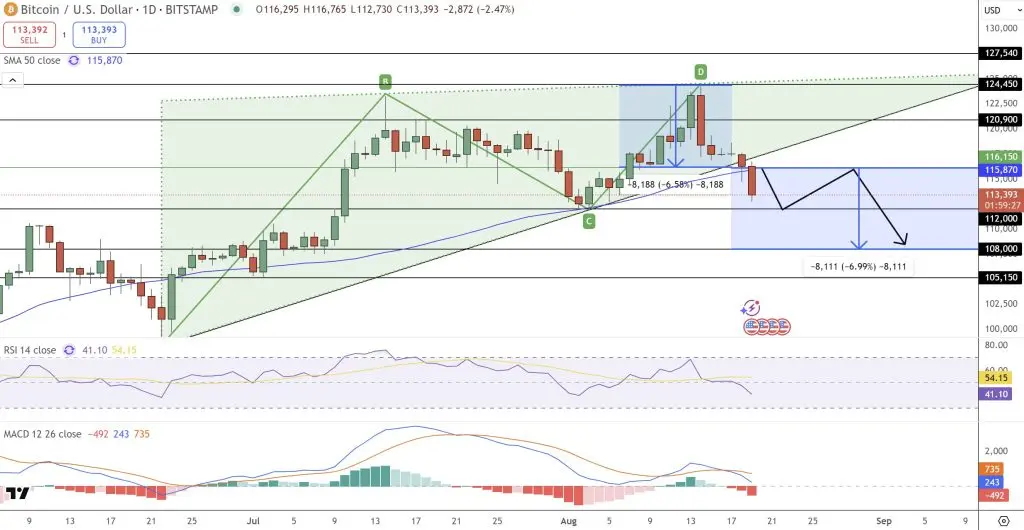
(Source: Trading View)
Bitcoin ended its four-week uptrend after forming a bearish engulfing K-line at $124,450, and broke below the ascending triangle support. This move not only disrupted the bulls’ short-term rhythm but also caused the 50-day SMA to turn into a resistance level.
The daily chart shows that BTC is forming a head and shoulders pattern, with the neck line support level at 112,000 USD. Once it effectively falls below that, it could trigger an accelerated decline to 108,000 USD, or even test the support area of 105,150 USD.
Technical Indicators and Pattern Signals
MACD: has turned negative, indicating bearish momentum.
RSI: At 41, not yet in the oversold zone, meaning there is still room for a fall.
K-line pattern: Multiple consecutive bearish K-lines, similar to the early stage of “Three Black Crows”, indicating an increase in bearish strength.
Nonetheless, from a longer-term perspective, BTC has maintained a gradually rising structure of higher lows since June. The small bearish candles, doji, and spinning top patterns that appeared in the 113,000–114,000 USD range indicate that the market is still in a wait-and-see mode rather than a full-scale sell-off.
Medium-term trend: Potential path to 130,000 USD
If the buying pressure stabilizes above 116,150 USD, BTC is expected to rebound to 120,900 USD and challenge the 124,450 USD resistance level. Once this range is broken, it will open up upward space, targeting 127,540 USD or even 130,000 USD.
The key to this situation lies in whether the market can absorb the selling pressure and regain momentum in the short term, especially under stable macroeconomic conditions.
Trader Situational Analysis
* Bullish Strategy
Trigger condition: The daily closing price is above 116,150 USD and a bullish engulfing candlestick appears.
Target price level: $120,900–$124,450
Stop Loss Position: Below 112,000 USD
* Bearish Strategy
Trigger condition: falls below the 112,000 USD neck support
Target price level: $108,000, further looking towards $105,150
Stop loss position: above $116,000
Although the short-term technicals are under pressure, institutions and long-term holders are still accumulating at low levels. For example, companies like Metaplanet and Strategy continue to increase their holdings during price pullbacks, indicating that the structural bullish trend has not yet been broken.
Conclusion
Bitcoin is currently at a critical technical turning point, with the $112,000 neckline support determining the short-term trend direction. If it fails to hold, the risk of a pullback to $100,000 will increase; if it holds and breaks through resistance, it is expected to reopen the upward channel towards $130,000. For long-term investors, this pullback seems more like an accumulation phase rather than a signal of the end of a bull market. For more BTC price analysis and real-time quotes, please follow the official Gate platform.
Disclaimer: The information on this page may come from third parties and does not represent the views or opinions of Gate. The content displayed on this page is for reference only and does not constitute any financial, investment, or legal advice. Gate does not guarantee the accuracy or completeness of the information and shall not be liable for any losses arising from the use of this information. Virtual asset investments carry high risks and are subject to significant price volatility. You may lose all of your invested principal. Please fully understand the relevant risks and make prudent decisions based on your own financial situation and risk tolerance. For details, please refer to
Disclaimer.