Ethereum (ETH) recorded its highest weekly closing price in four years and is entering a critical trading week. The price is currently oscillating between two major liquidity ranges, with a fluctuation of over 11%. Technically, it appears that ETH may first retest $3,900 to absorb liquidity, and then, driven by strong inflows of institutional funds, aim for a historical high, with the potential for a pump of up to 100%.
Key support below: $3,900 serves as the bullish defense line
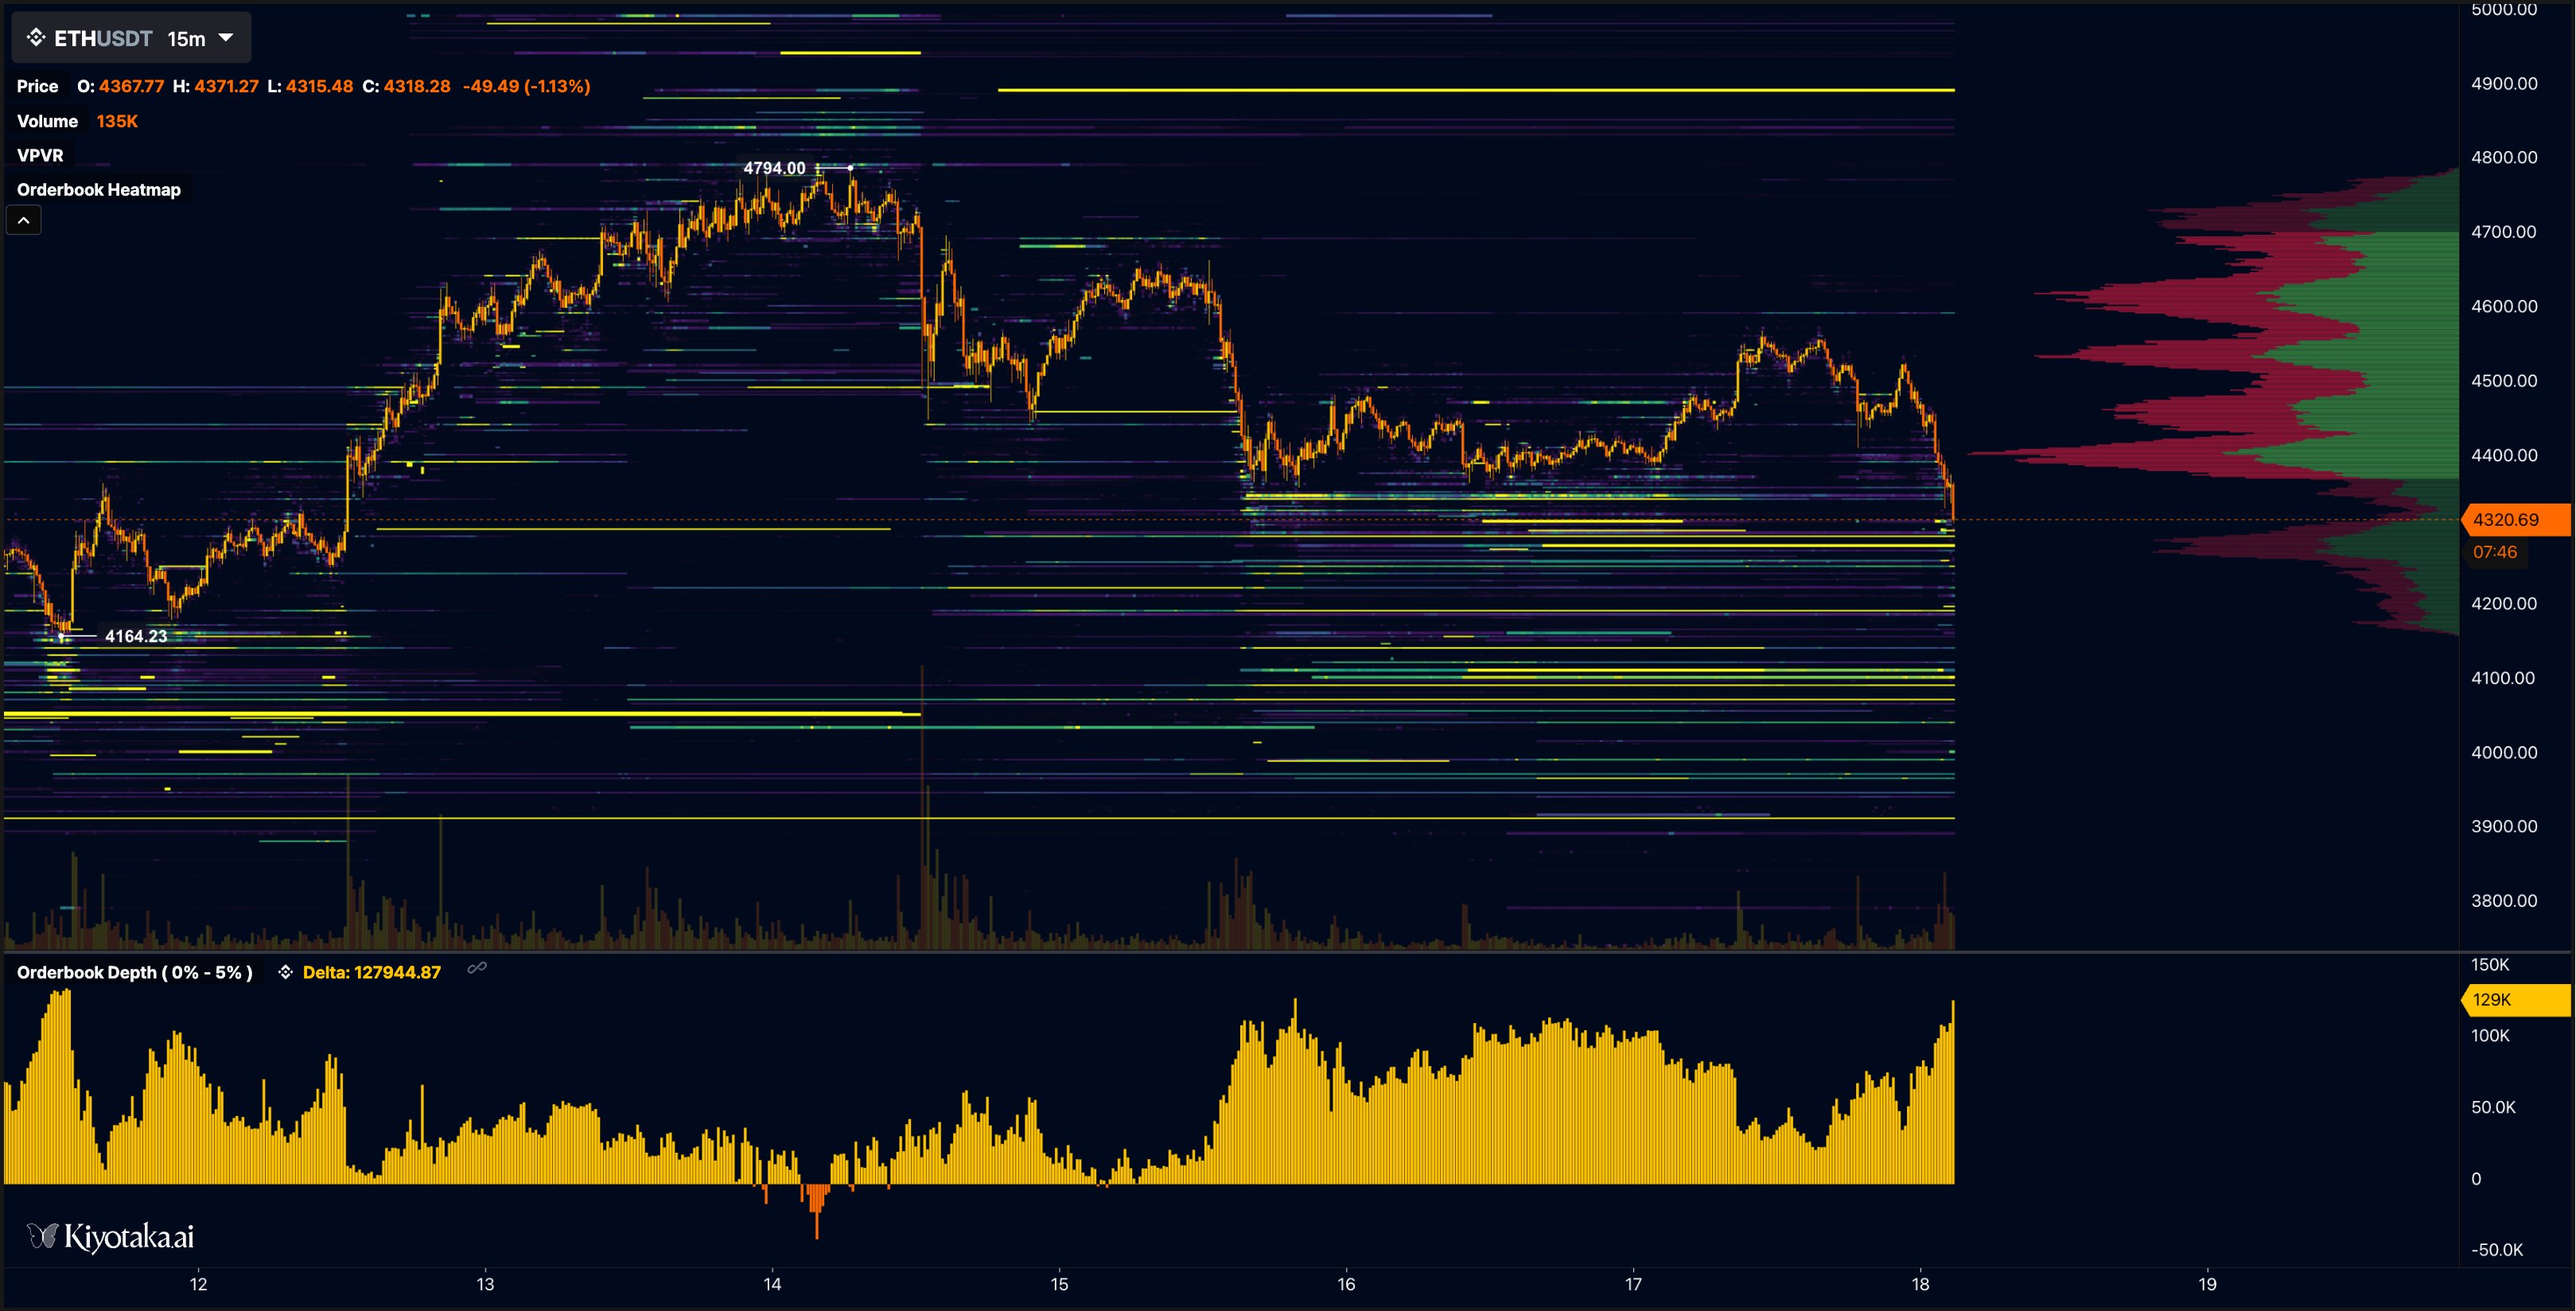
On August 18, ETH briefly dropped to $4,224, and market focus quickly shifted to the support level of $4,150. This position has been tested multiple times and coincides with the golden Fibonacci retracement range of $4,100–$3,900.
The trading platform analyst Kiyotaka pointed out that there is a large accumulation of buy orders in the $3,900 area, which is a potential “stop-loss hunting” and trend reversal core position. This means that a short-term pullback is not only highly likely but could also become the trigger point for the next wave of a pump.
Resistance and Breakthrough Conditions
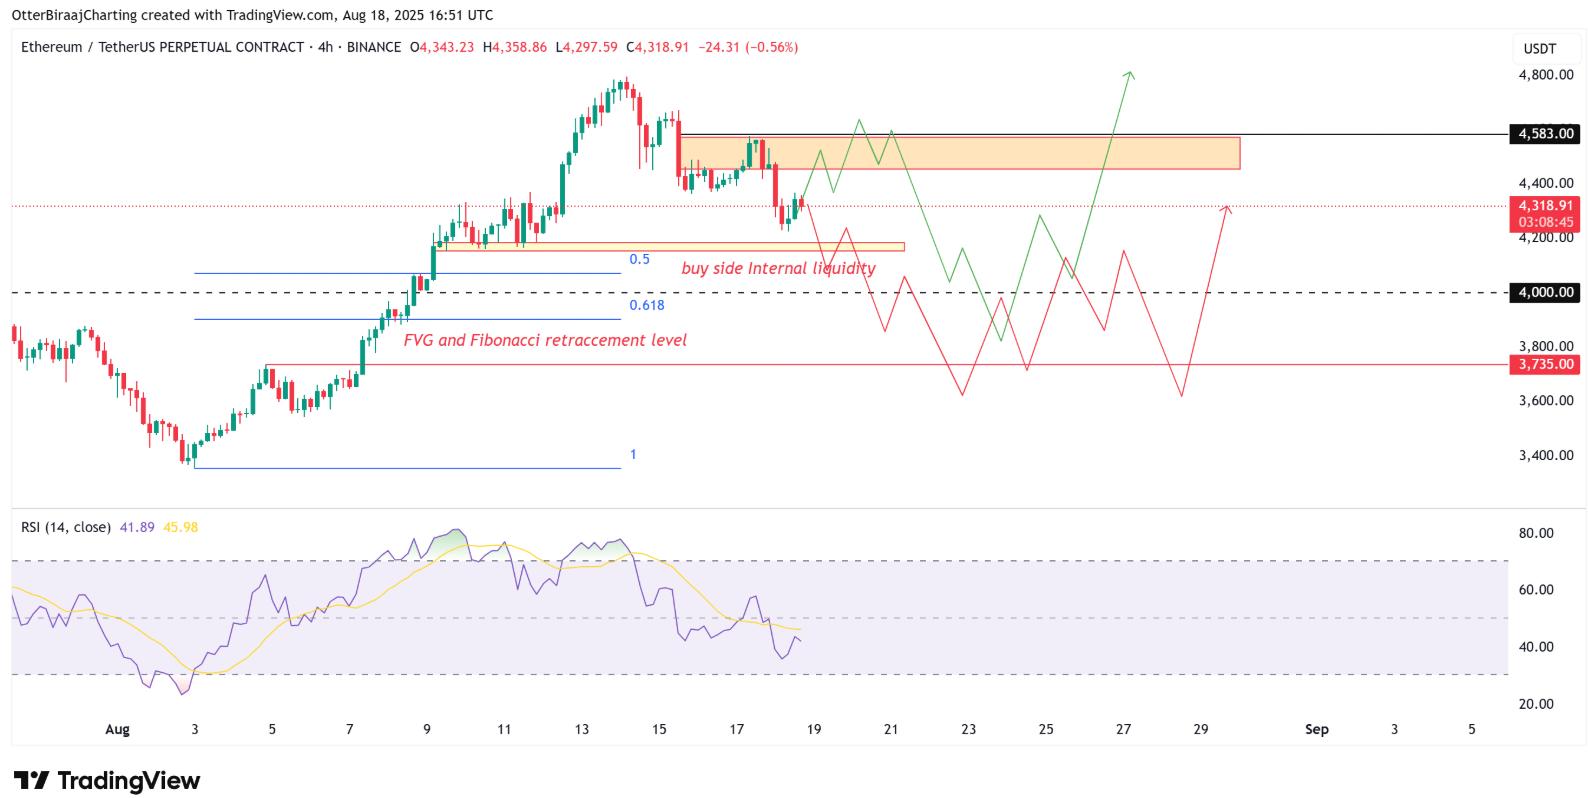
On the upside, there is a liquidity dense area around 4,400 USD for ETH, which formed an imbalance during the weekly low period and may attract price recovery in the short term. If it can break through the high resistance of 4,583 USD, ETH will open the door to challenge historical highs, continuing the strong bullish trend that has lasted for several weeks.
Structurally, a pullback to $3,900 to clear early long positions will provide sufficient momentum for a subsequent rebound to $4,500 or even higher.
Technical Indicators and Capital Resonance
The relative strength index (RSI) on the four-hour level is still below 50, indicating that there is still room for a downward movement in the short term, which helps to enter the oversold area and build momentum for a rebound.
The funding side shows strong bullish signals — last week, the net inflow of Ethereum spot ETF in the United States reached 649,000 ETH, setting a historical high. This institutional buying demand provided strong support for ETH to rebound quickly after the pullback.
Long-term Outlook: Bull Flag Pattern May Indicate Doubling Market
Market analysts point out that the long-term trend of ETH is showing a multi-year bull flag pattern, approaching a breakout zone. Well-known trader Merlijn stated that each pullback is accompanied by smart money entering, while weak hands are washed out during the consolidation.
Long-term forecasts indicate that ETH may complete its final deep correction in the range of $3,000–$3,500, followed by a surge towards $8,000, with a potential increase of 100%, setting a new historical record.
Conclusion
The current technical and funding signals for ETH are highly consistent: in the short term, it may first dip to $3,900 to absorb liquidity, followed by a strong rebound driven by institutional funds, aiming for a historical high. For traders, this is a golden window for “buying on the dip.” For more real-time market data and technical analysis, please follow the official Gate platform.
Disclaimer: The information on this page may come from third parties and does not represent the views or opinions of Gate. The content displayed on this page is for reference only and does not constitute any financial, investment, or legal advice. Gate does not guarantee the accuracy or completeness of the information and shall not be liable for any losses arising from the use of this information. Virtual asset investments carry high risks and are subject to significant price volatility. You may lose all of your invested principal. Please fully understand the relevant risks and make prudent decisions based on your own financial situation and risk tolerance. For details, please refer to
Disclaimer.
