Bitcoin (BTC) is currently reported at around 117,430 USD in the Asian early session today (16). The ratio of gold to Bitcoin has dipped to the 0.2 level, providing strong support for Bitcoin’s pump. Analyzing the weekly chart, if Bitcoin breaks through 115,000 USD, it is expected to challenge a new target price of 140,000 USD.
The ratio of gold to Bitcoin dips below the 0.2 level, breaking it may signal a strong pump for BTC
The ratio of gold to Bitcoin indicates that it has formed strong resistance in a long-term downward channel and continues to decline. Recently, Bitcoin broke the $120,000 mark, pushing the ratio of gold to Bitcoin down to a level of 0.2. The key support level is at 0.026. Falling below this level could trigger another strong pump for Bitcoin.
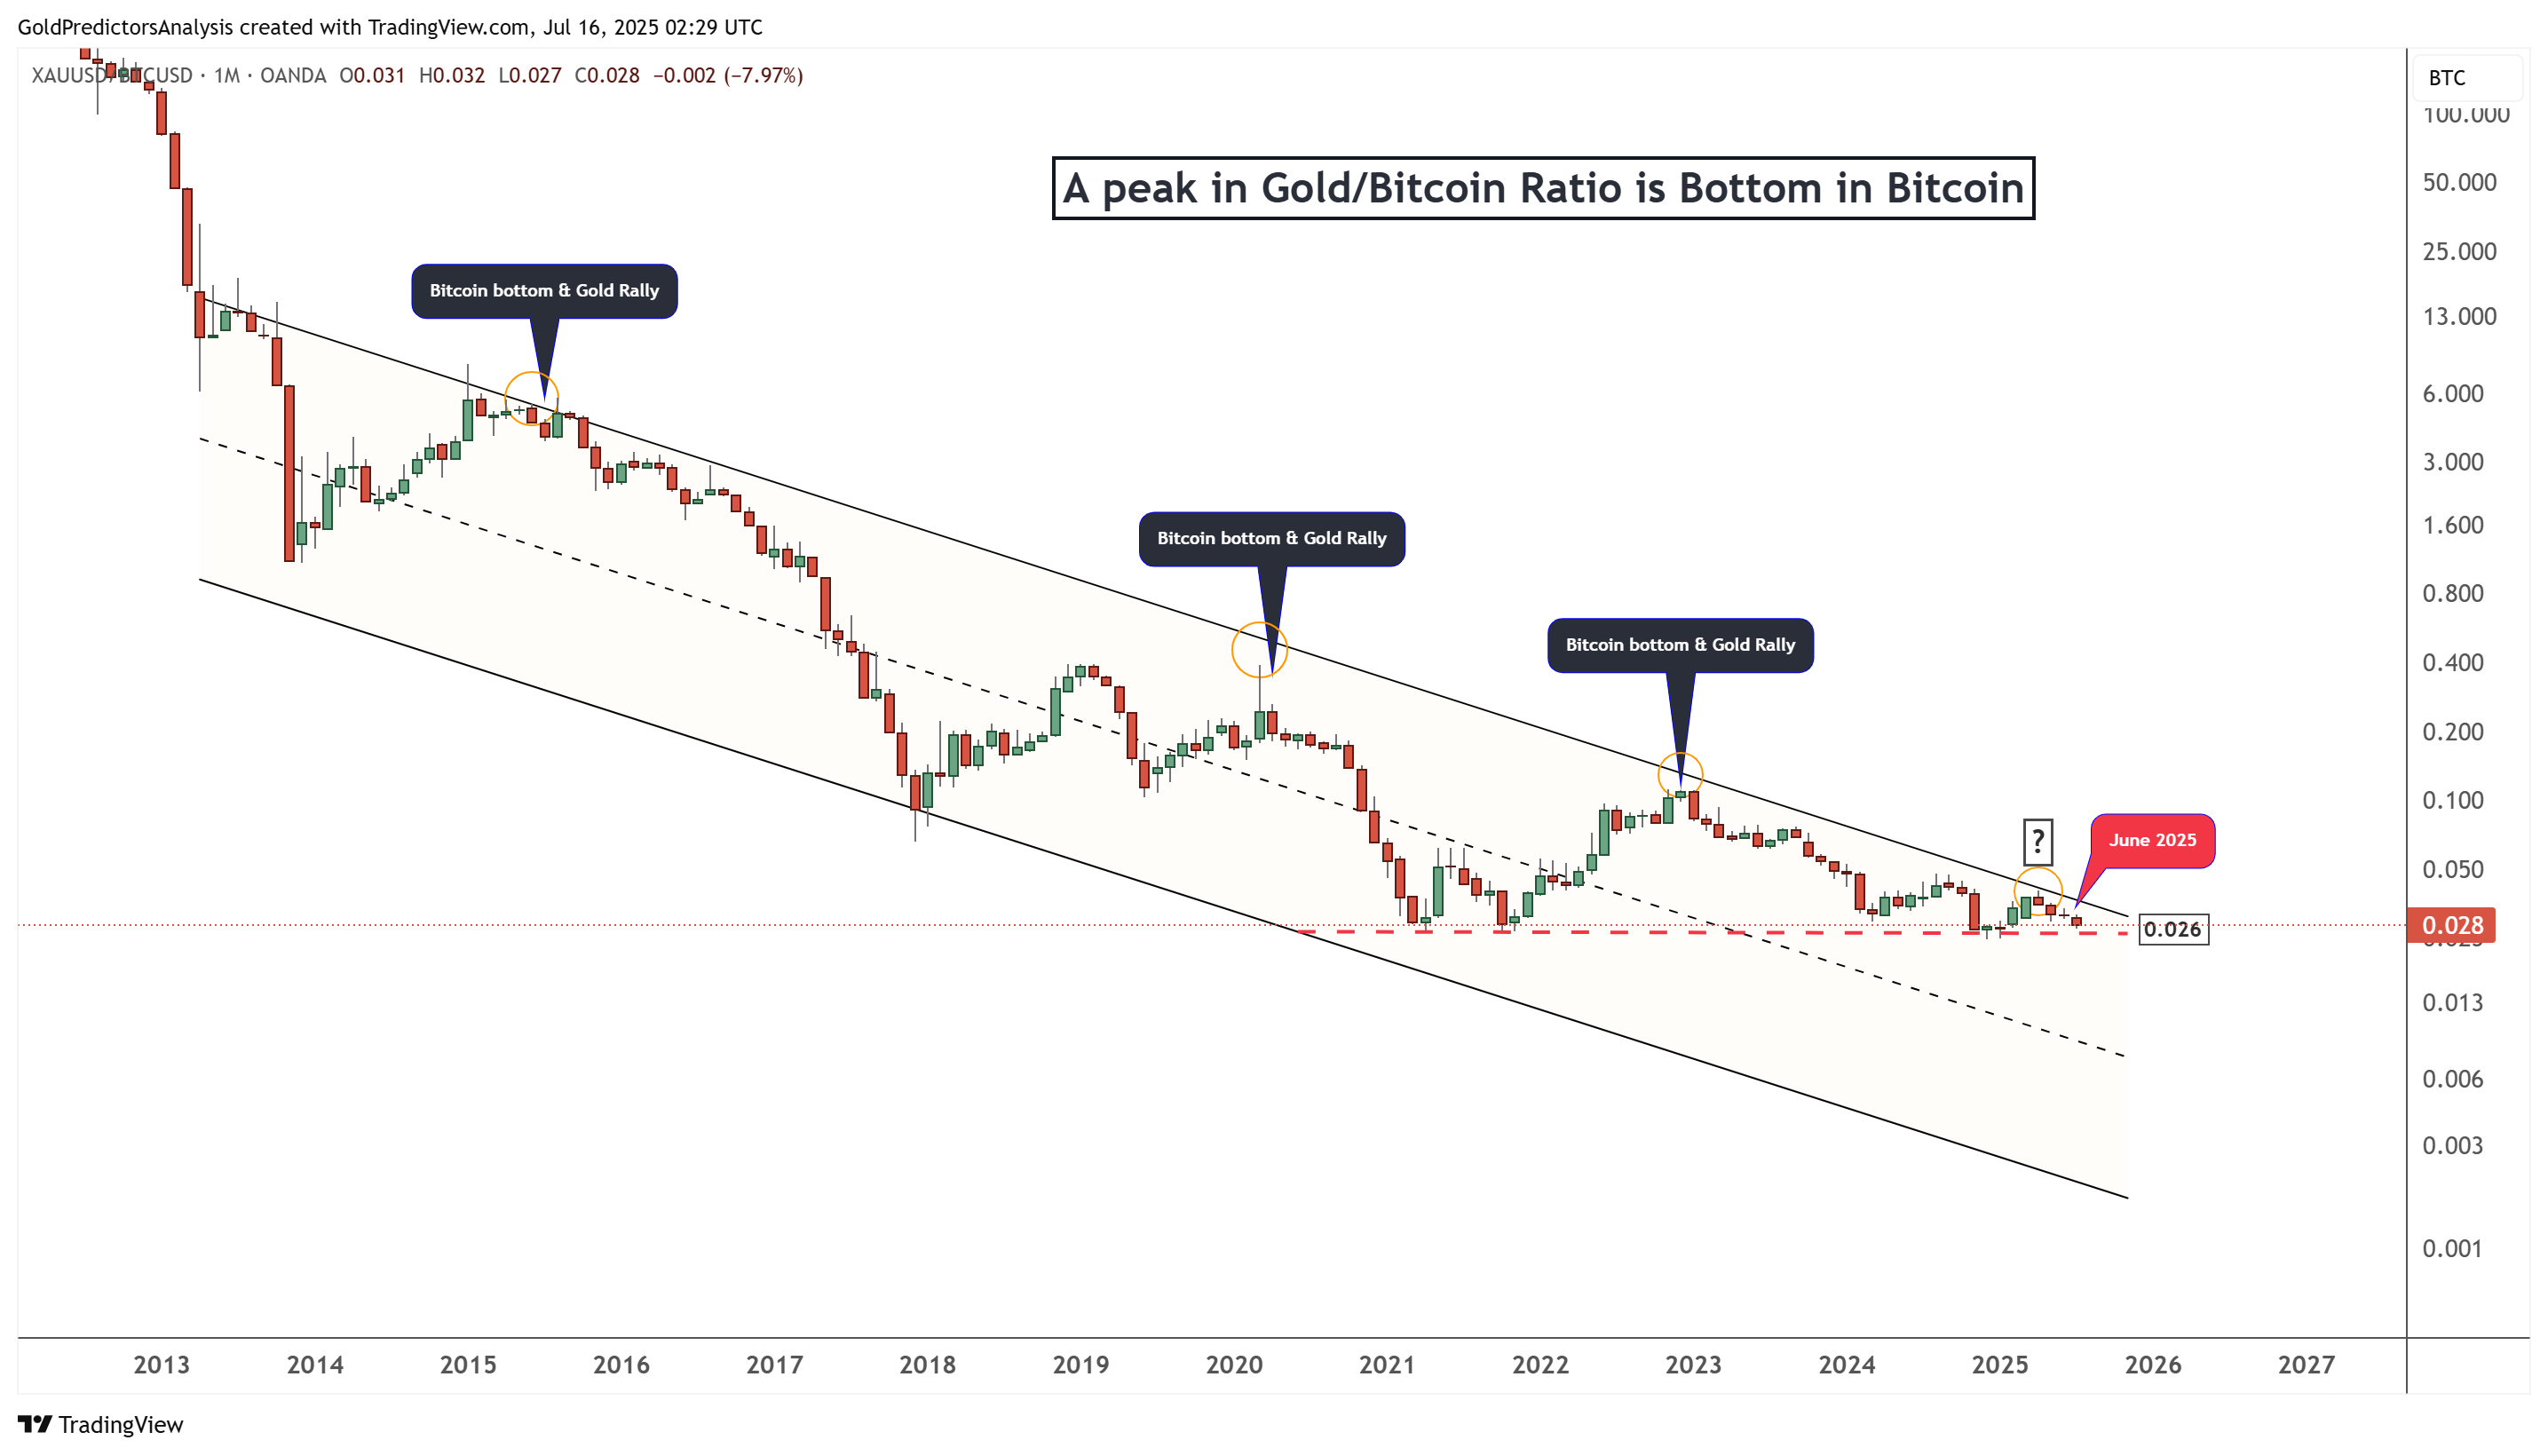
(Source: Trading View)
The ratio of Bitcoin to gold shows that the recent surge in Bitcoin has pushed it to a level of 35. A breakout above the ratio of 40 could trigger a new round of strong rebounds in Bitcoin’s price. This ratio has shown a bullish price trend, indicating a high probability of a breakout, which would be a strong bullish signal for Bitcoin.
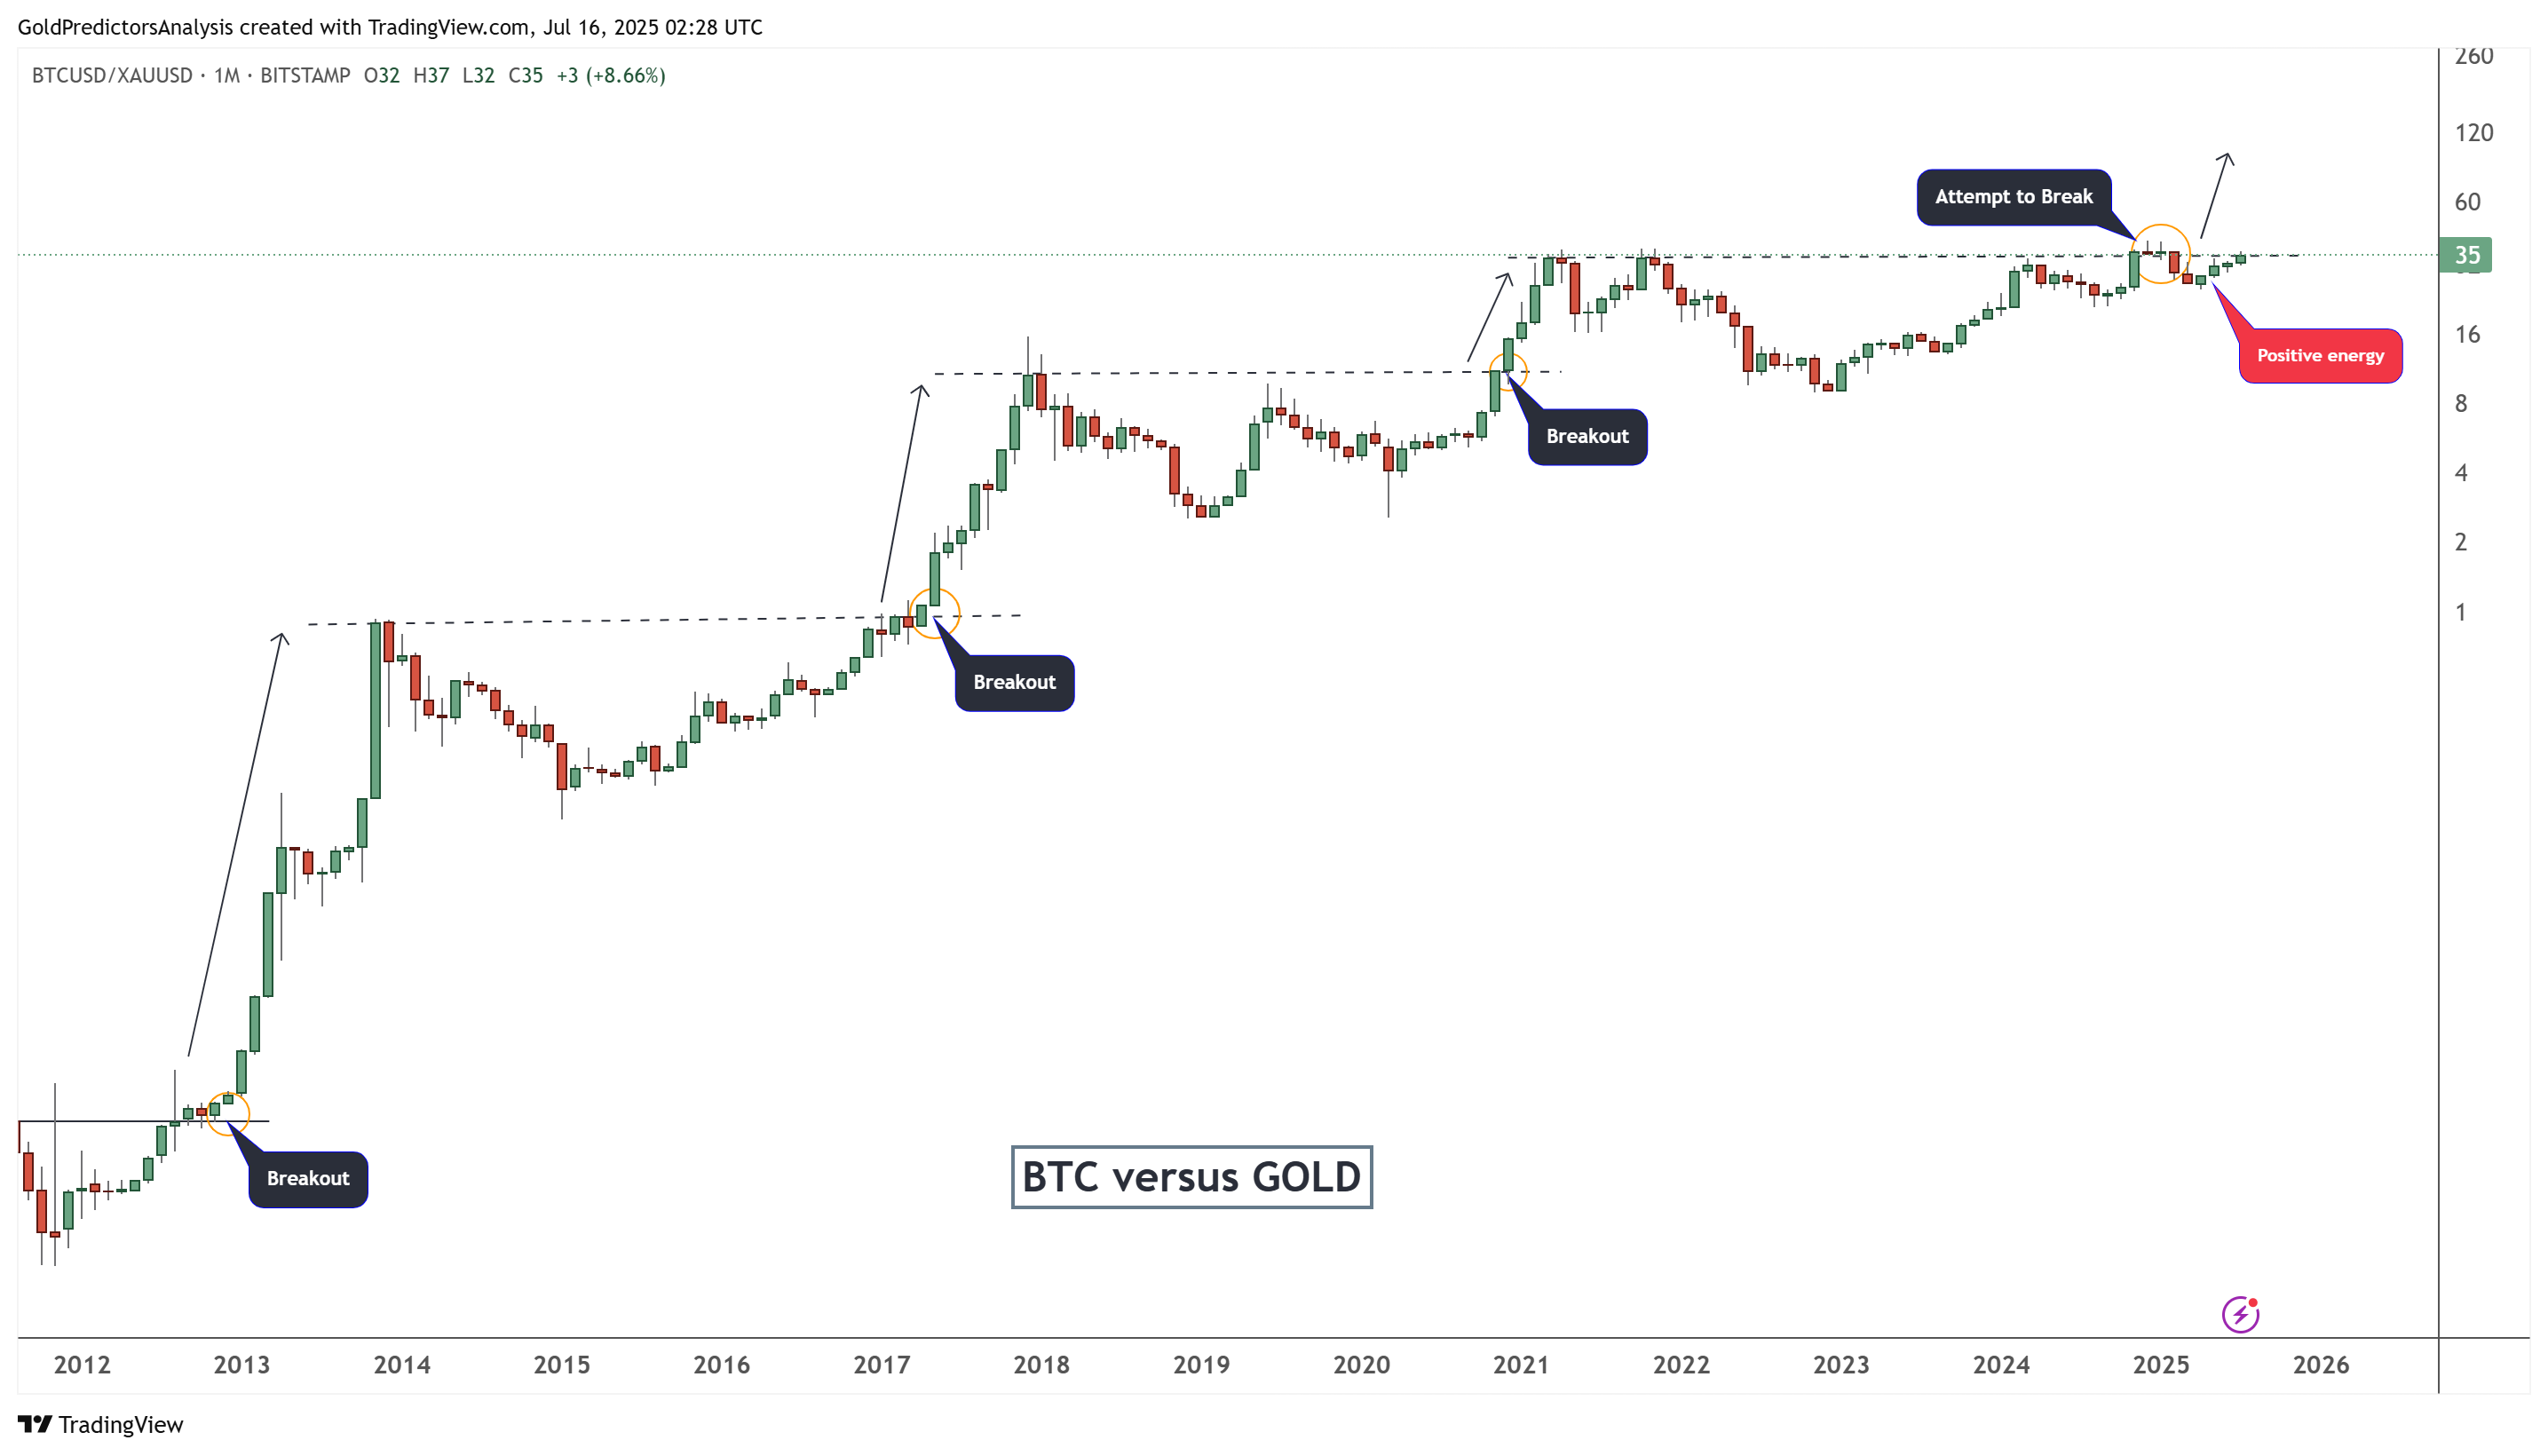
(Source: Trading View)
Bitcoin Price Analysis
FXEmpire analyst Muhammad Umair stated that the Bitcoin weekly chart shows it attempting to break through the $115,000 area. The emergence of a cup pattern, followed by a descending expanding wedge, and the break above the $75,000 level have triggered strong bullish momentum.
Last week, the price attempted to break through the $115,000 area and closed above the neckline. However, it is necessary to close above that level for two consecutive weeks to confirm a strong breakout. Once the breakout at $115,000 is confirmed, it could trigger a strong rally in the short term, with a target price of $140,000.
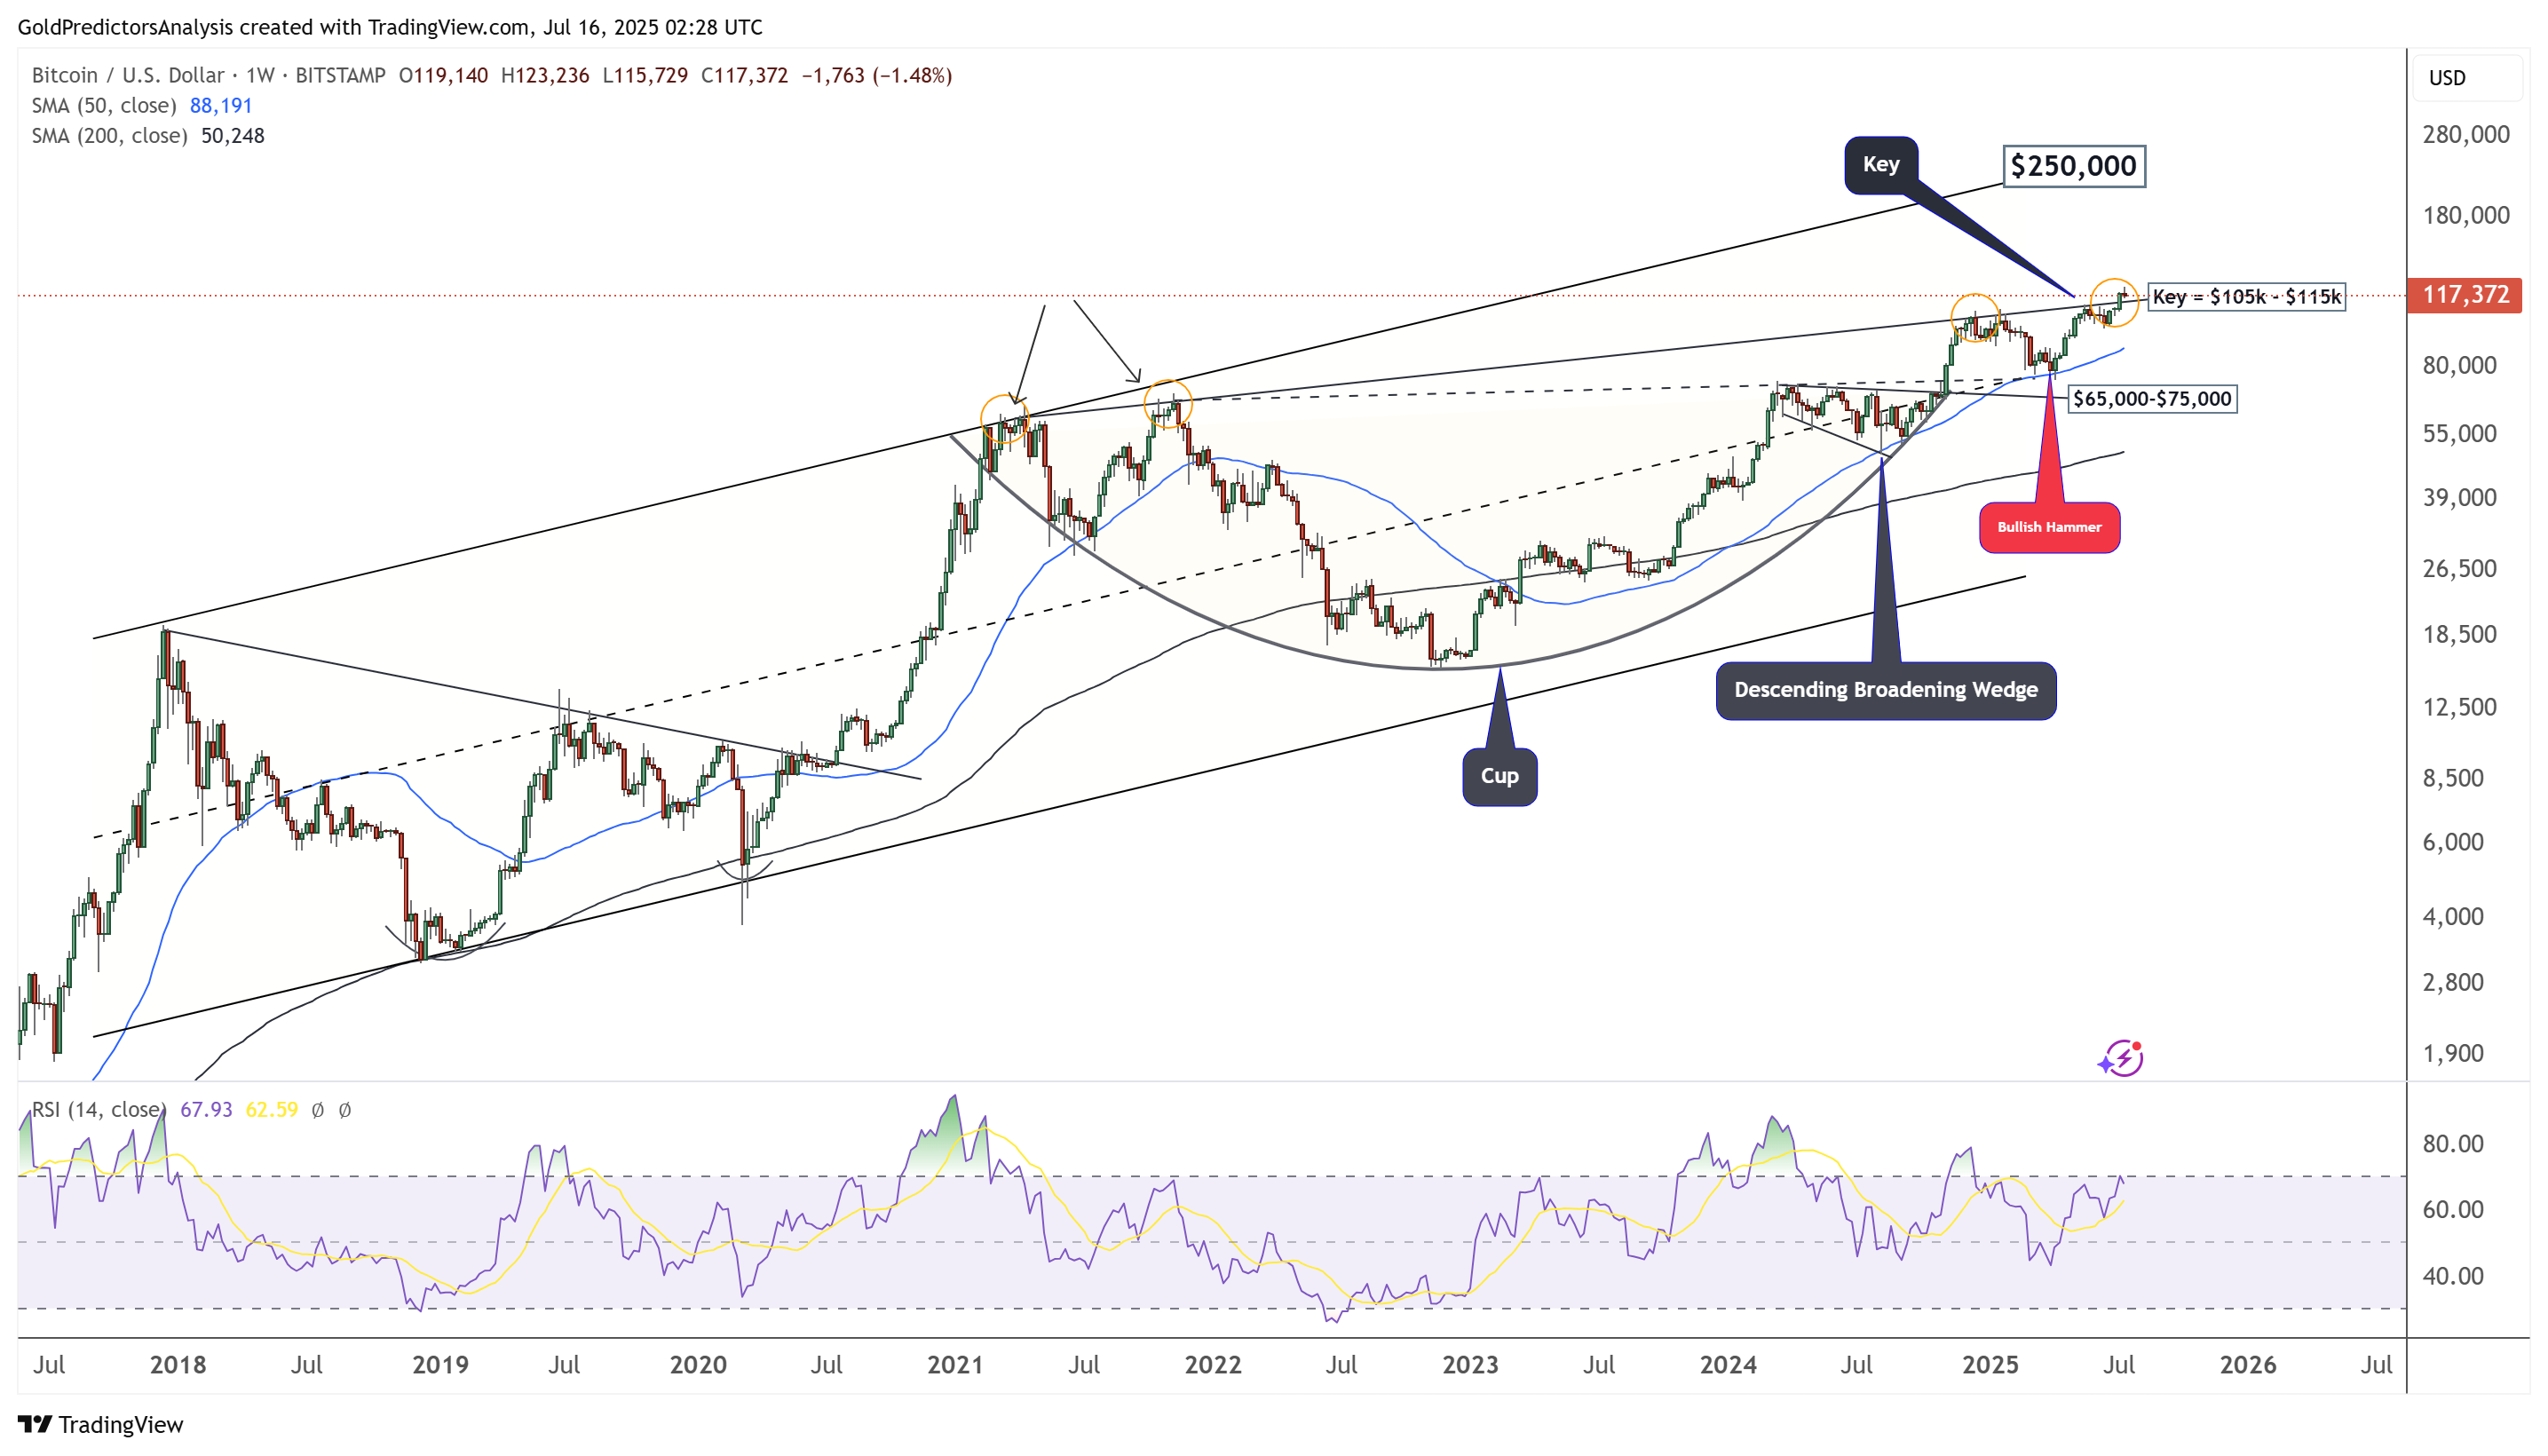
(Source: Trading View)
The daily chart of Bitcoin shows that the price is within an ascending expanding wedge pattern. After breaking through the $73,000 area, the price is clearly visible and forms an inverted head and shoulders pattern, with the neckline located around the $105,000-$115,000 area.
The price recently broke through $115,000 and is currently in a pullback phase. If the price falls below $100,000, it may indicate a false breakout and lead to further consolidation. However, if the price breaks through the $115,000 area again, it may continue the upward momentum in the short term, aiming for a target of $140,000.
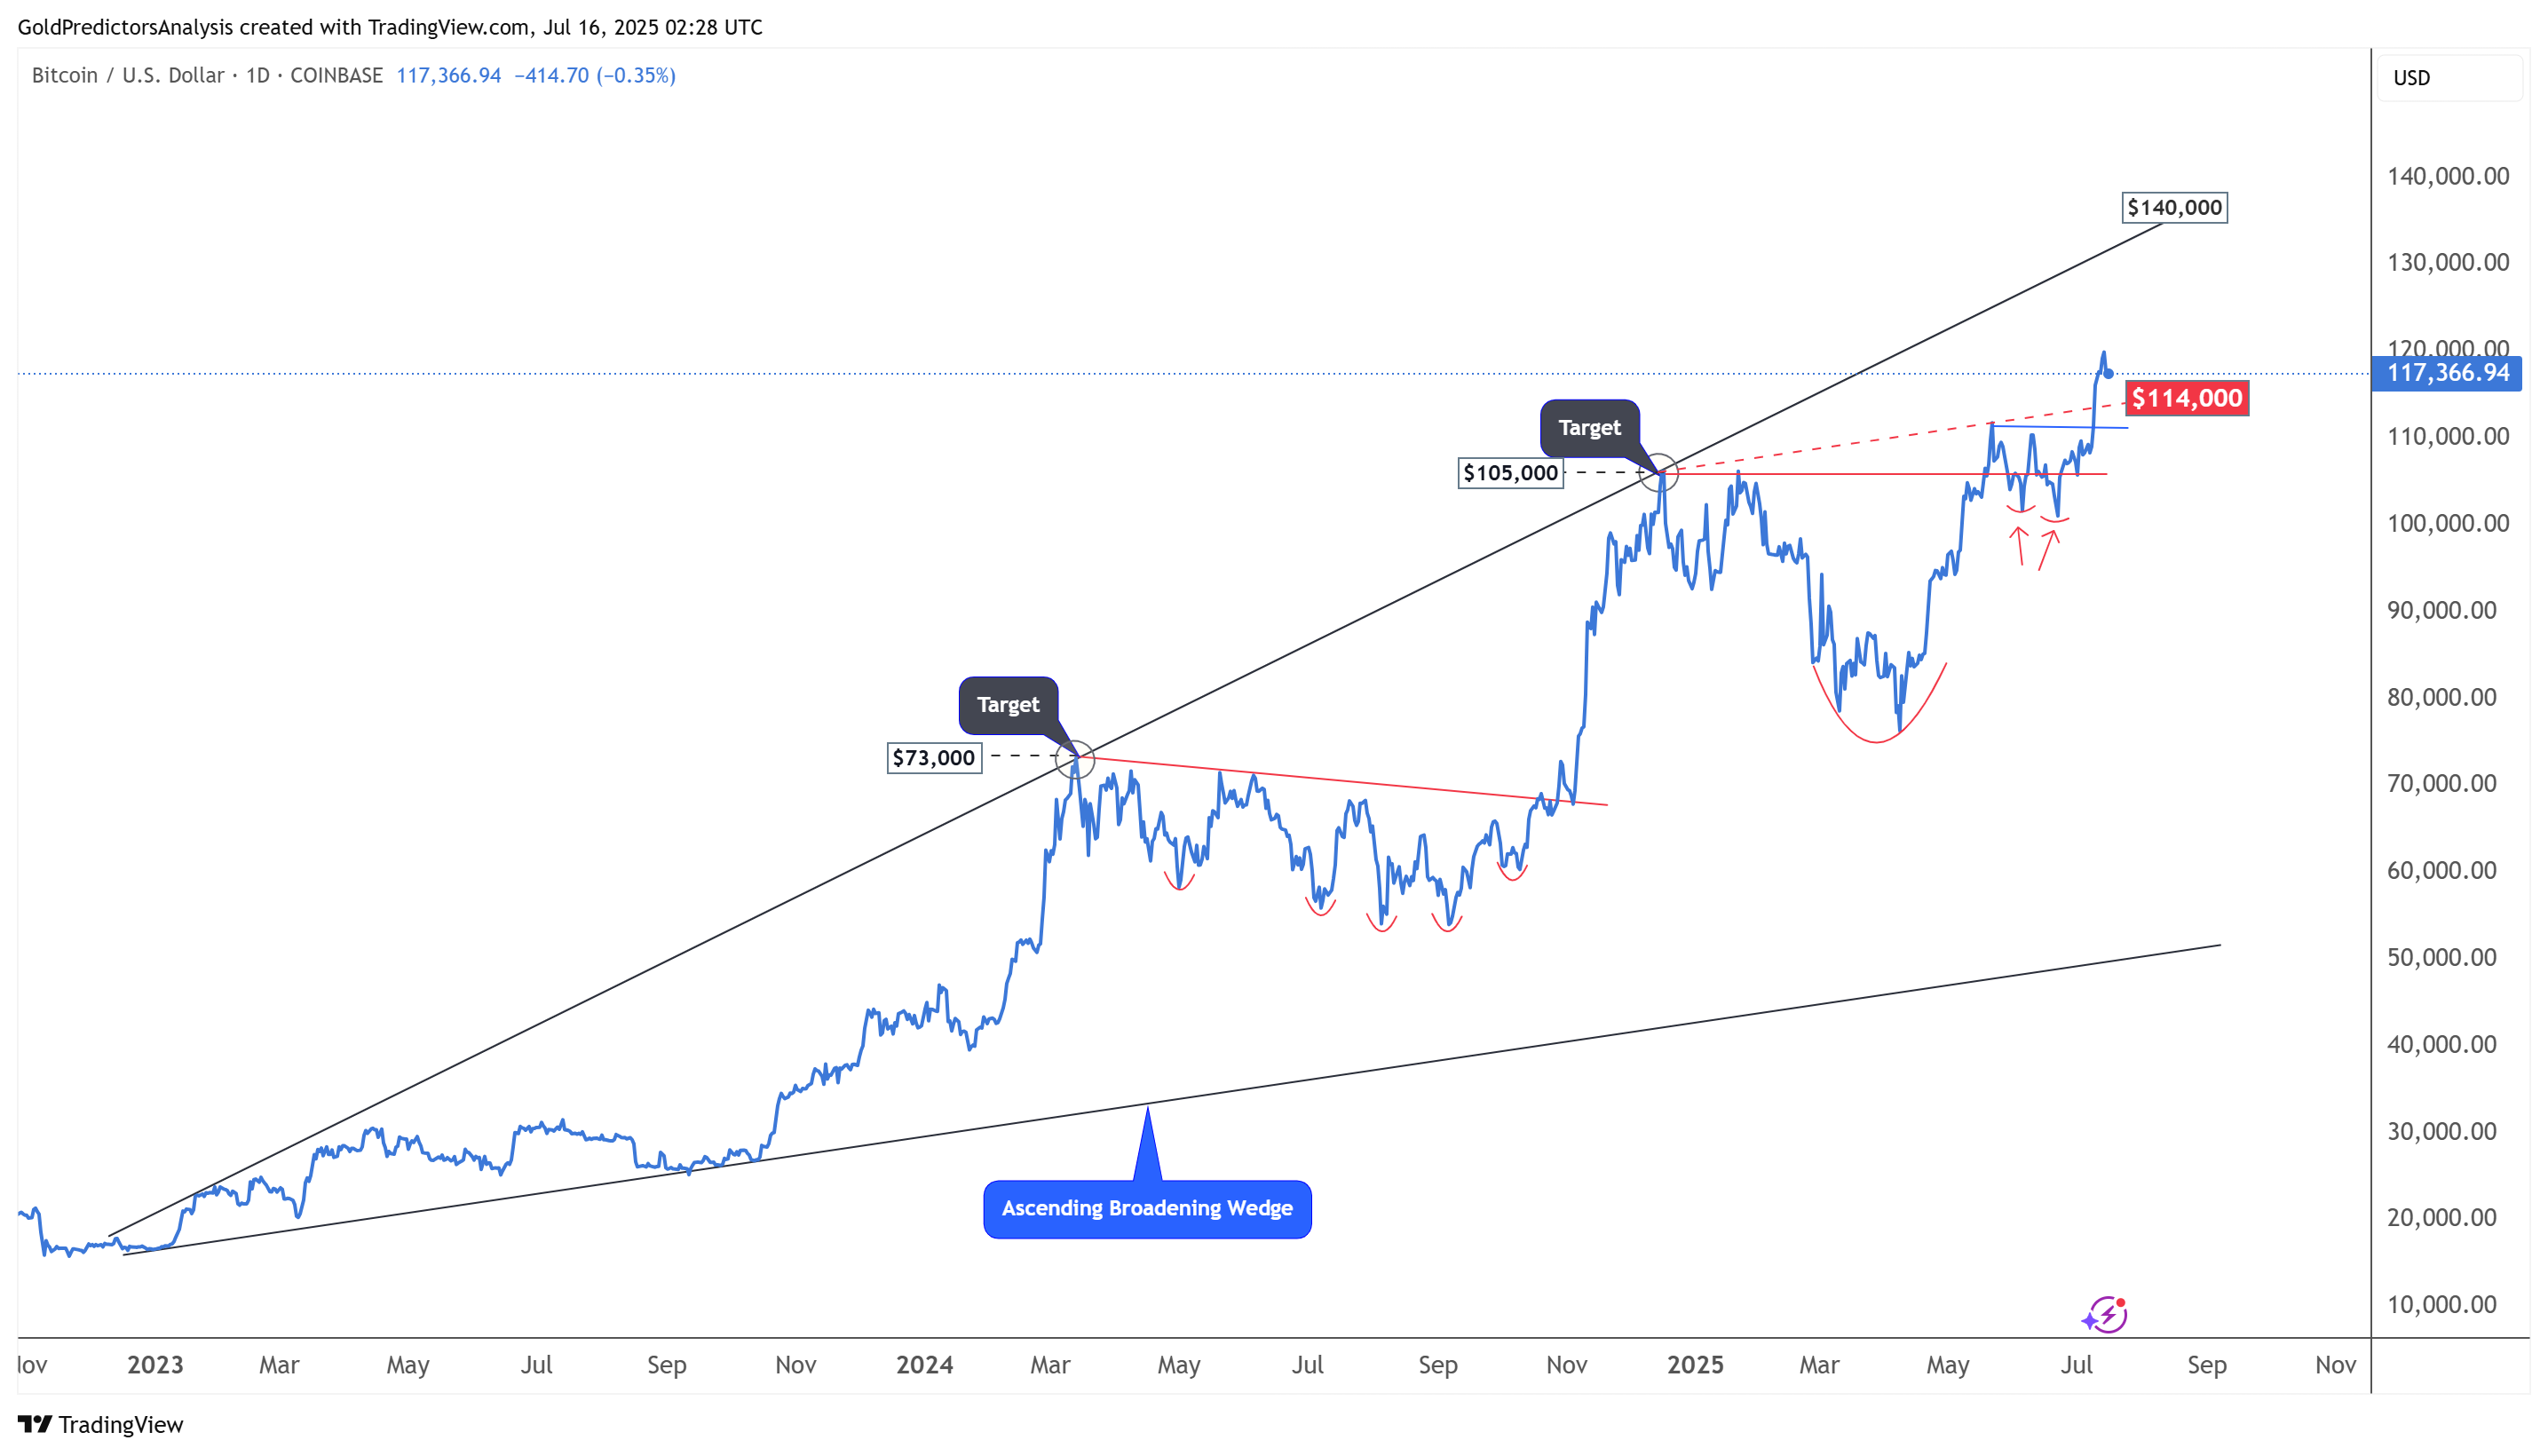
(Source: Trading View)
Disclaimer: The information on this page may come from third parties and does not represent the views or opinions of Gate. The content displayed on this page is for reference only and does not constitute any financial, investment, or legal advice. Gate does not guarantee the accuracy or completeness of the information and shall not be liable for any losses arising from the use of this information. Virtual asset investments carry high risks and are subject to significant price volatility. You may lose all of your invested principal. Please fully understand the relevant risks and make prudent decisions based on your own financial situation and risk tolerance. For details, please refer to
Disclaimer.