Mantle (MNT) is maintaining its pump today (15th) during the Asian afternoon session, currently reported at 0.7183 USD, as Bitcoin experiences a pullback from its peak. The optimistic sentiment in the derivatives market still exists, as reflected in the increase of open contracts. As MNT’s bullish momentum approaches the dynamic resistance level of the 200-day Exponential Moving Average (EMA), the technical outlook has sent mixed signals.
The increase in open contracts for MNT indicates a strengthening of optimistic sentiment
The open interest (OI) of cryptocurrencies refers to the total value of active positions in the derivatives market. Typically, an increase in open interest indicates a rise in capital inflow, which is a sign of increased trading activity.
Coinglass data shows that last week, the MNT open interest increased by 18%, reaching 21.63 million USD.
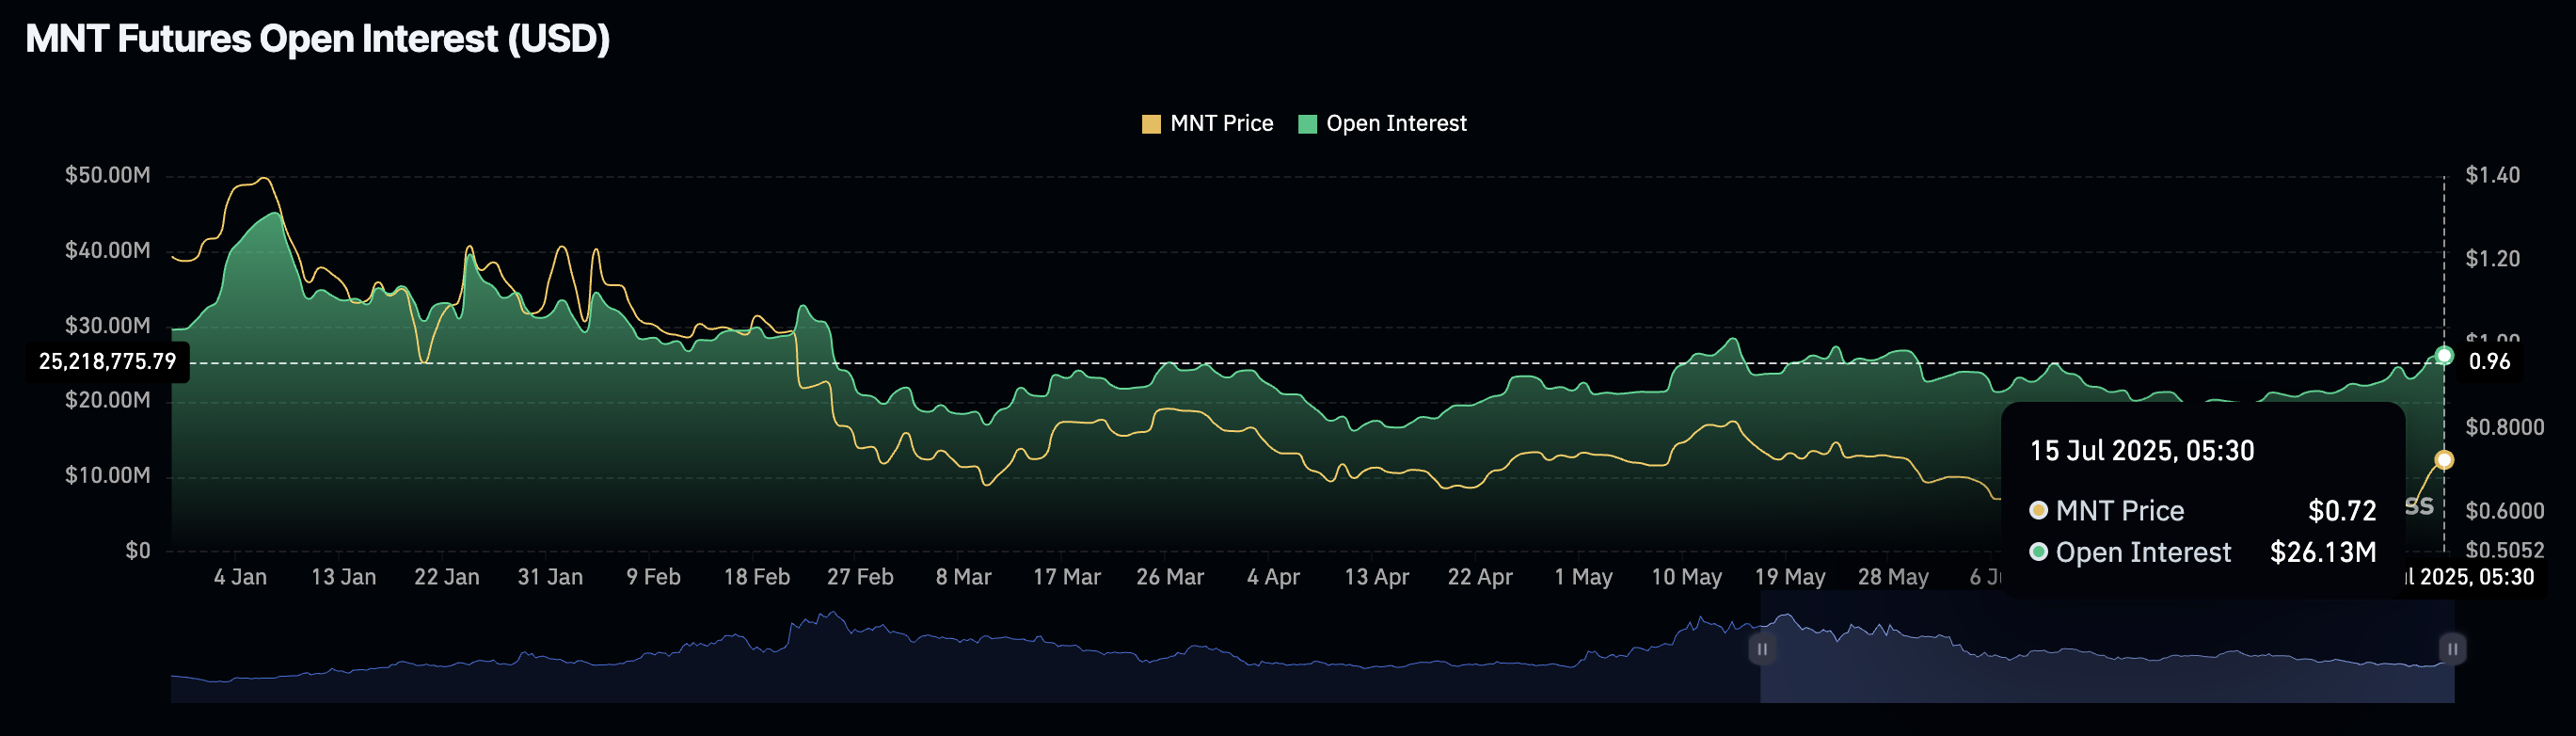
(Source: Coinglass)
The bullish market of MNT faces critical dynamic resistance
FXStreet analyst Vishal Dixit stated that the trading price of MNT is between the 100-day and 200-day EMA, at 0.6869 USD and 0.7485 USD, while maintaining dominance above the 23.6% Fibonacci retracement level of 0.6903 USD, which is situated between the January 6 high of 1.418 and the low of the day.
As shown in the daily chart below, the downward wedge breakout of Mantle aims to break through the 200-day MA. If the closing price decisively breaks through the dynamic resistance level, it may extend the upward trend to the 50% Fibonacci level of 0.8856 USDT.
The Relative Strength Index (RSI) on the daily chart is 69, slightly below the overbought area, indicating increased buying pressure.
The convergence/divergence of the Moving Average (MACD) indicator shows an upward trend in the green histogram above the zero line, indicating a strengthening bullish momentum. Additionally, the upward trend of the MACD and its signal line crossing into the positive territory suggests a trend reversal.
If MNT reverses from the 200-day EMA, it may retest the 23.6% Fibonacci level at $0.6903.
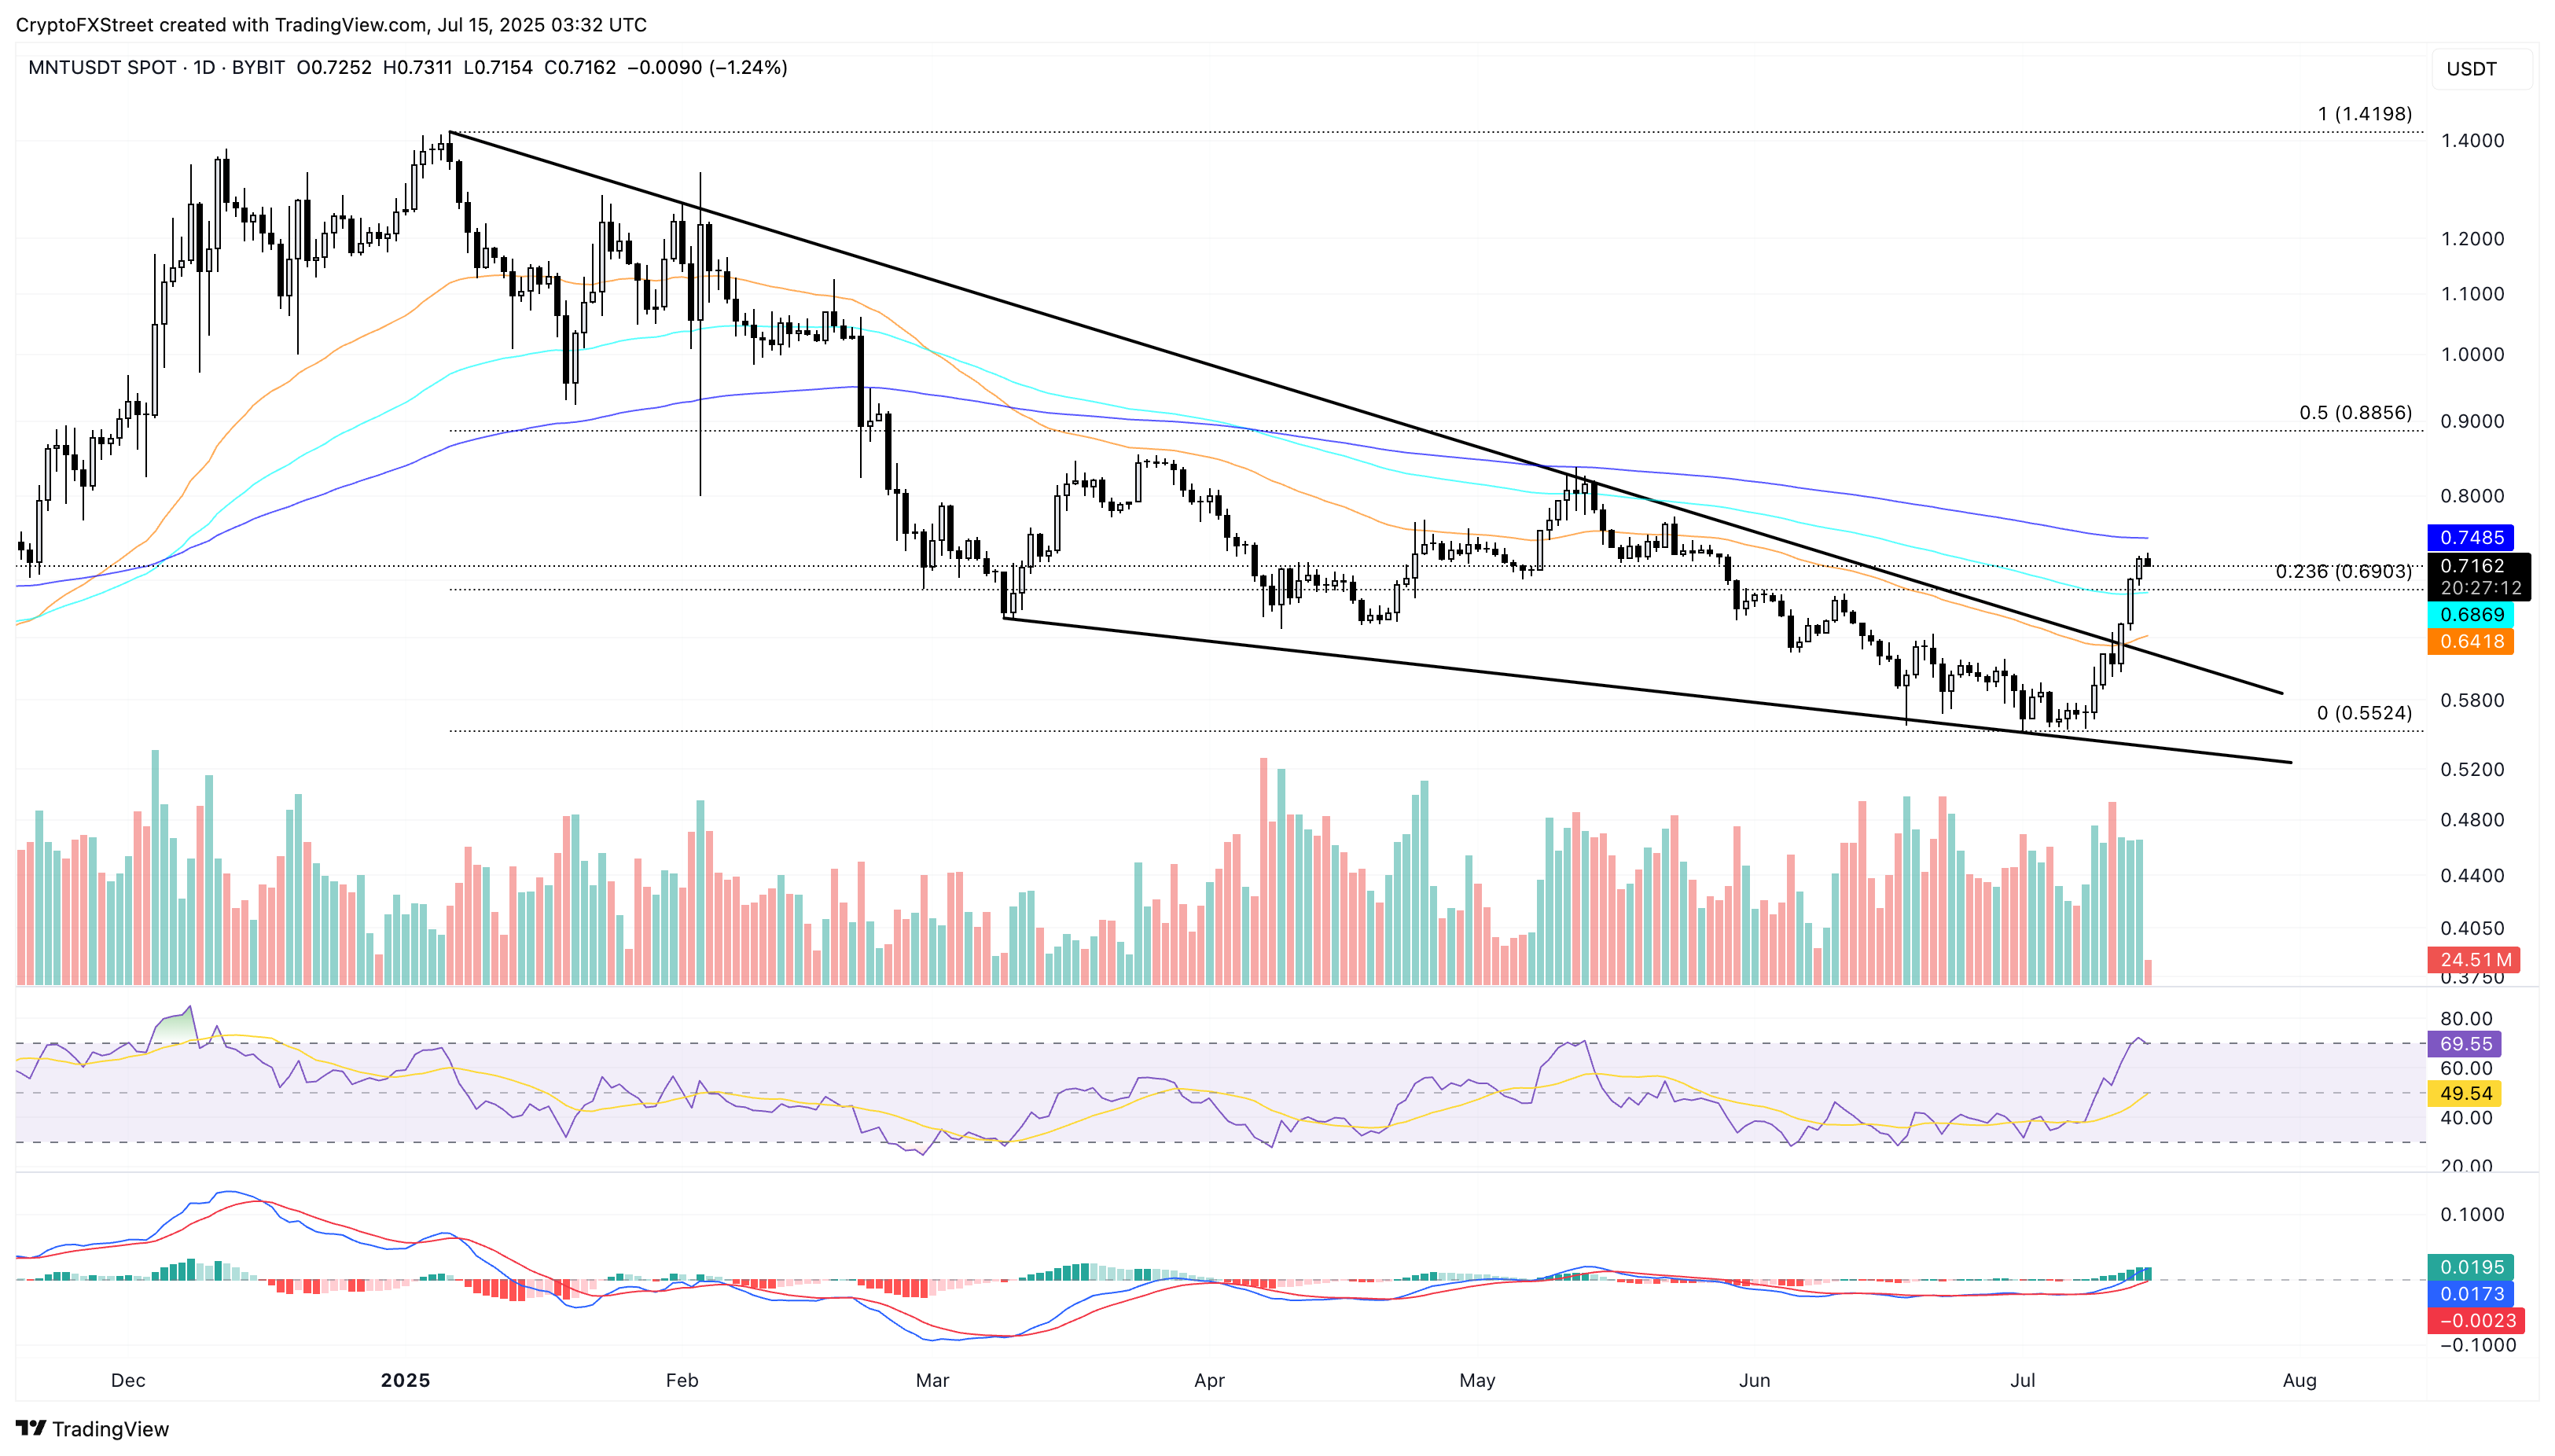
(Source: Trading View)
Disclaimer: The information on this page may come from third parties and does not represent the views or opinions of Gate. The content displayed on this page is for reference only and does not constitute any financial, investment, or legal advice. Gate does not guarantee the accuracy or completeness of the information and shall not be liable for any losses arising from the use of this information. Virtual asset investments carry high risks and are subject to significant price volatility. You may lose all of your invested principal. Please fully understand the relevant risks and make prudent decisions based on your own financial situation and risk tolerance. For details, please refer to
Disclaimer.