Although Solana (SOL) has not recorded much price volatility recently, it is witnessing a large accumulation level from investors. In May, the price of SOL remained relatively stable, largely due to the overbought status of this altcoin in the previous period.
Although this stagnation may reflect the cautious sentiment of investors, the market still maintains an optimistic attitude, which could open up the potential for price appreciation for Solana in the near future.
Investors are still quietly “accumulating”
In the past 10 days, the amount of SOL on exchanges has decreased by about 2.2 million SOL, equivalent to 381 million USD. This decline indicates that investors are continuously withdrawing SOL from the exchange, aiming for accumulation rather than trading.
This wave of accumulation may stem from several factors such as: the overall market sentiment being positive, the FOMO effect, and expectations of price increases in the near future.
The gradual decrease in supply on exchanges indicates that investor confidence is improving, with many choosing to hold long-term rather than sell. If this trend continues, demand pressure will surpass supply, creating momentum to push prices up in the medium term.
 Chart of SOL volume on the exchange | Source: Glassnode## Technical indicators signal upcoming volatility
The overall momentum of Solana is showing the potential for strong volatility. According to technical indicators such as the Bollinger Bands (Bollinger Bands), the range of fluctuations is gradually narrowing - this is a classic sign that the market may be about to “consolidate” before exploding.
If this round of price tightening leads to a breakout in the upward direction, Solana could witness a strong price increase, especially in the context of the overall market showing positive trends.
However, it is also important to note that the narrowing of the Bollinger Bands may signal a period of Accumulation or sideways movement before the price makes its next strong move.
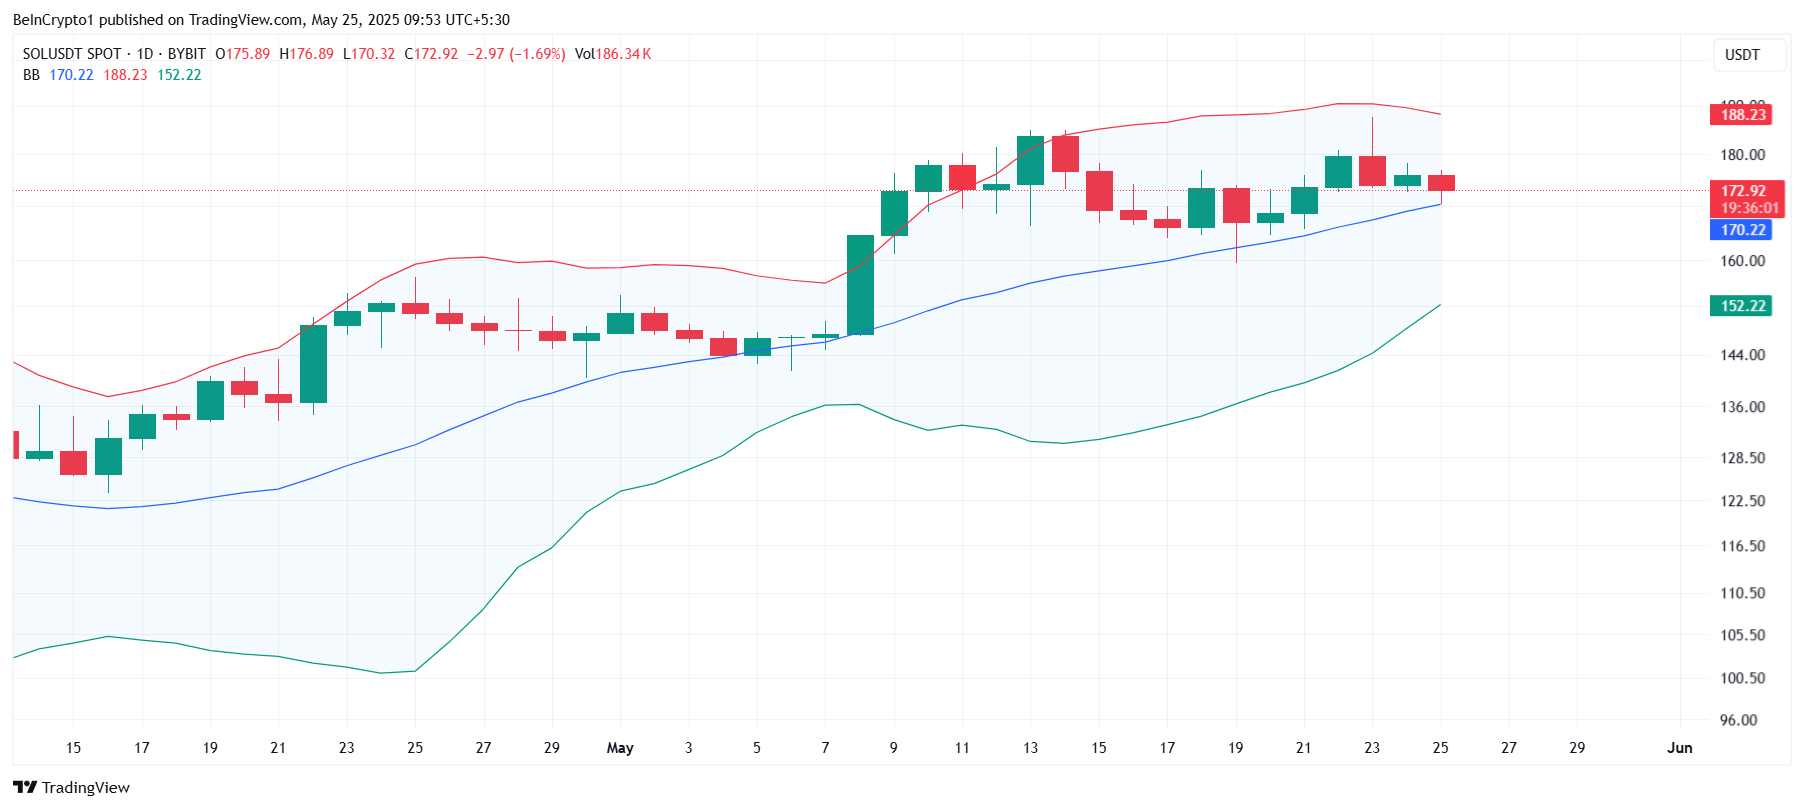 Bollinger Bands chart of Solana | Source: TradingView## SOL needs to break out to establish an upward trend
For most of May, the price of Solana has been stagnant – likely due to the previous hot surge causing the market to need time to “cool off”. However, this correction phase could create an opportunity for SOL to re-establish its upward momentum.
Currently, according to data from Bitcoin Magazine, Solana is trading around 173 USD, near an important support zone. To form an upward trend, SOL needs to break above the 178 USD mark and turn this into a support zone. If this altcoin surpasses the 180 USD mark and especially breaks the 188 USD threshold, it will be a signal confirming the established upward momentum.
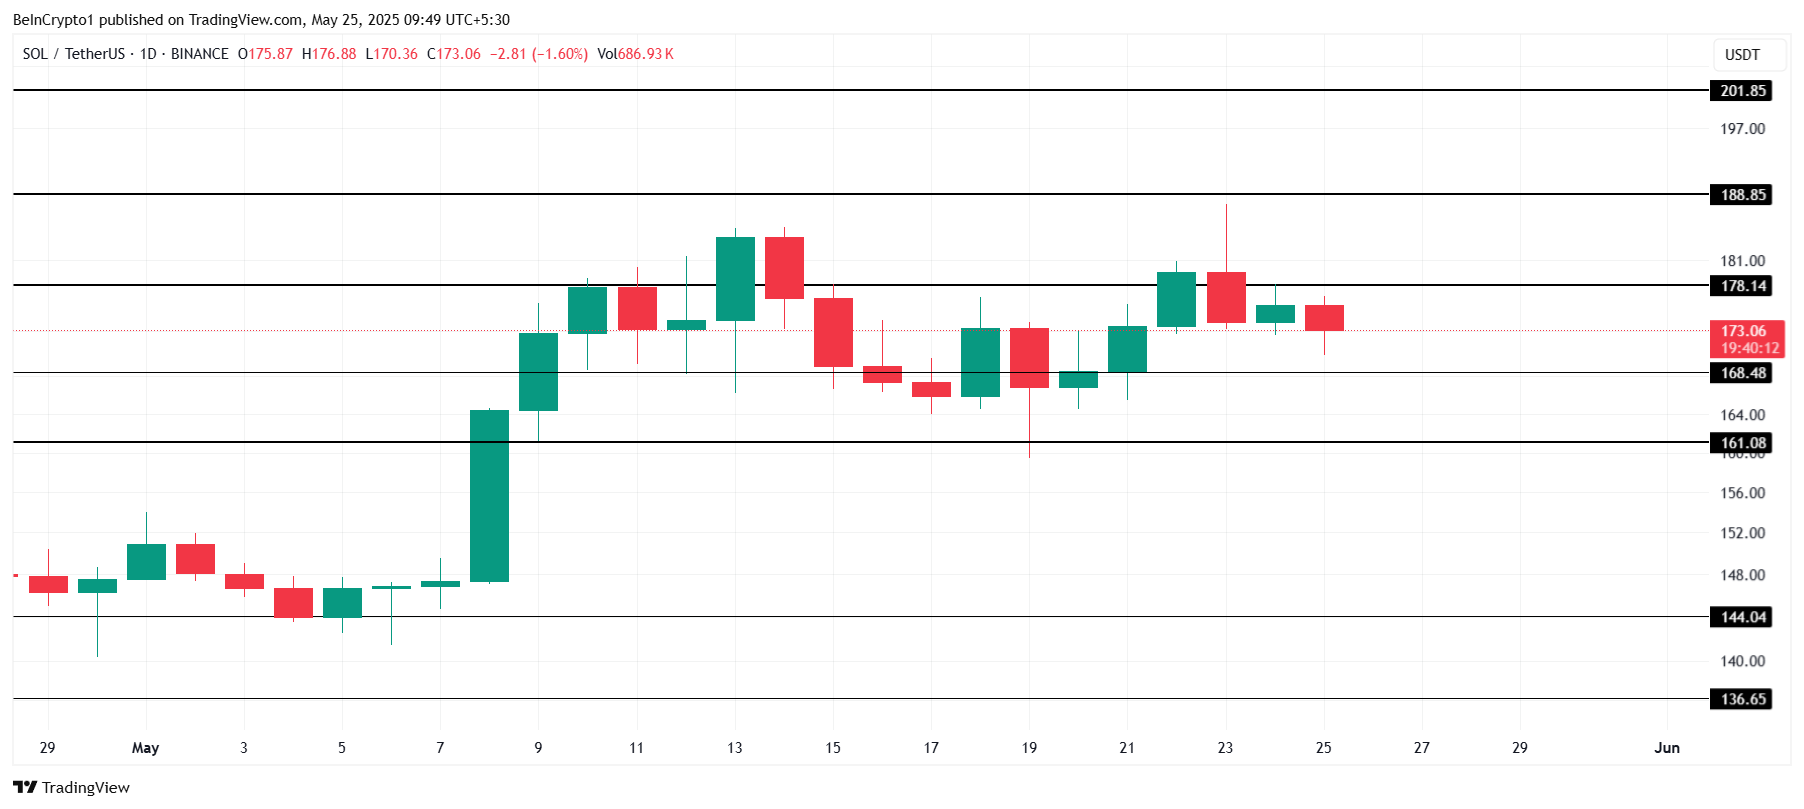 SOL price analysis chart | Source: TradingViewConversely, if the area of 178 USD cannot be maintained, the price of SOL may drop below 168 USD, and even to 161 USD – a scenario that could negate the bullish trend and bring the risk of deeper correction back.
Justin
Disclaimer: The information on this page may come from third parties and does not represent the views or opinions of Gate. The content displayed on this page is for reference only and does not constitute any financial, investment, or legal advice. Gate does not guarantee the accuracy or completeness of the information and shall not be liable for any losses arising from the use of this information. Virtual asset investments carry high risks and are subject to significant price volatility. You may lose all of your invested principal. Please fully understand the relevant risks and make prudent decisions based on your own financial situation and risk tolerance. For details, please refer to
Disclaimer.
