MYRIA vs ENJ: 2023 yılında iki lider oyun blockchain platformunun karşılaştırılması

Giriş: MYRIA ve ENJ Yatırım Karşılaştırması
Kripto para piyasasında Myria ve Enjin Coin arasındaki karşılaştırma, yatırımcıların gündeminde önemli bir yer tutmaktadır. Bu iki varlık, piyasa değeri sıralaması, kullanım alanları ve fiyat performansı bakımından büyük farklılıklar gösterirken, kripto varlık ekosisteminde farklı konumlar üstlenmektedir.
Myria (MYRIA): 2023 yılında piyasaya sürülen MYRIA, özellikle oyun sektörü için geliştirilmiş Ethereum Layer 2 ölçeklenme çözümüyle piyasa tarafından hızla benimsenmiştir.
Enjin Coin (ENJ): 2017'den bu yana varlığını sürdüren ENJ, dünyanın en büyük online oyun topluluğu oluşturma platformu olarak anılmakta ve küresel ölçekte yüksek işlem hacmi ile güçlü bir piyasa değerine sahiptir.
Bu makale, Myria ve Enjin Coin’in yatırım değerini kapsamlı biçimde analiz edecek; tarihsel fiyat eğilimleri, arz mekanizmaları, kurumsal benimsenme, teknolojik ekosistemler ve gelecek öngörüleri üzerinden yatırımcıların en çok merak ettiği şu soruya yanıt arayacaktır:
"Şu anda hangisi daha avantajlı bir yatırım?"
I. Fiyat Geçmişi Karşılaştırması ve Mevcut Piyasa Durumu
MYRIA ve ENJ Tarihsel Fiyat Eğilimleri
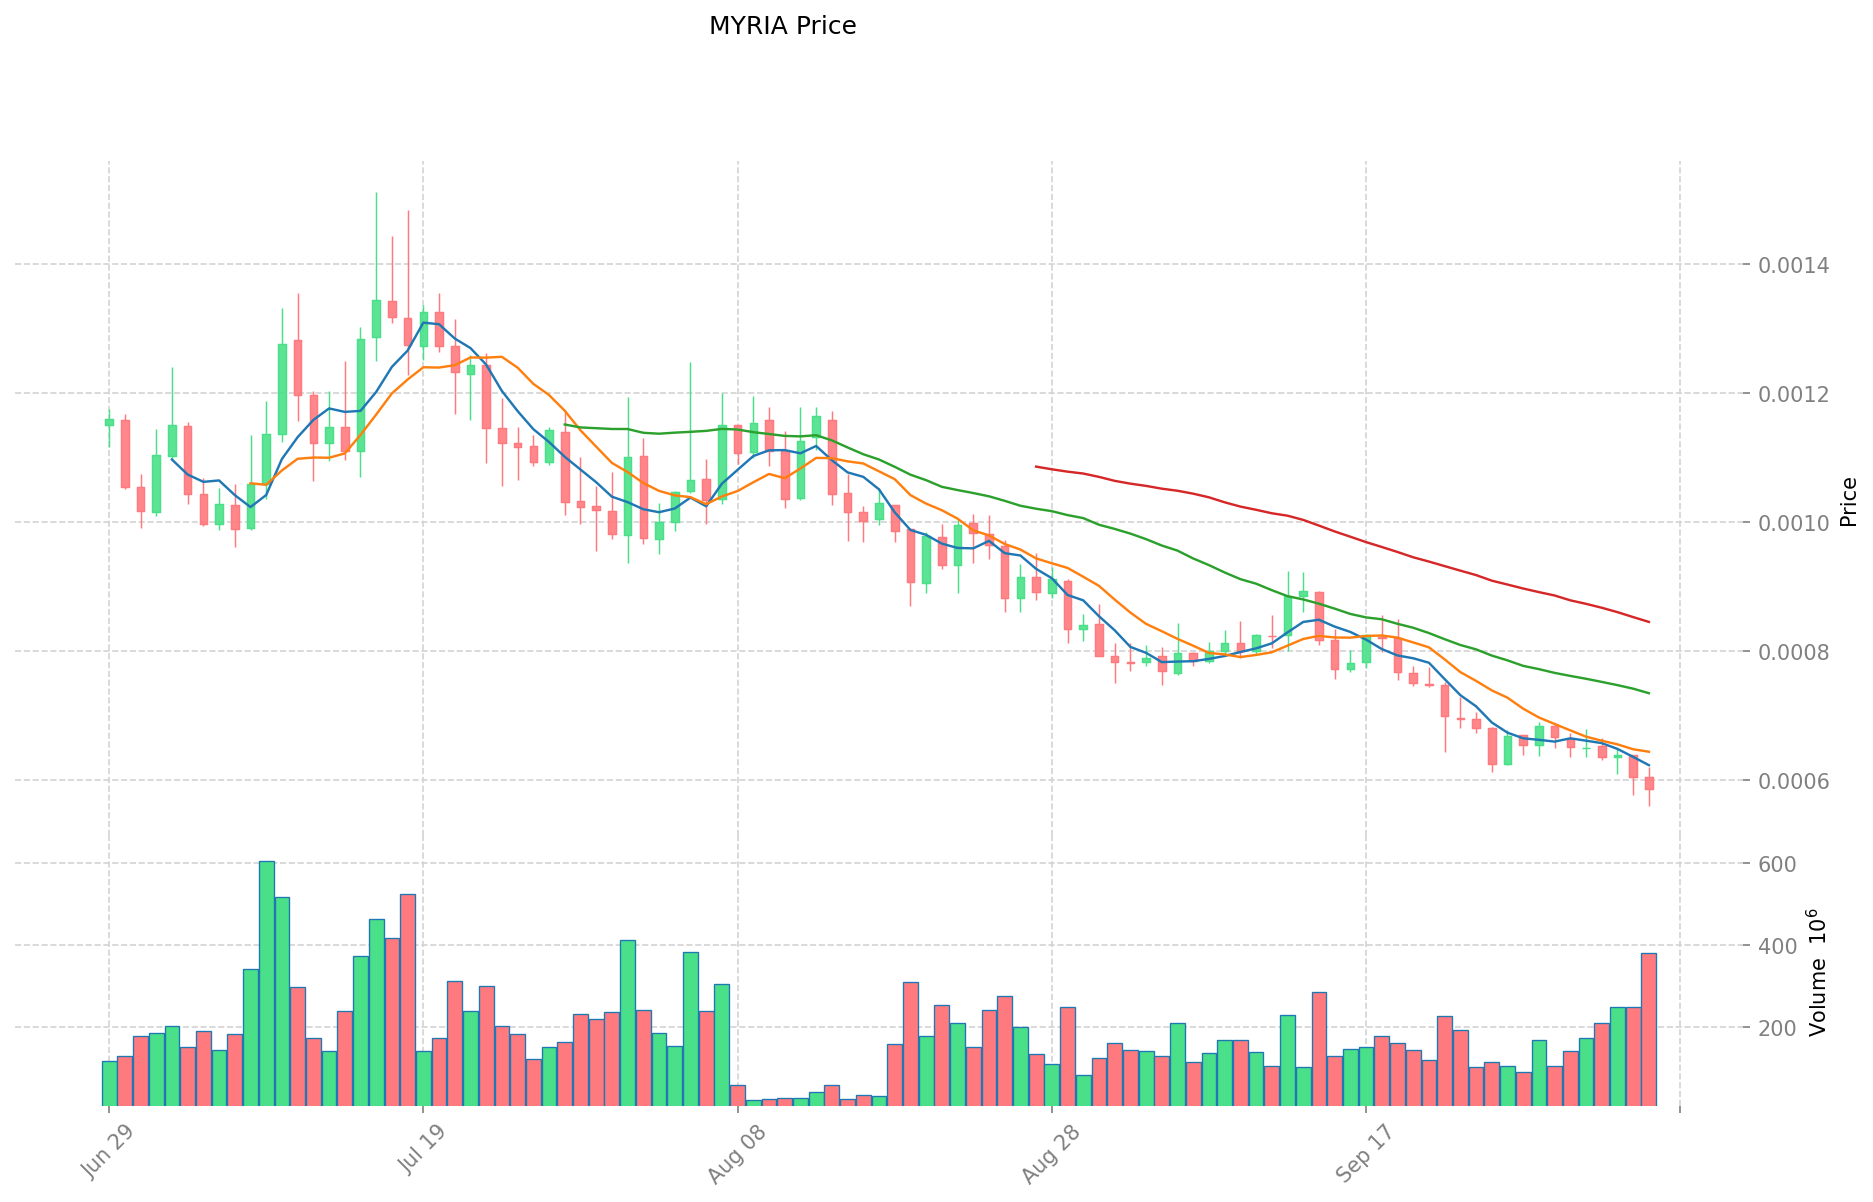
- 2023: MYRIA, 14 Aralık 2023'te $0,018239 ile tüm zamanların en yüksek seviyesini gördü.
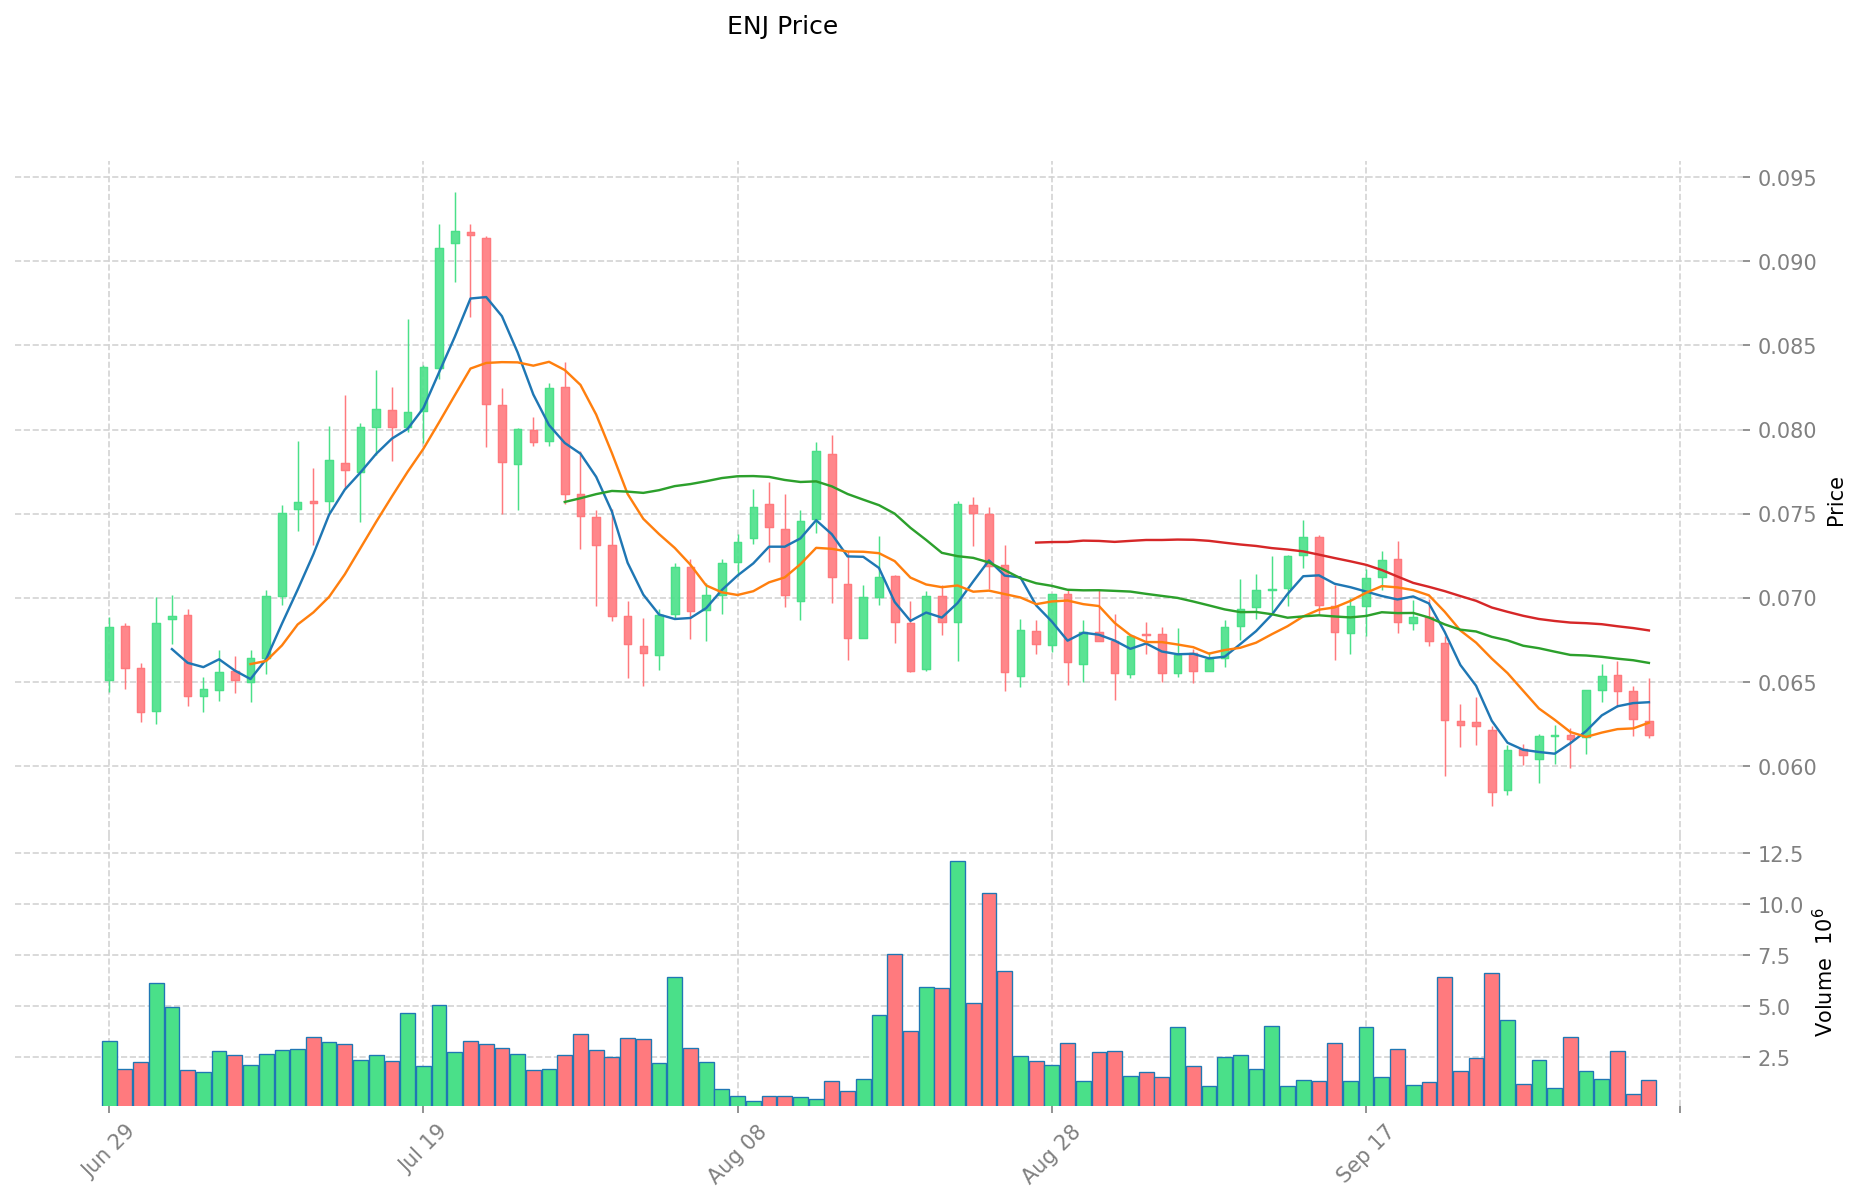
- 2021: ENJ, boğa piyasasında 25 Kasım 2021'de $4,82 ile zirve yaptı.
- Karşılaştırmalı analiz: Son piyasa döngüsünde MYRIA, $0,018239 seviyesinden $0,0005572'ye inerken, ENJ de $4,82'den mevcut seviyesine geriledi.
Mevcut Piyasa Durumu (06 Ekim 2025)
- MYRIA güncel fiyatı: $0,0005864
- ENJ güncel fiyatı: $0,06235
- 24 saatlik işlem hacmi: MYRIA $227.147,81 | ENJ $87.877,63
- Piyasa Duyarlılık Endeksi (Korku & Açgözlülük Endeksi): 74 (Açgözlülük)
Canlı fiyatları görüntülemek için tıklayın:
- MYRIA güncel fiyatı Piyasa Fiyatı
- ENJ güncel fiyatı Piyasa Fiyatı
II. MYRIA ve ENJ Yatırım Değerini Etkileyen Temel Faktörler
Arz Mekanizması Karşılaştırması (Tokenomics)
- ENJ: Güncel piyasa değeri NT$3,59 milyar, fiyatı NT$1,94
- MYRIA: Belirli arz verisi mevcut değil
- 📌 Tarihsel örüntü: Arz mekanizmaları fiyat döngülerini şekillendirir; ancak mevcut bilgilerde tarihsel veri bulunmamaktadır.
Kurumsal Benimsenme ve Piyasa Uygulamaları
- Kurumsal portföyler: Mevcut verilerde bilgi bulunmamaktadır
- Kurumsal benimsenme: Spesifik uygulamalar hakkında sınırlı bilgi mevcut
- Düzenleyici politikalar: Her iki token için de özel regülasyon bilgisi yoktur
Teknolojik Gelişim ve Ekosistem İnşası
- ENJ teknolojisi: Son teknik geliştirmeler hakkında yeterli bilgi yok
- MYRIA teknolojisi: Geliştirme yol haritasına dair sınırlı bilgi var
- Ekosistem karşılaştırması: DeFi, NFT, ödeme veya akıllı kontrat uygulamalarına dair veri mevcut değil
Makroekonomik Faktörler ve Piyasa Döngüleri
- Enflasyon ortamında performans: Bilgi verilmemiştir
- Makroekonomik para politikaları: Faiz oranları ve USD endeksinin etkisiyle ilgili veri yok
- Jeopolitik faktörler: Sınır ötesi işlem talepleri veya uluslararası koşullara dair bilgi yok
III. 2025-2030 Fiyat Tahmini: MYRIA vs ENJ
Kısa Vadeli Tahmin (2025)
- MYRIA: Muhafazakar $0,000334305 - $0,0005865 | İyimser $0,0005865 - $0,00080937
- ENJ: Muhafazakar $0,0408936 - $0,06196 | İyimser $0,06196 - $0,0848852
Orta Vadeli Tahmin (2027)
- MYRIA, büyüme evresine girebilir; tahmini fiyat aralığı $0,0006552911715 - $0,001150755228
- ENJ, istikrarlı büyüme fazına geçebilir; tahmini fiyat aralığı $0,04399482192 - $0,09977397114
- Başlıca itici güçler: Kurumsal sermaye girişi, ETF, ekosistem gelişimi
Uzun Vadeli Tahmin (2030)
- MYRIA: Temel senaryo $0,000855244042467 - $0,001379425874947 | İyimser senaryo $0,001379425874947 - $0,002000167518673
- ENJ: Temel senaryo $0,104282422220921 - $0,113350458935784 | İyimser senaryo $0,113350458935784 - $0,13602055072294
Yasal Uyarı: Yukarıdaki tahminler geçmiş veriler ve piyasa analizlerine dayanmaktadır. Kripto para piyasaları yüksek seviyede dalgalanma gösterir ve öngörülemeyen birçok faktör tarafından etkilenebilir. Bu öngörüler yatırım tavsiyesi değildir. Yatırım kararlarınızı almadan önce kendi araştırmanızı yapın.
MYRIA:
| Yıl | Tahmini En Yüksek Fiyat | Tahmini Ortalama Fiyat | Tahmini En Düşük Fiyat | Değişim Oranı |
|---|---|---|---|---|
| 2025 | 0,00080937 | 0,0005865 | 0,000334305 | 0 |
| 2026 | 0,00090033615 | 0,000697935 | 0,0006141828 | 19 |
| 2027 | 0,001150755228 | 0,000799135575 | 0,0006552911715 | 36 |
| 2028 | 0,001277178475965 | 0,0009749454015 | 0,000614215602945 | 66 |
| 2029 | 0,001632789811162 | 0,001126061938732 | 0,000900849550986 | 92 |
| 2030 | 0,002000167518673 | 0,001379425874947 | 0,000855244042467 | 135 |
ENJ:
| Yıl | Tahmini En Yüksek Fiyat | Tahmini Ortalama Fiyat | Tahmini En Düşük Fiyat | Değişim Oranı |
|---|---|---|---|---|
| 2025 | 0,0848852 | 0,06196 | 0,0408936 | 0 |
| 2026 | 0,083701764 | 0,0734226 | 0,038913978 | 17 |
| 2027 | 0,09977397114 | 0,078562182 | 0,04399482192 | 26 |
| 2028 | 0,1132434572439 | 0,08916807657 | 0,0561758882391 | 43 |
| 2029 | 0,125495150964618 | 0,10120576690695 | 0,052626998791614 | 62 |
| 2030 | 0,13602055072294 | 0,113350458935784 | 0,104282422220921 | 81 |
IV. Yatırım Stratejisi Karşılaştırması: MYRIA vs ENJ
Uzun Vadeli ve Kısa Vadeli Yatırım Stratejileri
- MYRIA: Oyun ekosistemleri ve Layer 2 çözümlerine odaklanan yatırımcılar için uygun bir seçenek
- ENJ: Kurulmuş oyun platformları ve NFT uygulamalarına ilgi duyan yatırımcılar için ideal
Risk Yönetimi ve Varlık Dağılımı
- Temkinli yatırımcılar: MYRIA %20 | ENJ %80
- Agresif yatırımcılar: MYRIA %60 | ENJ %40
- Koruma araçları: Stablecoin portföyü, opsiyonlar, çapraz para sepetleri
V. Potansiyel Risk Karşılaştırması
Piyasa Riski
- MYRIA: Düşük piyasa değeri ve işlem hacmi nedeniyle yüksek volatilite
- ENJ: Nispeten daha istikrarlı, ancak genel kripto piyasası hareketlerinden etkilenir
Teknik Risk
- MYRIA: Ölçeklenebilirlik ve ağ istikrarı riskleri
- ENJ: Akıllı kontrat zafiyetleri ve ekosistem bağımlılıkları
Düzenleyici Risk
- Küresel regülasyonlar, her iki token üzerinde farklı etkiler gösterebilir ve oyun bağlantılı kripto varlıklarda ek riskler oluşturabilir
VI. Sonuç: Hangisi Daha Avantajlı Bir Alım?
📌 Yatırım Değeri Özeti:
- MYRIA’nın avantajları: Oyun için gelişen Layer 2 çözümü, büyüme potansiyeli
- ENJ’nin avantajları: Oyun ve NFT pazarında köklü varlık, geniş ekosistem
✅ Yatırım Tavsiyesi:
- Yeni yatırımcılar: MYRIA’ya küçük, ENJ’ye büyük pozisyon ayırmalı
- Deneyimli yatırımcılar: Risk toleransına göre iki token arasında dengeli dağılım tercih etmeli
- Kurumsal yatırımcılar: Her iki projeyi detaylı şekilde incelemeli ve uzun vadeli ekosistem gelişimi ile benimsenme oranlarına odaklanmalı
⚠️ Risk Uyarısı: Kripto para piyasası yüksek volatilite taşır. Bu makale yatırım tavsiyesi değildir. None
VII. Sıkça Sorulan Sorular
S1: MYRIA ve ENJ arasındaki temel farklar nelerdir? C: MYRIA, 2023’te piyasaya sürülen ve oyun odaklı Ethereum Layer 2 çözümlerine yönelen yeni bir projedir; ENJ ise 2017’den beri faaliyette olan, köklü bir online oyun topluluğu kurma platformudur. ENJ, MYRIA’ya göre daha büyük piyasa değeri ve işlem hacmine sahiptir.
S2: Tarihsel olarak hangi token daha iyi performans göstermiştir? C: Mevcut verilere göre ENJ, Kasım 2021’de $4,82 ile daha yüksek bir zirve yakalamıştır; MYRIA ise Aralık 2023’te $0,018239 ile en yüksek seviyesine ulaşmıştır. Her iki token da zirvelerinden sonra ciddi değer kayıpları yaşamıştır.
S3: MYRIA ve ENJ’nin güncel fiyatları ve piyasa duyarlılığı nedir? C: 06 Ekim 2025 itibarıyla MYRIA’nın fiyatı $0,0005864, ENJ’nin fiyatı ise $0,06235’tir. Piyasa duyarlılık endeksi (Korku & Açgözlülük Endeksi) 74 olup "Açgözlülük" seviyesindedir.
S4: MYRIA ve ENJ için ileriye dönük fiyat tahminleri nasıl? C: 2030 senaryosunda MYRIA için baz aralık $0,000855244042467 - $0,001379425874947 olurken, ENJ için $0,104282422220921 - $0,113350458935784 aralığı öngörülüyor. ENJ mutlak değer olarak daha yüksek fiyat öngörüsüne sahip olsa da MYRIA daha yüksek oransal büyüme potansiyeli sunmaktadır.
S5: MYRIA ve ENJ yatırımlarında başlıca riskler nelerdir? C: MYRIA, düşük piyasa değeri ve işlem hacmi nedeniyle yüksek volatilite, ölçeklenebilirlik ve ağ istikrarı riskleri ile karşılaşabilir. ENJ ise teknik açıklar ve ekosistem bağımlılıkları açısından risk taşır. Her iki token, oyun temalı kripto varlıkları etkileyen düzenleyici risklere tabidir.
S6: MYRIA ve ENJ arasında yatırım dağılımı nasıl yapılmalı? C: Temkinli yatırımcılar MYRIA’ya %20, ENJ’ye %80; agresif yatırımcılar ise MYRIA’ya %60, ENJ’ye %40 oranında yatırım yapabilir. Yeni yatırımcılar ENJ’de daha büyük pozisyon almalı, deneyimli yatırımcılar ise daha dengeli bir portföy oluşturmalıdır.
Share
How to Buy Cryptocurrency


Trending Cryptocurrencies


2025 APT Fiyat Tahmini: Aptos Token’ı Yeni Zirvelere Taşıyabilecek Temel Dinamikler
2025 KAS Fiyat Öngörüsü: Kaspa'nın Gelecekteki Değerini Etkileyen Başlıca Faktörlerin Derinlemesine Analizi

2025 MOVE Fiyat Tahmini: Gelişen kripto para ekosisteminde büyüme faktörleri ve piyasa trendlerinin analizi
2025 SAGA Fiyat Tahmini: Gelişen Blockchain Ekosisteminde Piyasa Trendleri ve Büyüme Potansiyelinin Analizi

KARRAT vs ADA: Doğal dil anlama ve üretimi alanında öne çıkan iki yapay zekâ modelinin karşılaştırılması
