Trade
Trading Type
Spot
Trade crypto freely
Alpha
Points
Get promising tokens in streamlined on-chain trading
Pre-Market
Trade new tokens before they are officially listed
Margin
Magnify your profit with leverage
Convert & Block Trading
0 Fees
Trade any size with no fees and no slippage
Leveraged Tokens
Get exposure to leveraged positions simply
Futures
Futures
Hundreds of contracts settled in USDT or BTC
Options
HOT
Trade European-style vanilla options
Unified Account
Maximize your capital efficiency
Demo Trading
Futures Kickoff
Get prepared for your futures trading
Futures Events
Participate in events to win generous rewards
Demo Trading
Use virtual funds to experience risk-free trading
Earn
Launch
Investment
Simple Earn
VIP
Earn interests with idle tokens
Auto-Invest
Auto-invest on a regular basis
Dual Investment
Buy low and sell high to take profits from price fluctuations
Quant Fund
VIP
Top asset management team helps you profit without hassle
Crypto Loan
0 Fees
Pledge one crypto to borrow another
Lending Center
One-Stop Lending Hub
VIP Wealth Hub
New
Customized wealth management empowers your assets growth
Staking
Stake cryptos to earn in PoS products
BTC Staking
HOT
Stake BTC and earn 10% APR
ETH Staking
HOT
Stake ETH and earn 6% APR
GUSD Minting
New
Use USDT/USDC to mint GUSD for treasury-level yields
Soft Staking
Earn rewards with flexible staking
More


LuShiAnalysis
No content yet
LuShiAnalysis
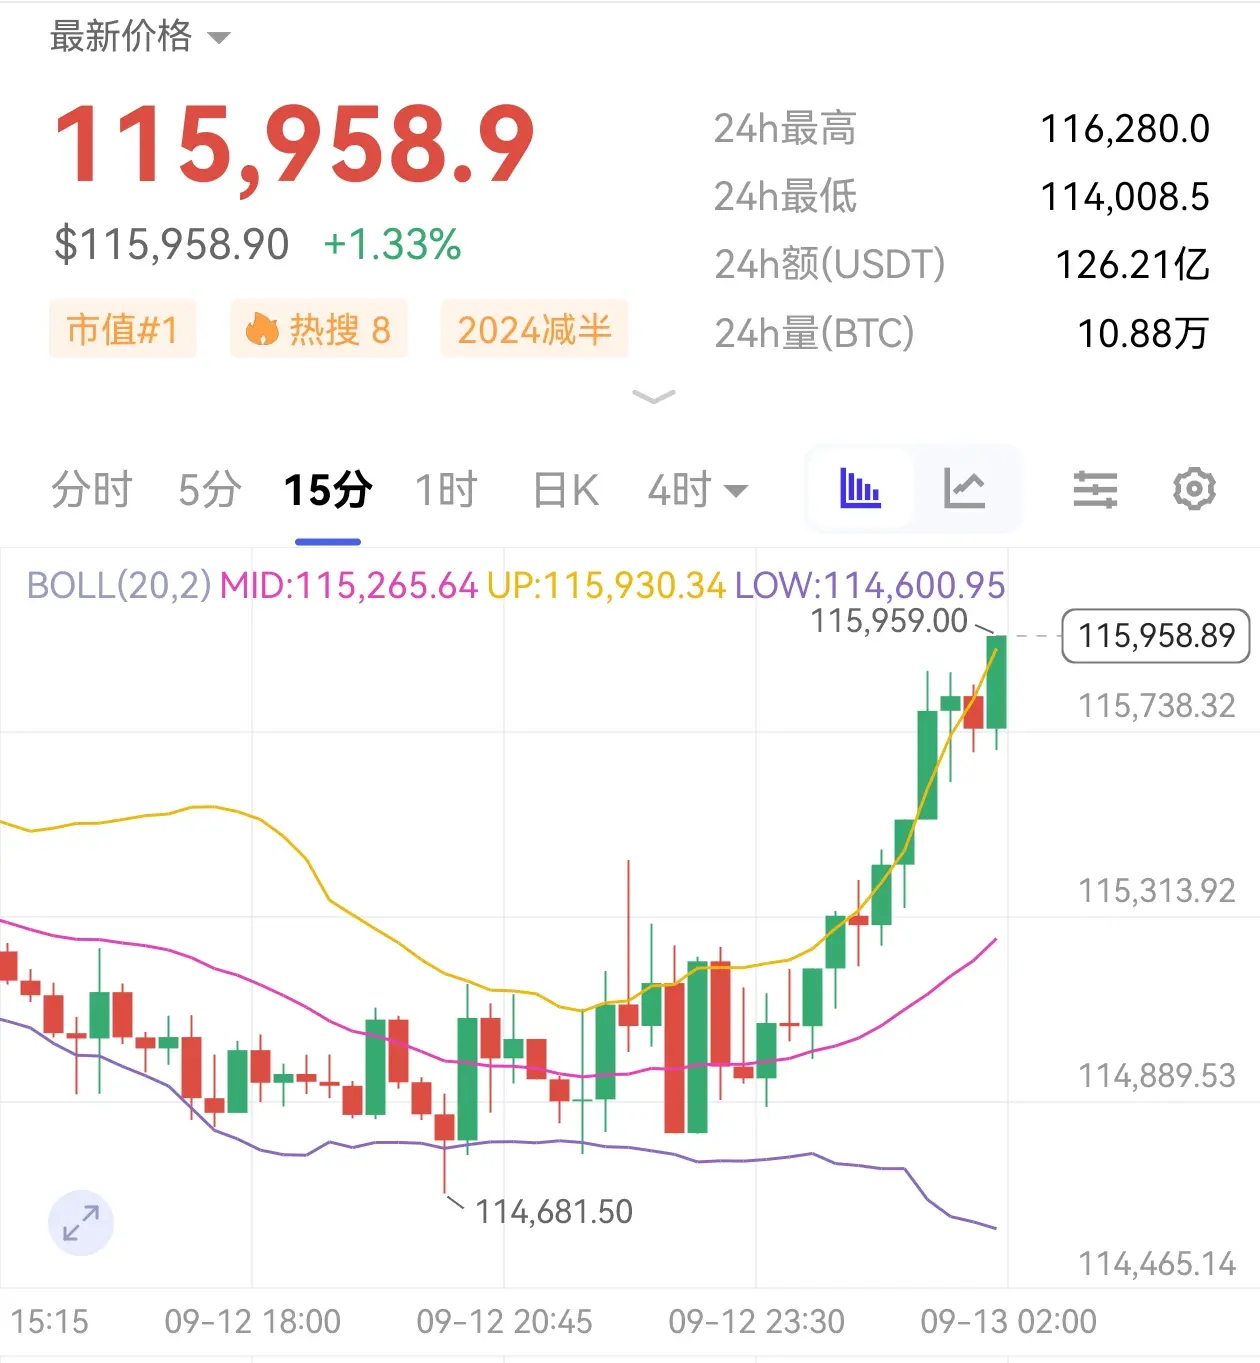
Market Analysis for September 13
Recently, the market has gradually warmed up, with the increase in Bitcoin and Ethereum exceeding expectations. Bitcoin reached a maximum of the 1166 area, while Ethereum approached 4770. In just two days, short-selling investors have suffered significant losses.
From the market perspective, Bitcoin and Ethereum faced pressure and retreated after reaching highs during the early morning hours. In the short term, caution is needed regarding the risk of chasing prices, and market fluctuations over the weekend are typically limited. Therefore, it is recommended
View Original
Recently, the market has gradually warmed up, with the increase in Bitcoin and Ethereum exceeding expectations. Bitcoin reached a maximum of the 1166 area, while Ethereum approached 4770. In just two days, short-selling investors have suffered significant losses.
From the market perspective, Bitcoin and Ethereum faced pressure and retreated after reaching highs during the early morning hours. In the short term, caution is needed regarding the risk of chasing prices, and market fluctuations over the weekend are typically limited. Therefore, it is recommended
- Reward
- like
- Comment
- Repost
- Share
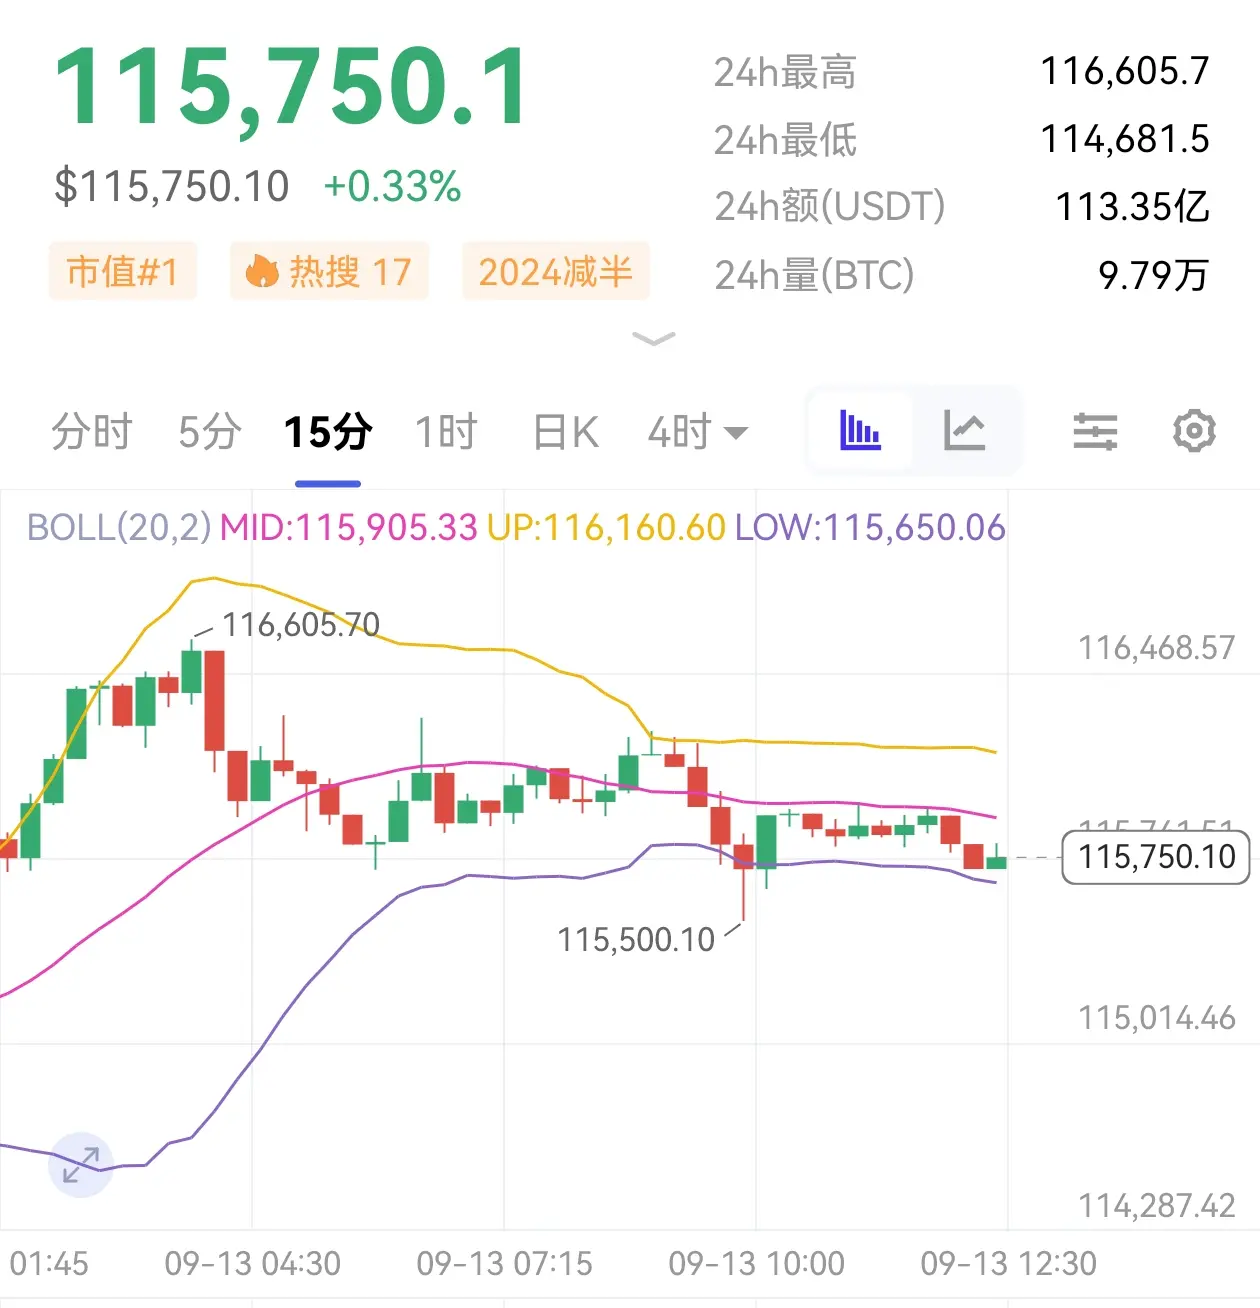
Interpretation at 9:13 AM
The current long and short game of Bitcoin continues, but the market fluctuations at night are easing, and the range of ups and downs is narrowing in a short time.
From the perspective of short-term situations, the Bitcoin Bollinger Bands maintain an upward extension, with the K-line stabilizing in the upper band area; although the MACD energy bars show a bullish trend, the volume strength is relatively weak, and the fast and slow lines are running steadily at high levels. Overall, it is expected that after Bitcoin rises to around 116,300, it will face a wave of p
View Original
The current long and short game of Bitcoin continues, but the market fluctuations at night are easing, and the range of ups and downs is narrowing in a short time.
From the perspective of short-term situations, the Bitcoin Bollinger Bands maintain an upward extension, with the K-line stabilizing in the upper band area; although the MACD energy bars show a bullish trend, the volume strength is relatively weak, and the fast and slow lines are running steadily at high levels. Overall, it is expected that after Bitcoin rises to around 116,300, it will face a wave of p
- Reward
- like
- Comment
- Repost
- Share
- Reward
- like
- Comment
- Repost
- Share
At 8:30 PM tonight, the United States will release significant economic data, which will have a notable impact on the encryption market and is likely to trigger significant fluctuations.
The U.S. economic data has always been closely related to the encryption market trends. After the data is released, whether good or bad, it can lead to significant fluctuations in cryptocurrency prices.
After the data is released, you need to closely monitor the market. The position should not be too full, and stop-loss must be set properly. The current market is prone to "jumping around"; therefore, prope
View OriginalThe U.S. economic data has always been closely related to the encryption market trends. After the data is released, whether good or bad, it can lead to significant fluctuations in cryptocurrency prices.
After the data is released, you need to closely monitor the market. The position should not be too full, and stop-loss must be set properly. The current market is prone to "jumping around"; therefore, prope

- Reward
- like
- Comment
- Repost
- Share
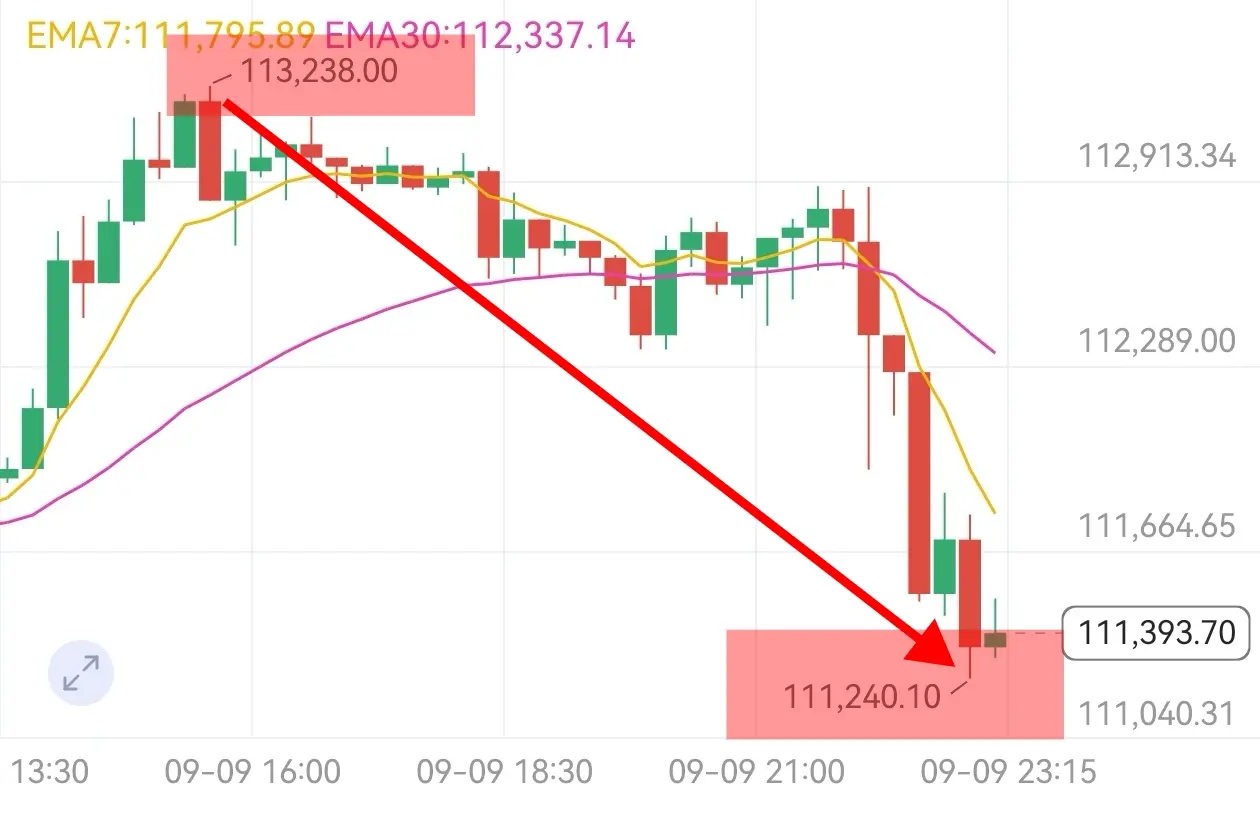
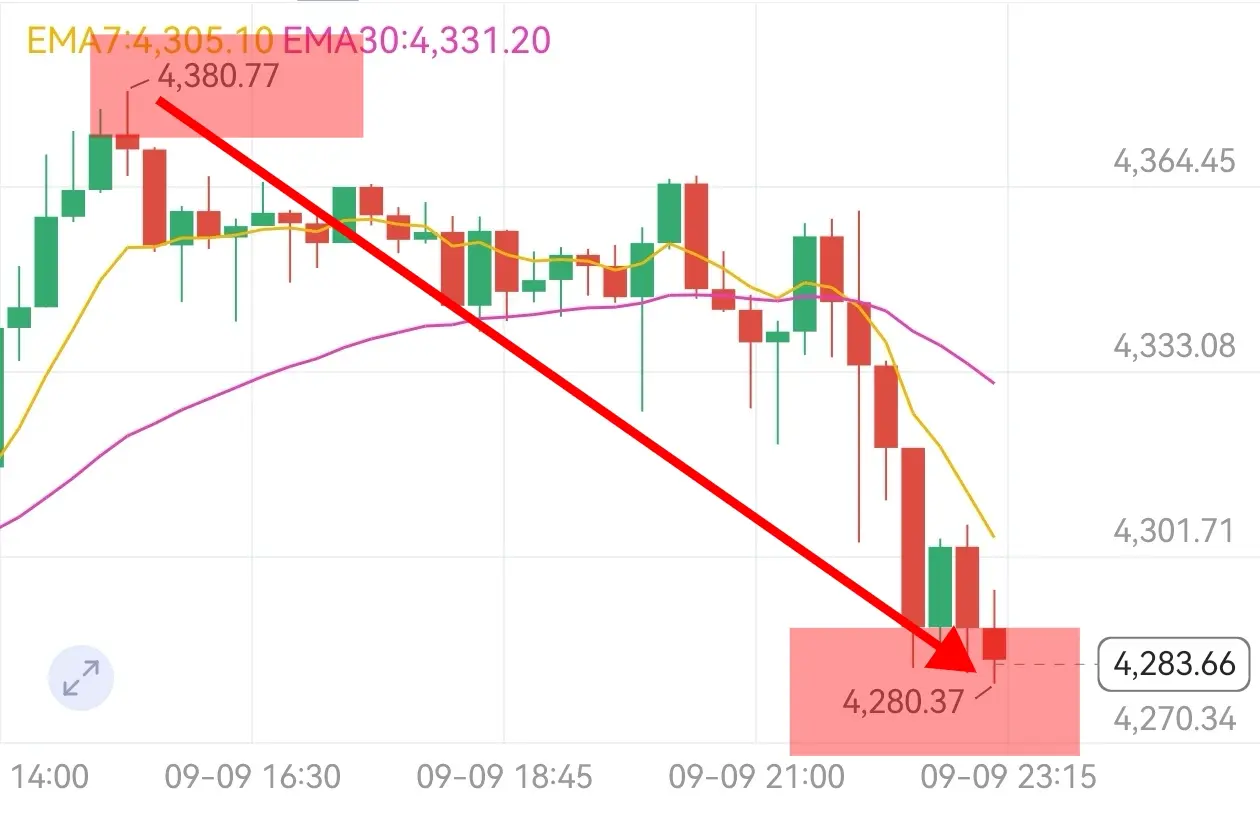
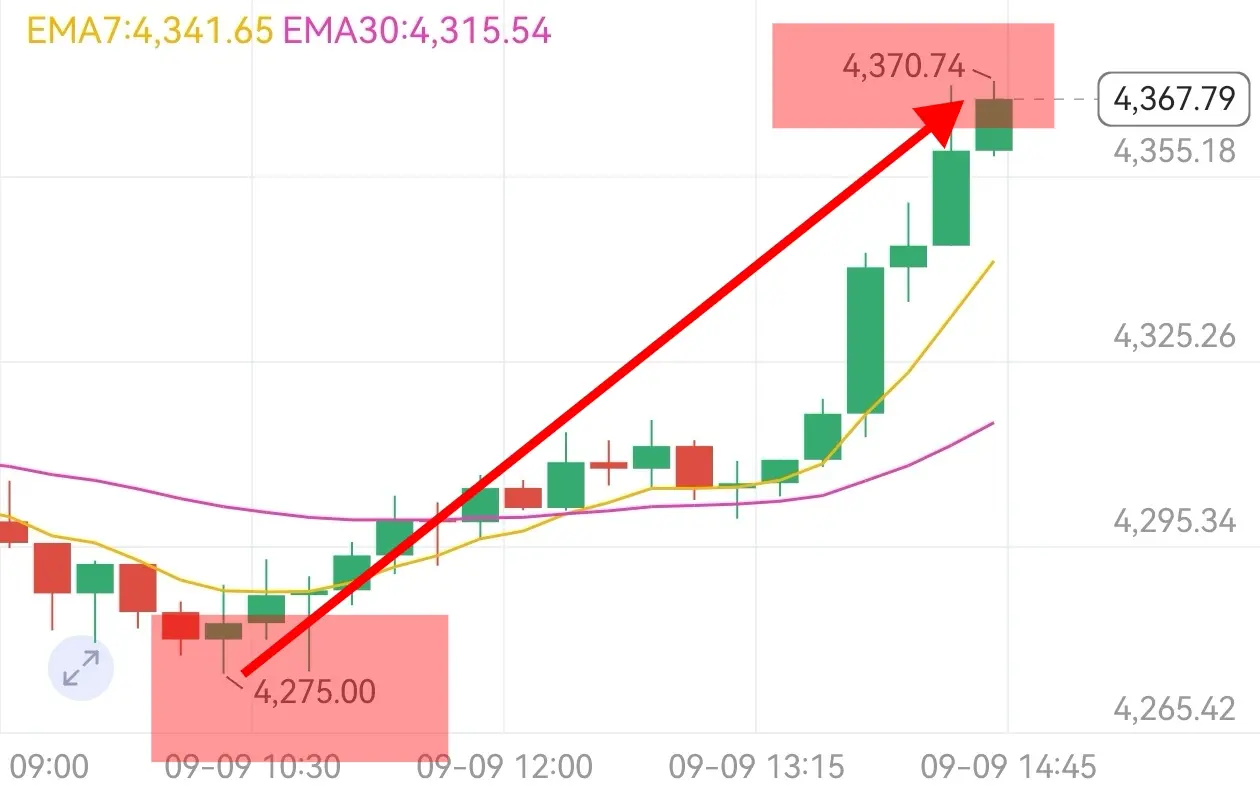
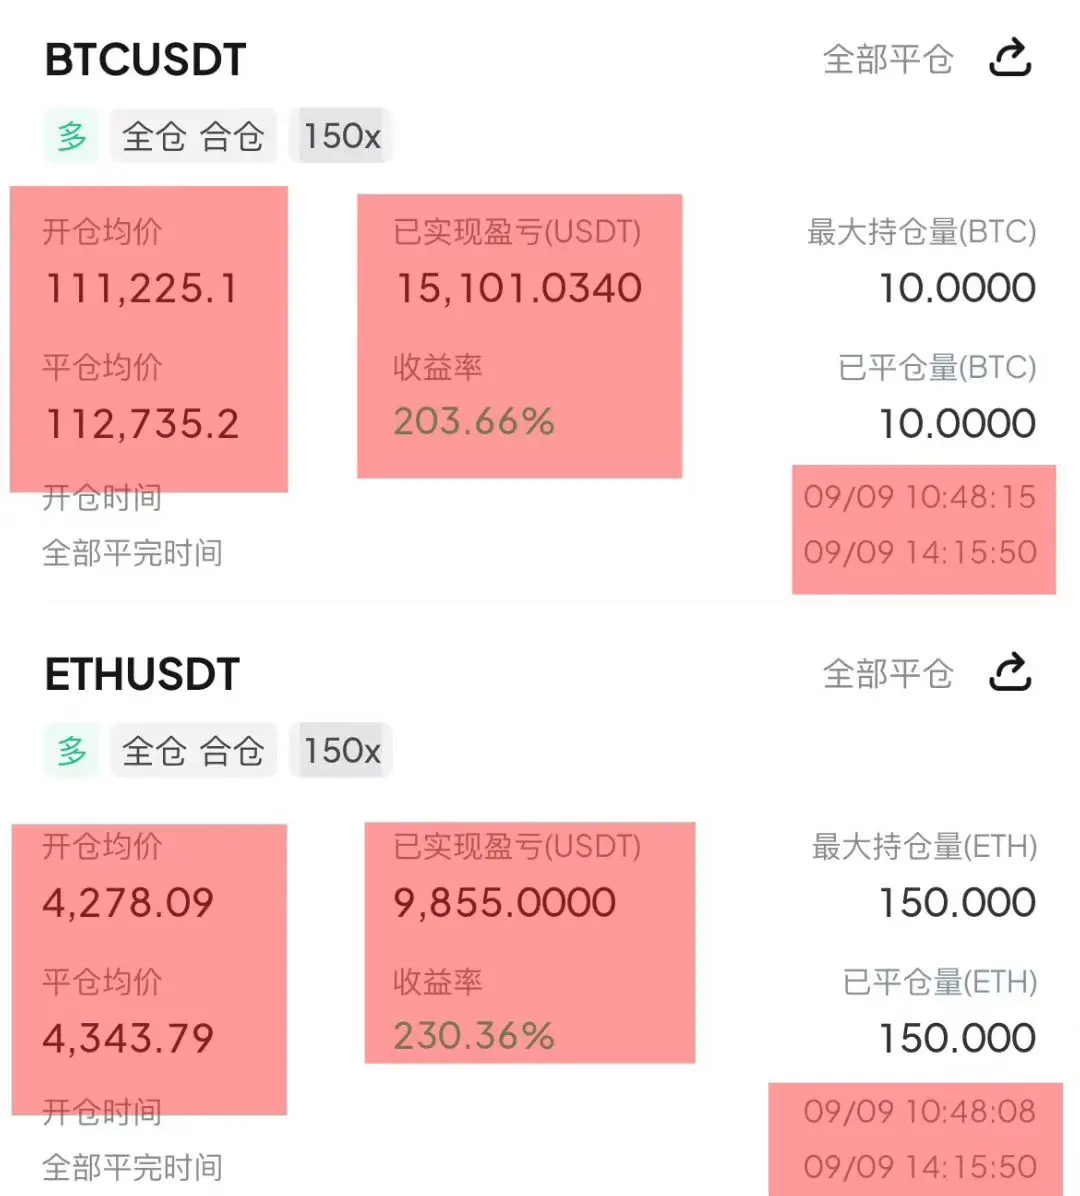
Brothers, BTC and ETH have all arrived at the expected entry points, and now you can directly trade at the current price, with targets looking down at around 112600/4360! #SOL价格预测# #GUSD双重收益# #DOGE ETF上市#
View Original
- Reward
- like
- 1
- Repost
- Share
MicroProfit:
It is that you guys rose up empty.Market Analysis for the Morning of September 11
In the four-hour cycle, the K-line shows an alternating pattern of small bearish and bullish candles, with a balance of long and short forces, and the price is consolidating at a high level. From a technical perspective, the MACD red bars in this cycle continue to shorten, indicating a gradual weakening of bullish momentum, with the distance between the fast and slow lines narrowing, suggesting a short-term risk of trend reversal.
On the daily chart, although the MACD maintains a golden cross pattern and the medium-term trend is positive, the
View Original
In the four-hour cycle, the K-line shows an alternating pattern of small bearish and bullish candles, with a balance of long and short forces, and the price is consolidating at a high level. From a technical perspective, the MACD red bars in this cycle continue to shorten, indicating a gradual weakening of bullish momentum, with the distance between the fast and slow lines narrowing, suggesting a short-term risk of trend reversal.
On the daily chart, although the MACD maintains a golden cross pattern and the medium-term trend is positive, the
- Reward
- 1
- Comment
- Repost
- Share
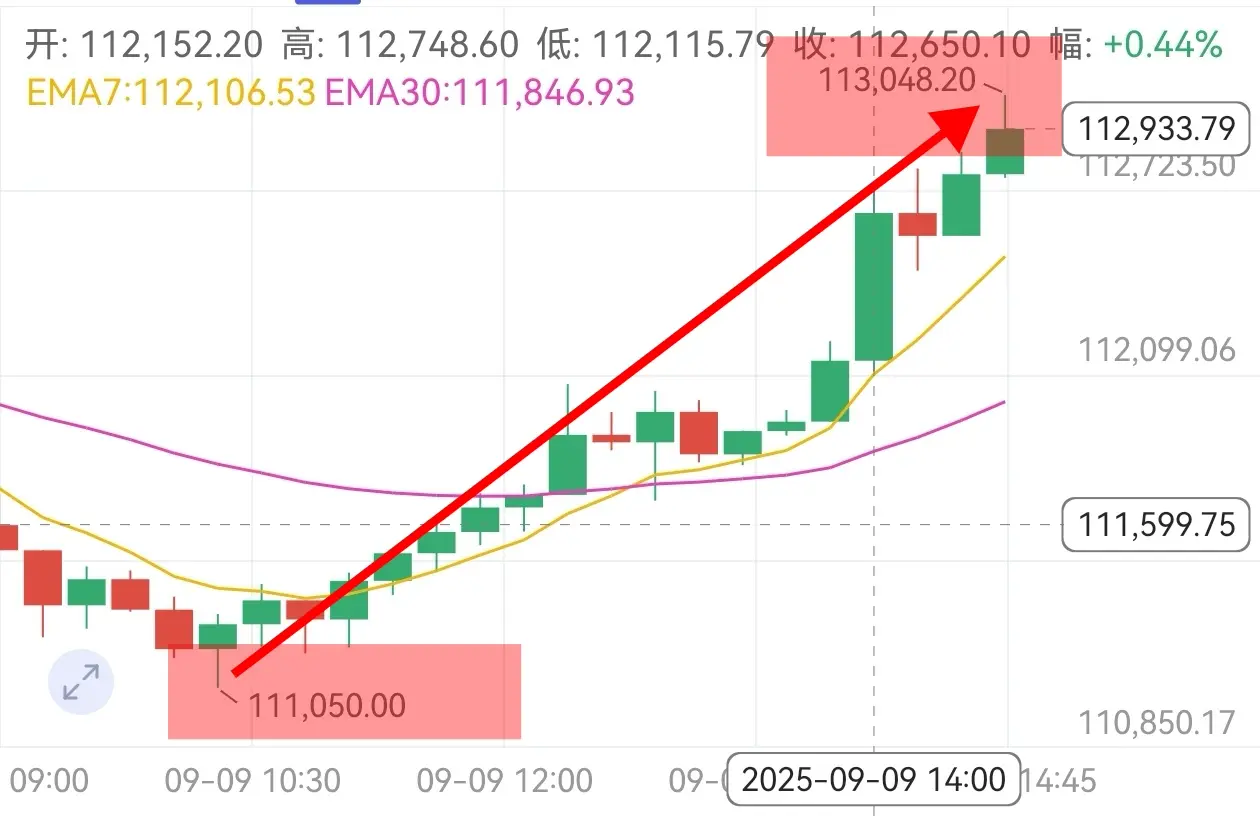
Brothers, we have eaten enough, now it's time to make a strong push and continue eating. The current price is directly targeting around 112800/4360! #GUSD双重收益#
View Original
- Reward
- like
- Comment
- Repost
- Share
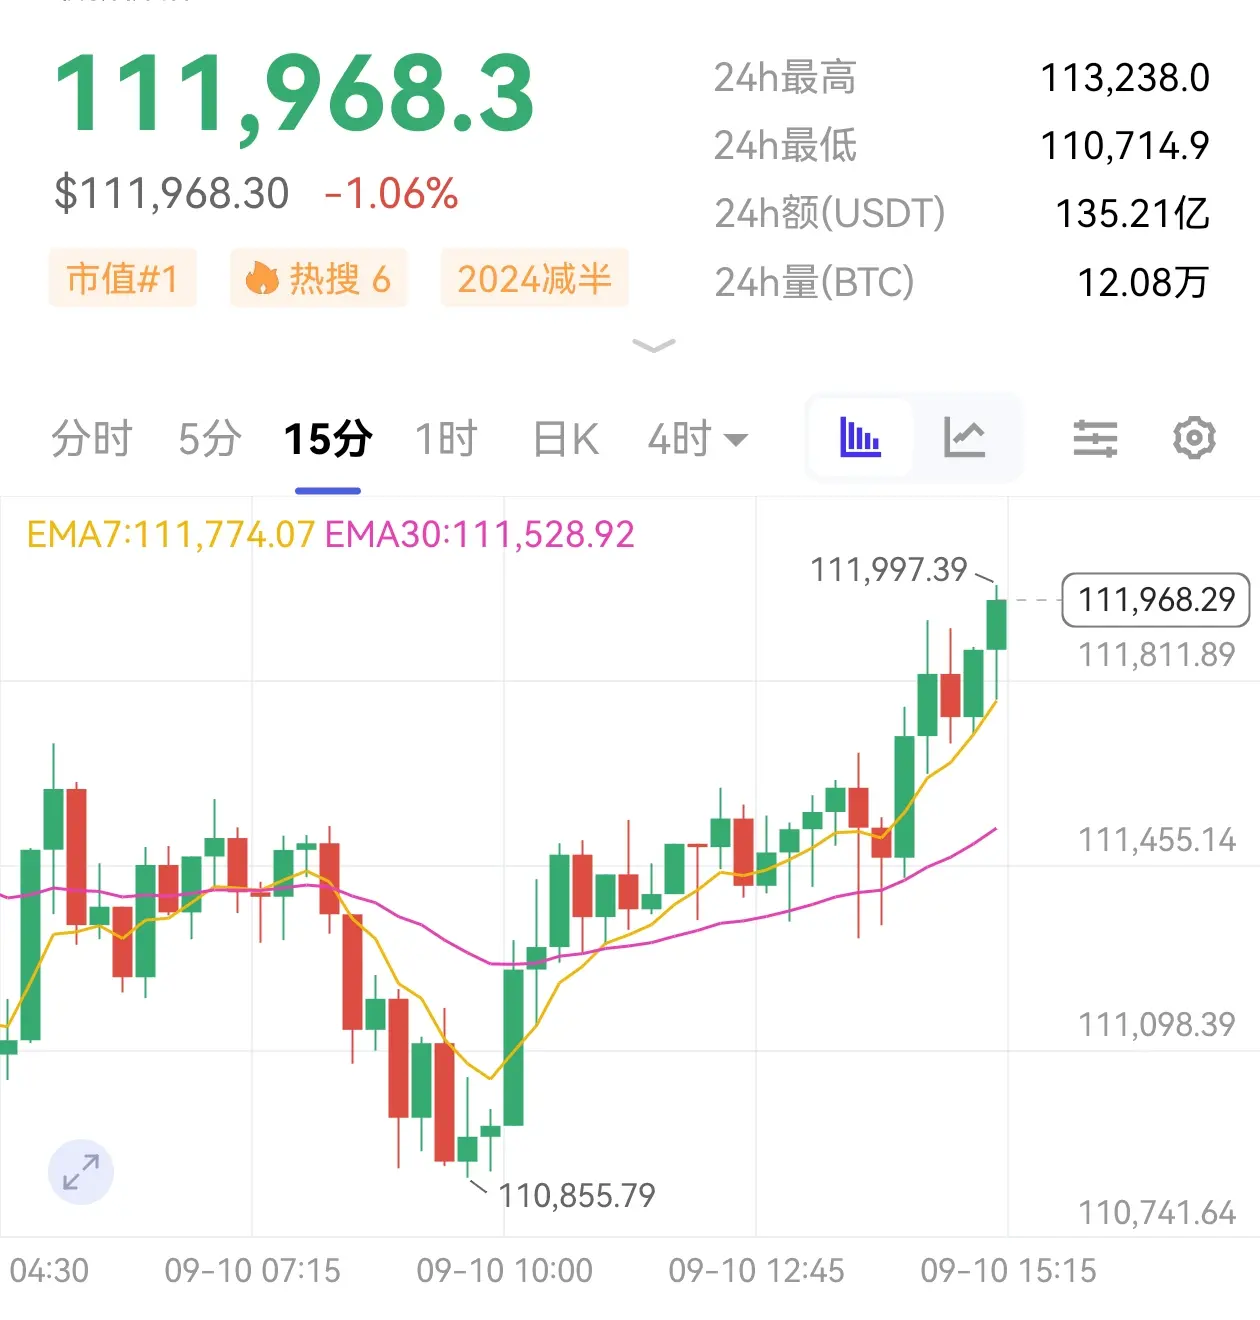
Analysis of 9.10 in the afternoon
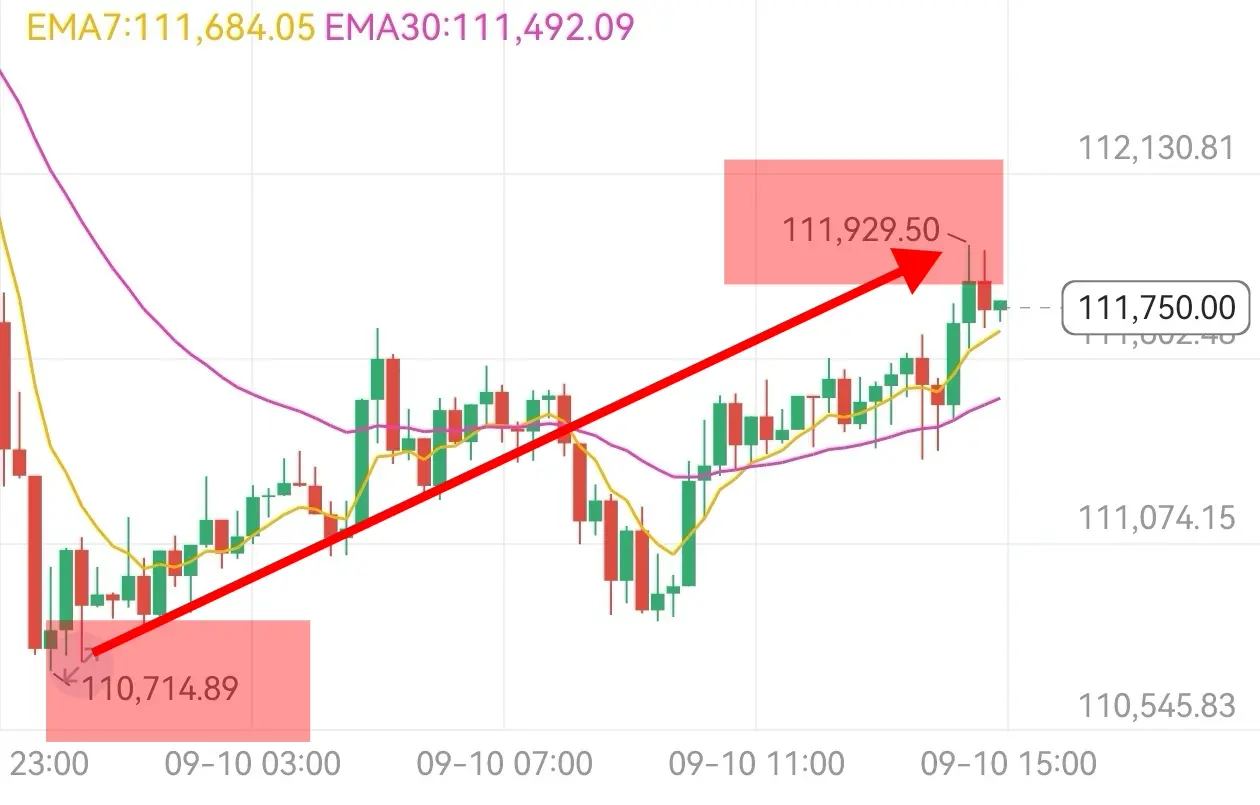
The trend is confirmed. After the coin price dropped to a low of 110700 yesterday, Bitcoin has stopped falling, stabilized, and slightly rebounded, entering a consolidation phase.
From a technical perspective, the daily chart has rebounded above the middle band, releasing positive signals, indicating that the bulls have not given up and are still brewing a counterattack. Therefore, the strategy in the afternoon leans towards positioning long positions after a pullback to seize potential rebound opportunities.
Operational Recommendations
The pancake is near 1
View OriginalThe trend is confirmed. After the coin price dropped to a low of 110700 yesterday, Bitcoin has stopped falling, stabilized, and slightly rebounded, entering a consolidation phase.
From a technical perspective, the daily chart has rebounded above the middle band, releasing positive signals, indicating that the bulls have not given up and are still brewing a counterattack. Therefore, the strategy in the afternoon leans towards positioning long positions after a pullback to seize potential rebound opportunities.
Operational Recommendations
The pancake is near 1
- Reward
- like
- 1
- Repost
- Share
BTCSurpasses150k:
Algo okay, friendThe thoughts in the early morning have also been successfully validated, and it's still the same saying: those who are stable can exit first, while those who want to continue looking upwards can adjust their defense! #GUSD双重收益# #DOGE ETF上市# #我最看好的AI代币#
View Original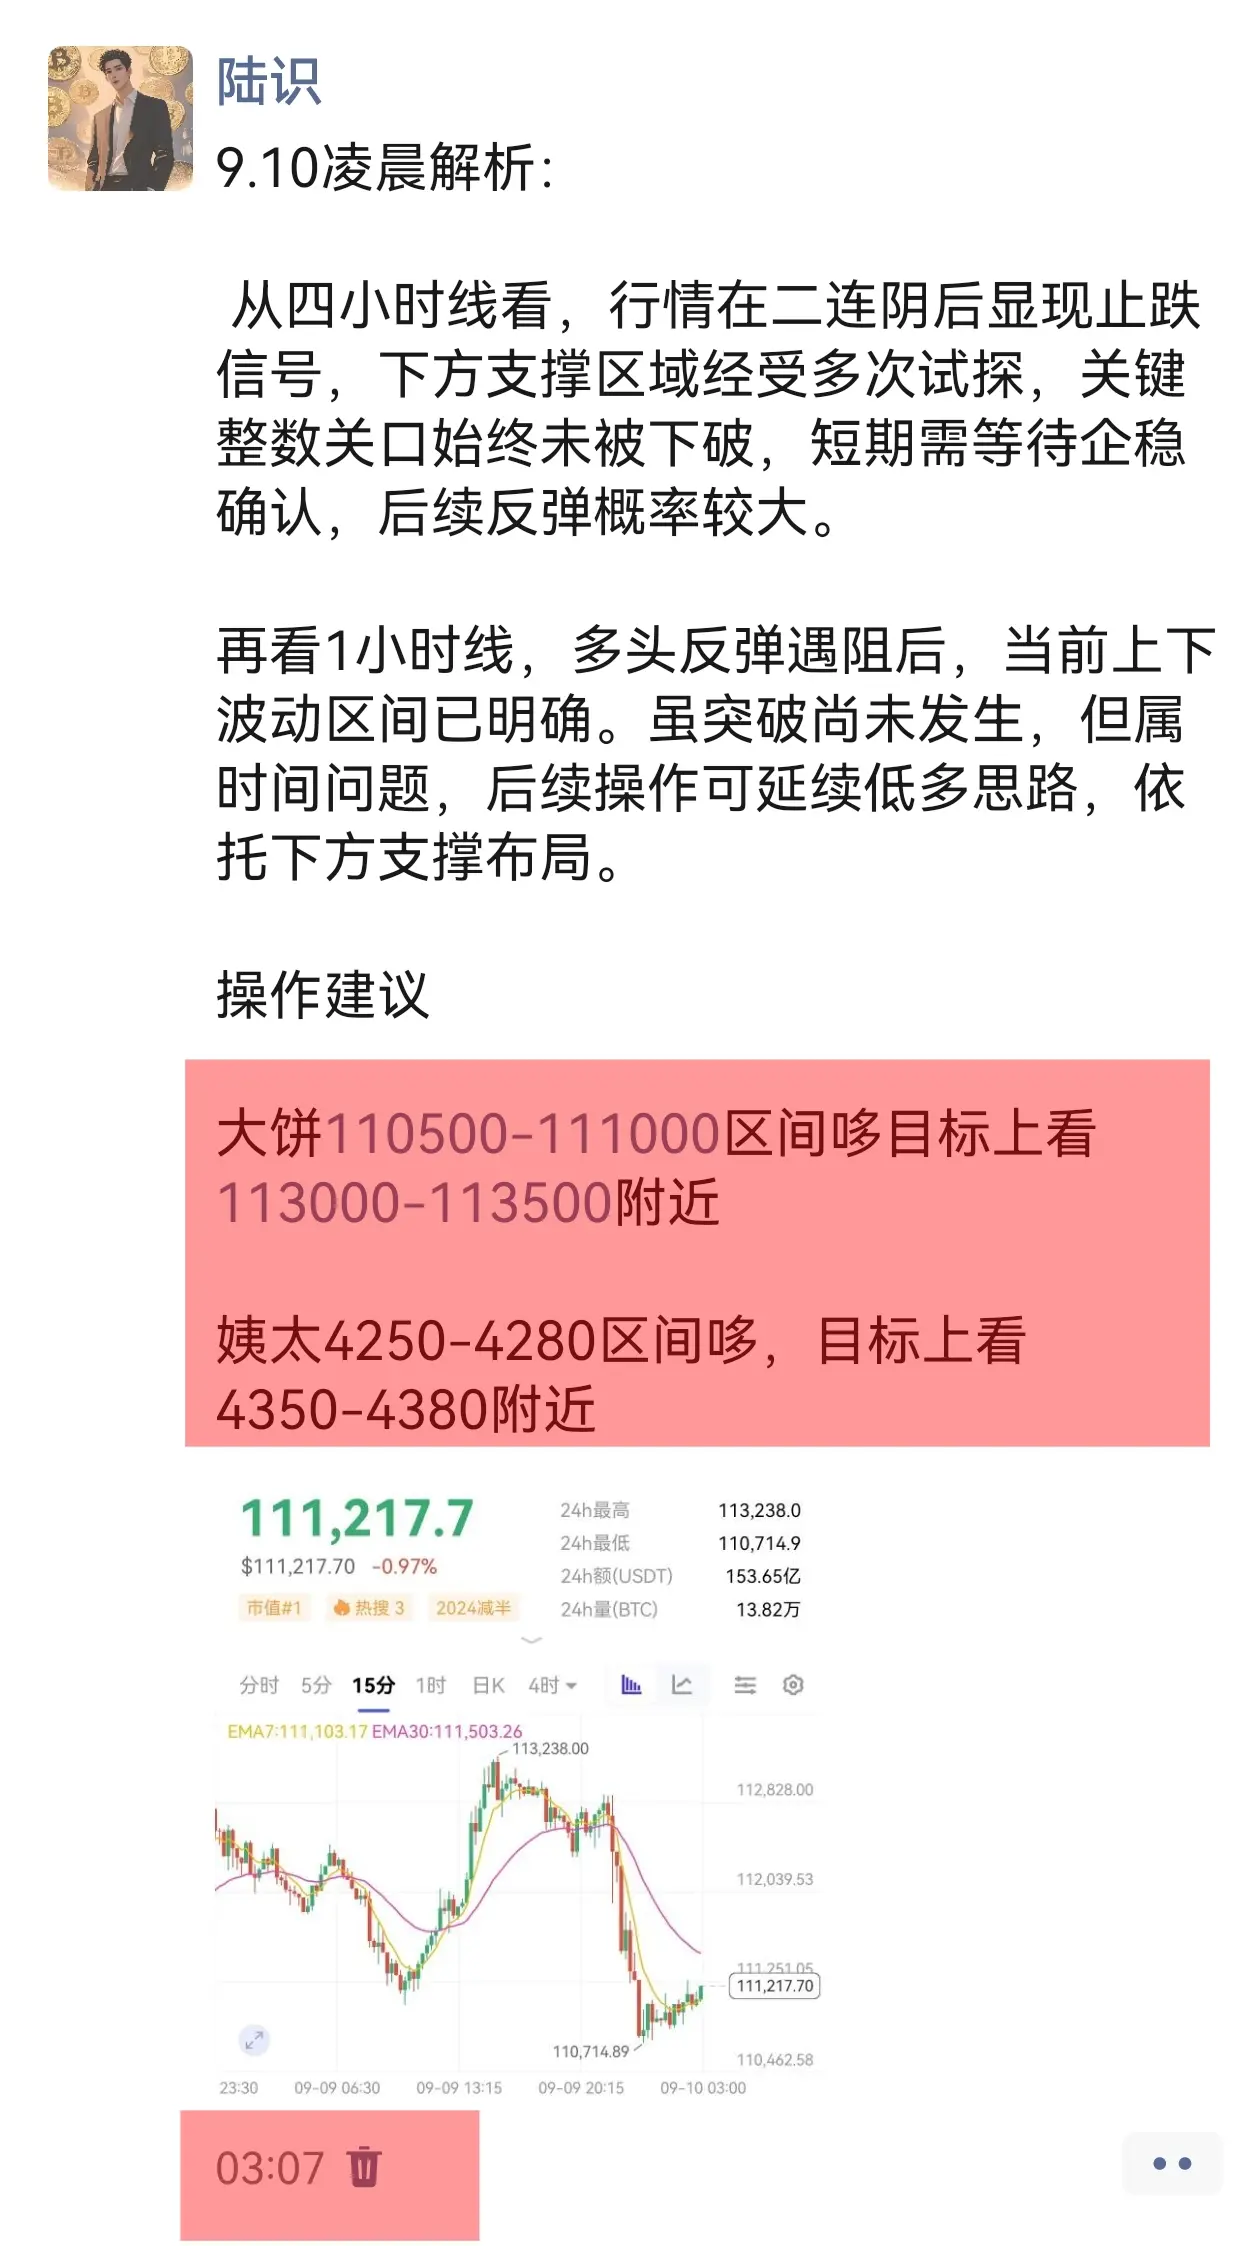
- Reward
- like
- Comment
- Repost
- Share
Still the same saying, good meals are not afraid of being late. The current price at midnight successfully verified again, finishing the kohlrabi and then successfully taking down the double kill! #GUSD双重收益# #DOGE ETF上市# #我最看好的AI代币#
View Original


- Reward
- like
- Comment
- Repost
- Share
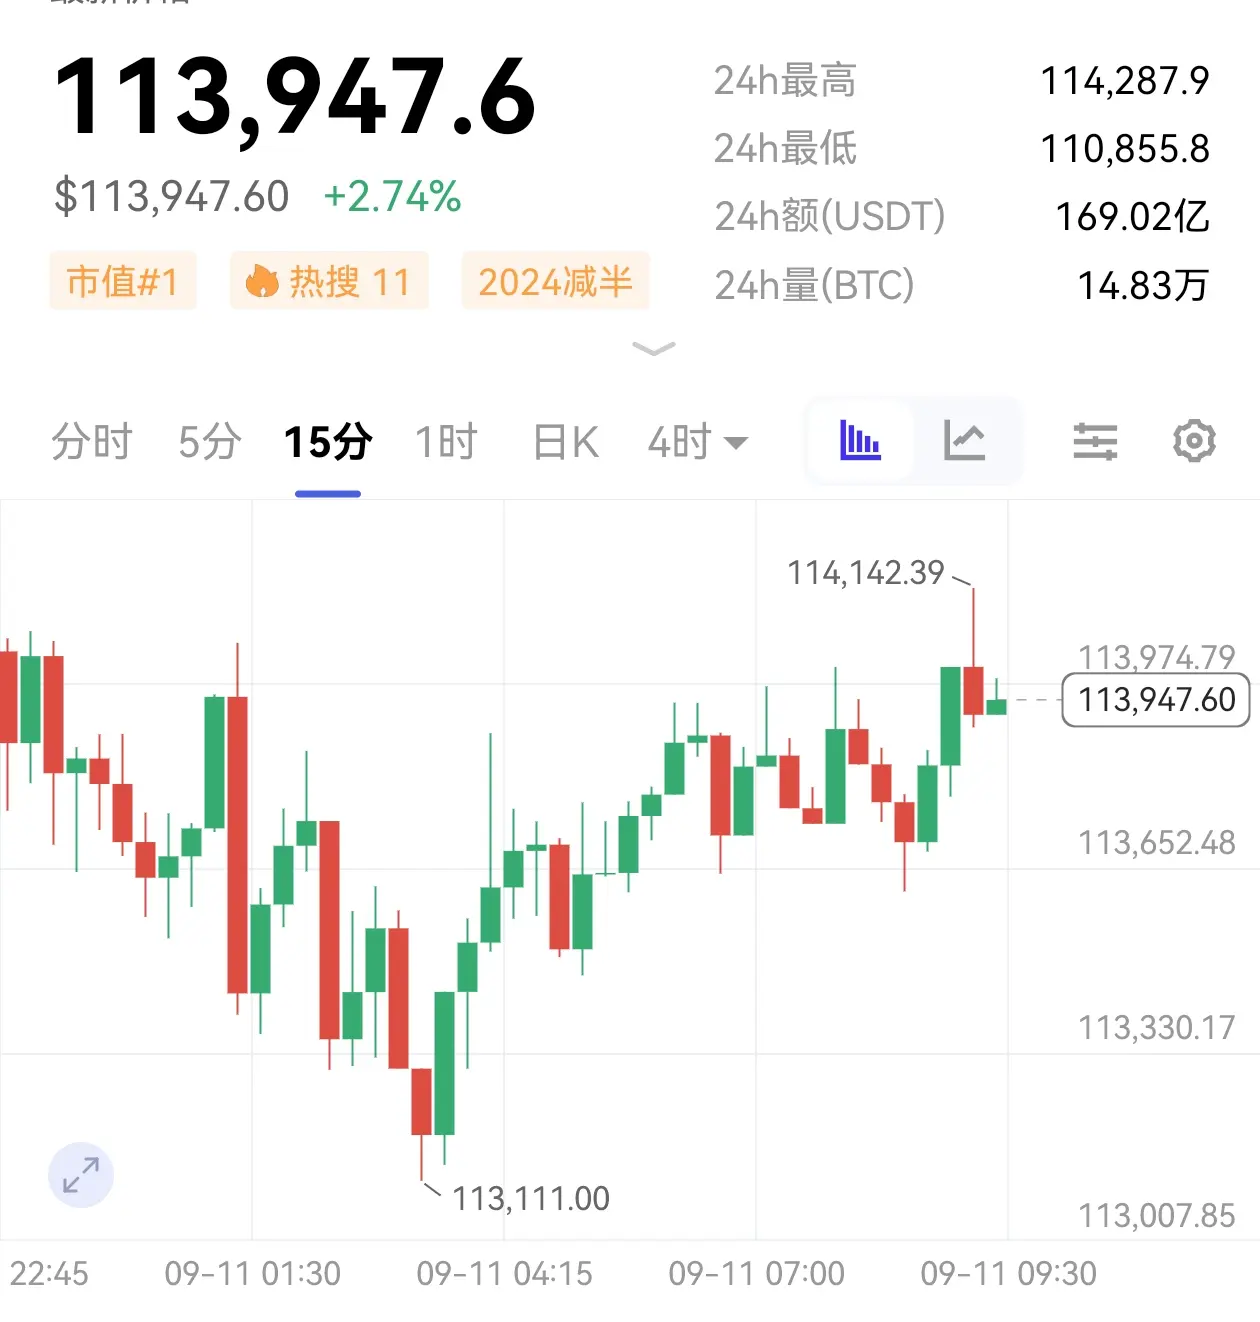
Analysis at 9:10 AM:
From the four-hour chart, the market shows signs of stopping the decline after two consecutive bearish candles. The support area has been tested multiple times, and the key integer level has not been broken down. In the short term, we need to wait for stabilization confirmation, and the probability of a rebound is relatively high.
Looking again at the 1-hour chart, after the bullish rebound faced resistance, the current range of fluctuations has become clear. Although a breakout has not yet occurred, it is a matter of time. Subsequent operations can continue with a low
View Original
From the four-hour chart, the market shows signs of stopping the decline after two consecutive bearish candles. The support area has been tested multiple times, and the key integer level has not been broken down. In the short term, we need to wait for stabilization confirmation, and the probability of a rebound is relatively high.
Looking again at the 1-hour chart, after the bullish rebound faced resistance, the current range of fluctuations has become clear. Although a breakout has not yet occurred, it is a matter of time. Subsequent operations can continue with a low
- Reward
- like
- Comment
- Repost
- Share
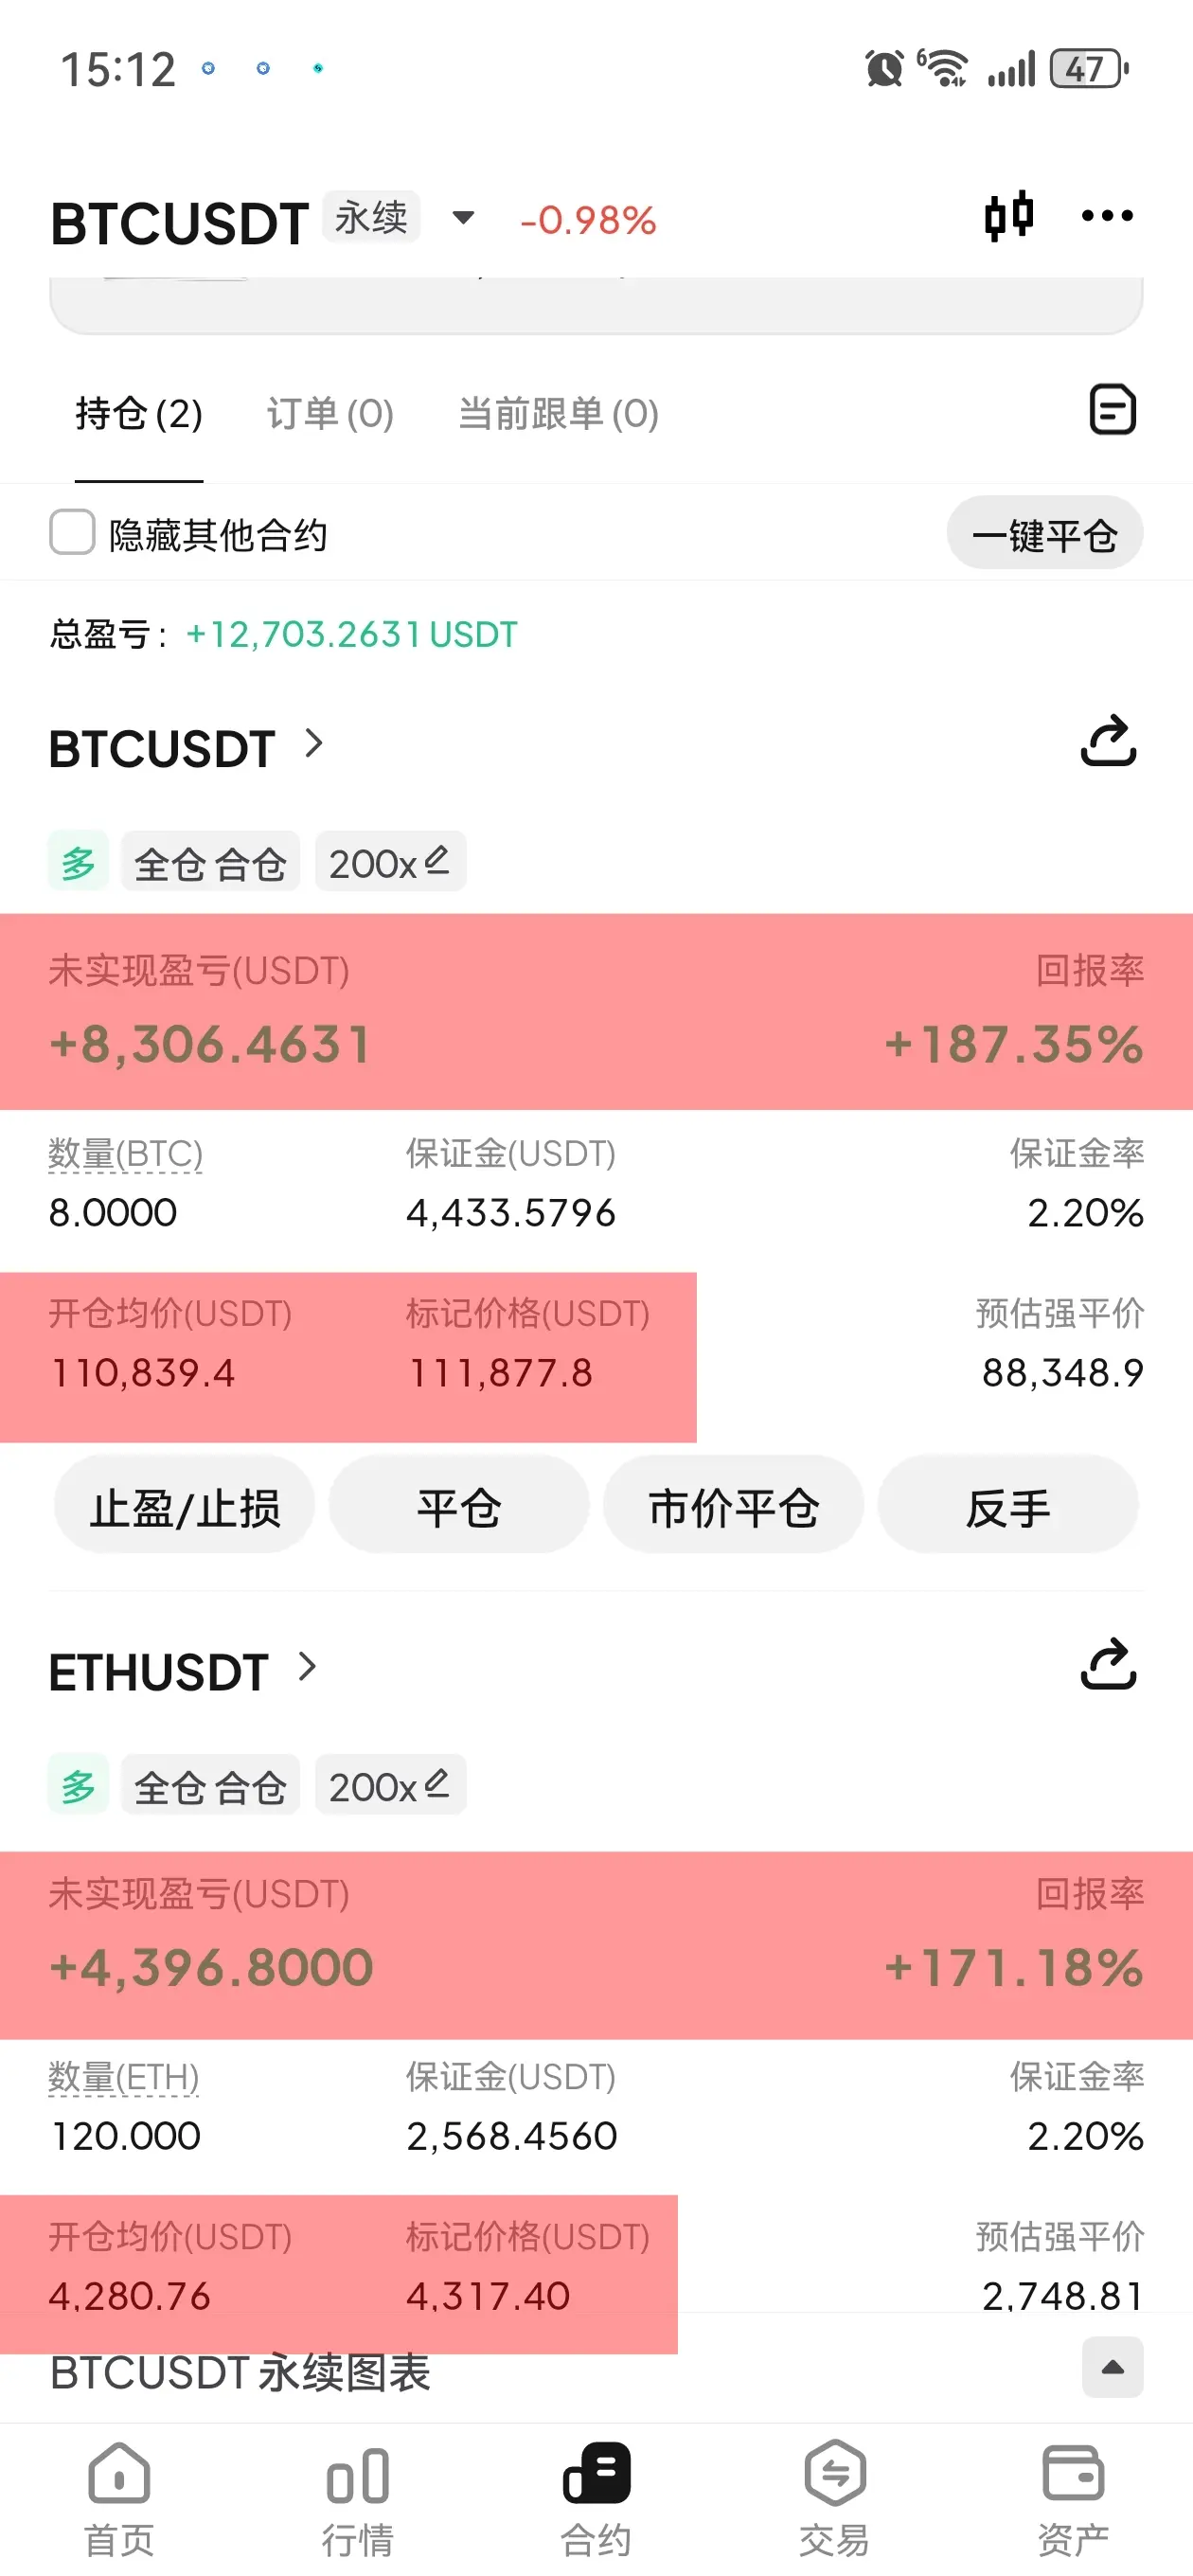
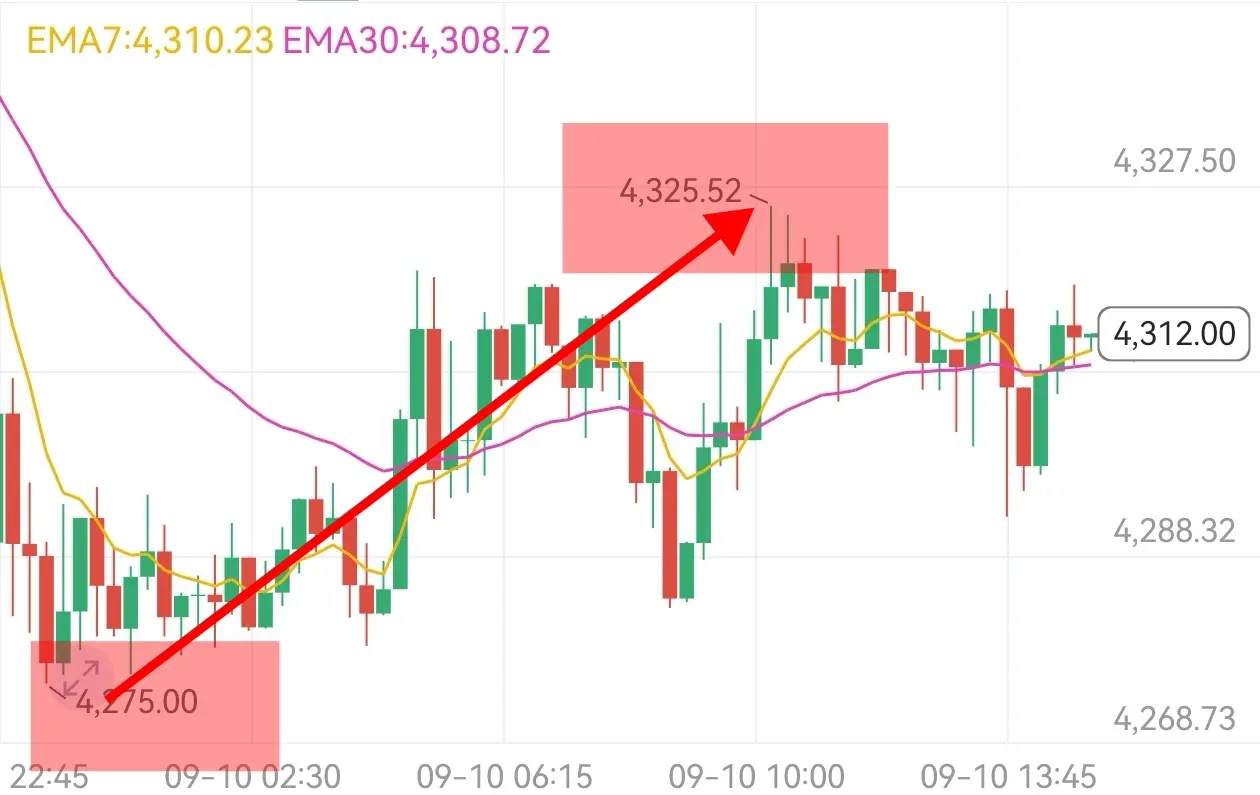
Lu Shi is still quite greedy, after finishing the meal he wants to eat again, BTC and ETH are currently looking directly at the target of around 112000/4320 #Gate广场创作点亮中秋# #我最看好的AI代币# #山寨币市场回暖# .
View Original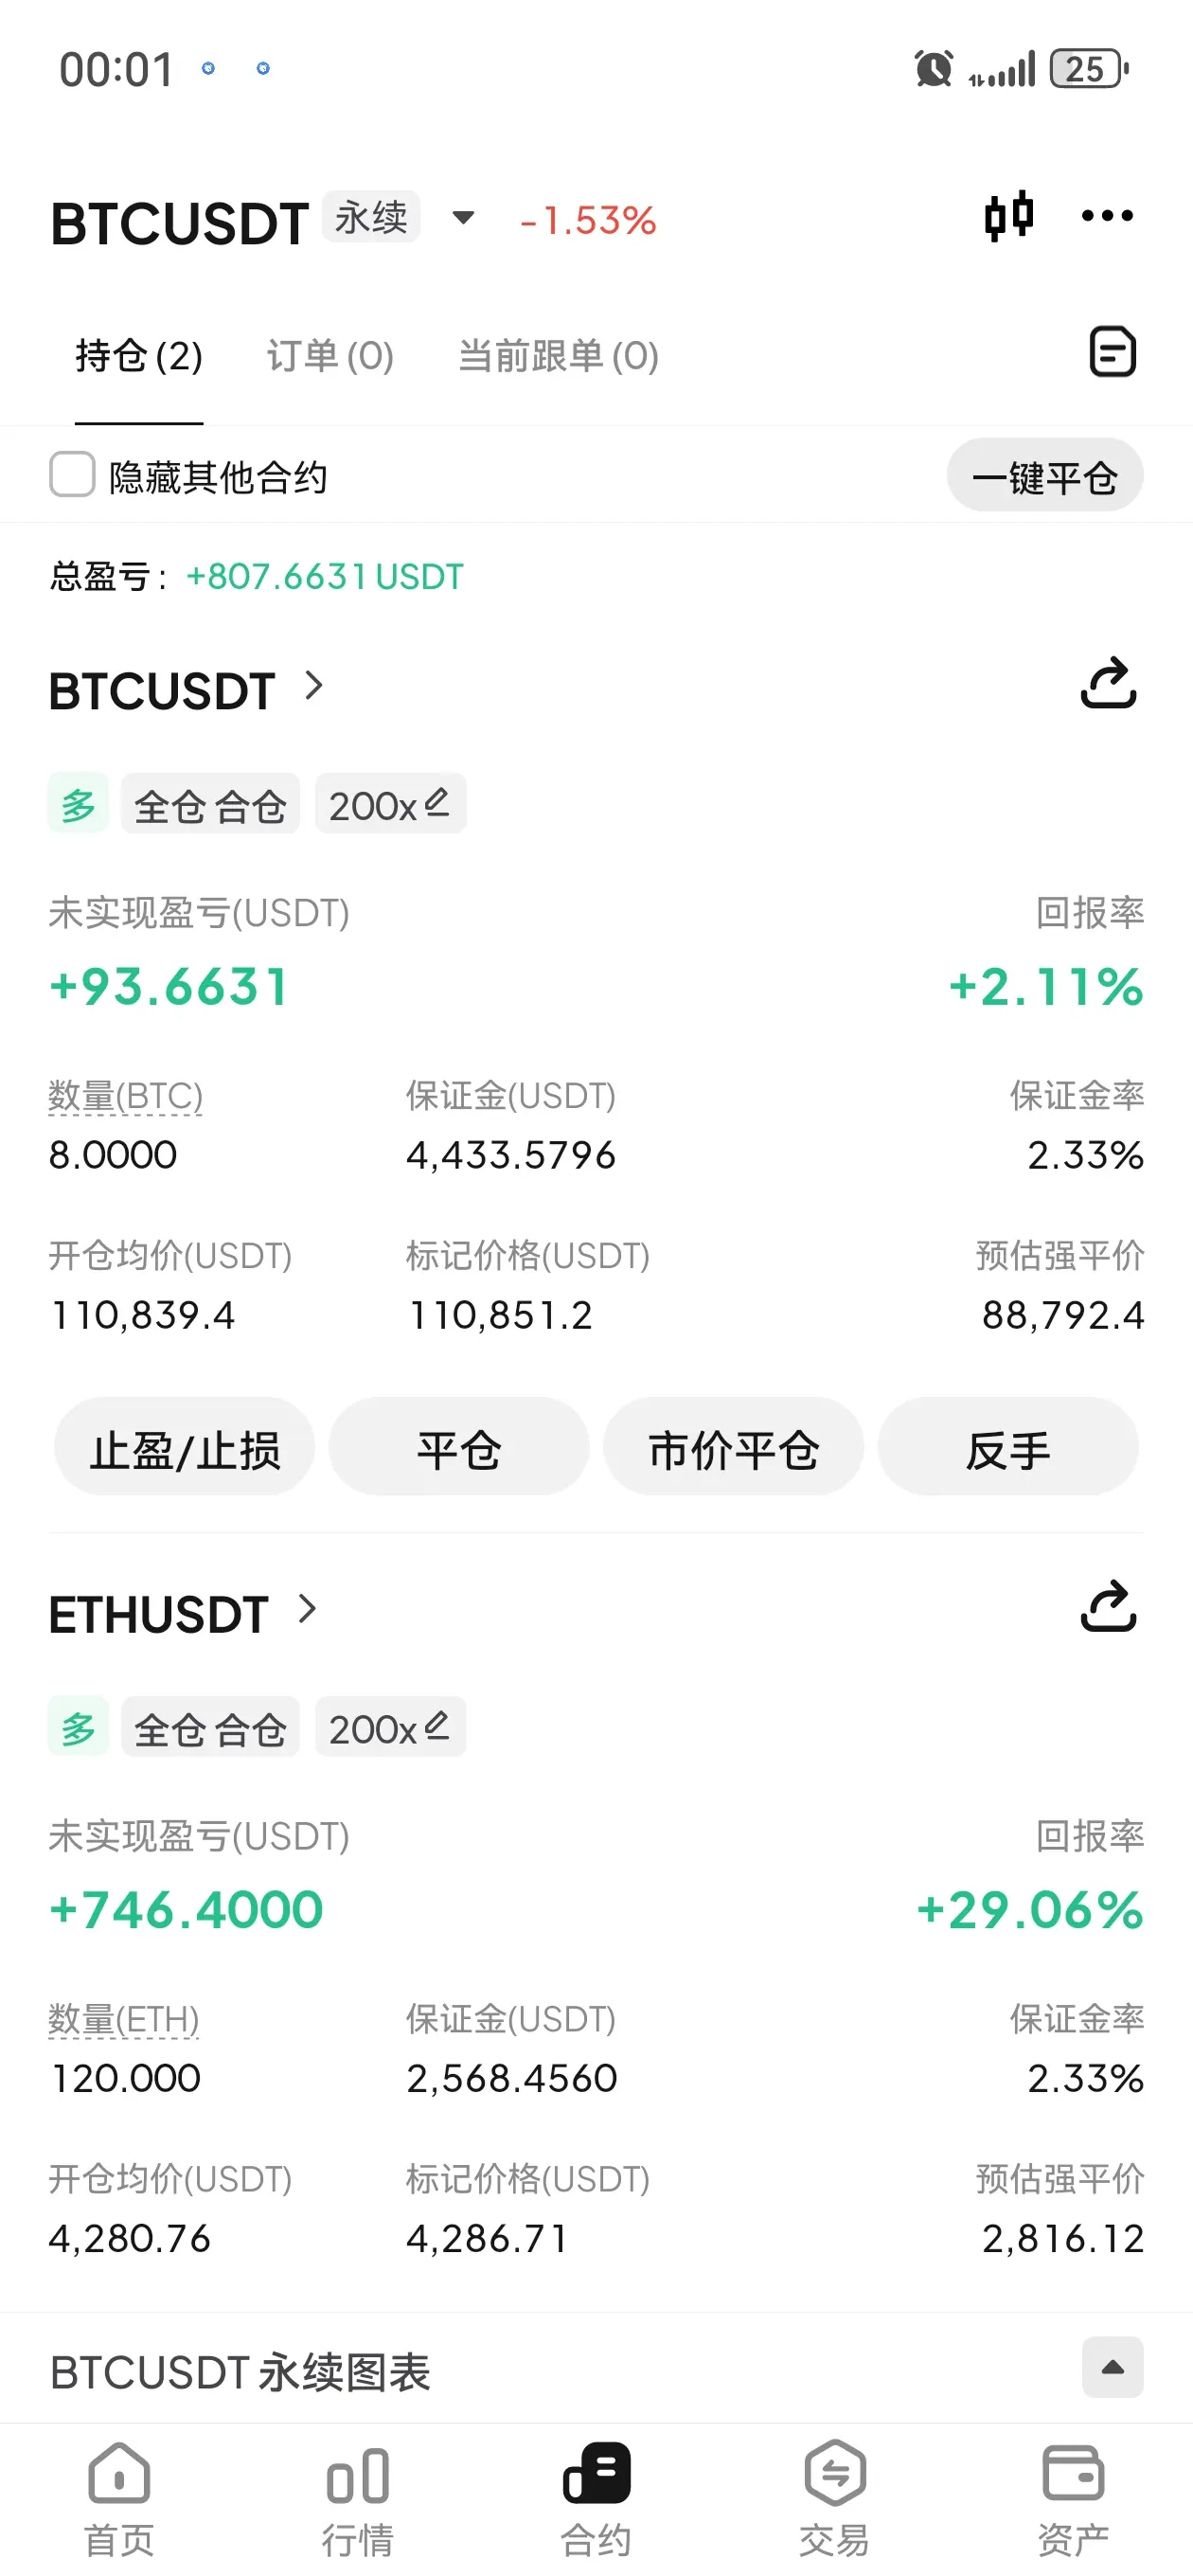
- Reward
- like
- Comment
- Repost
- Share
As the saying goes, good food is not afraid of being late. Those brothers who follow Lu Shi's afternoon price should all be full by now, right? The big pancake went south 1600 points and ETH is at 83 points! #Gate广场创作点亮中秋# #我最看好的AI代币# #山寨币市场回暖#
View Original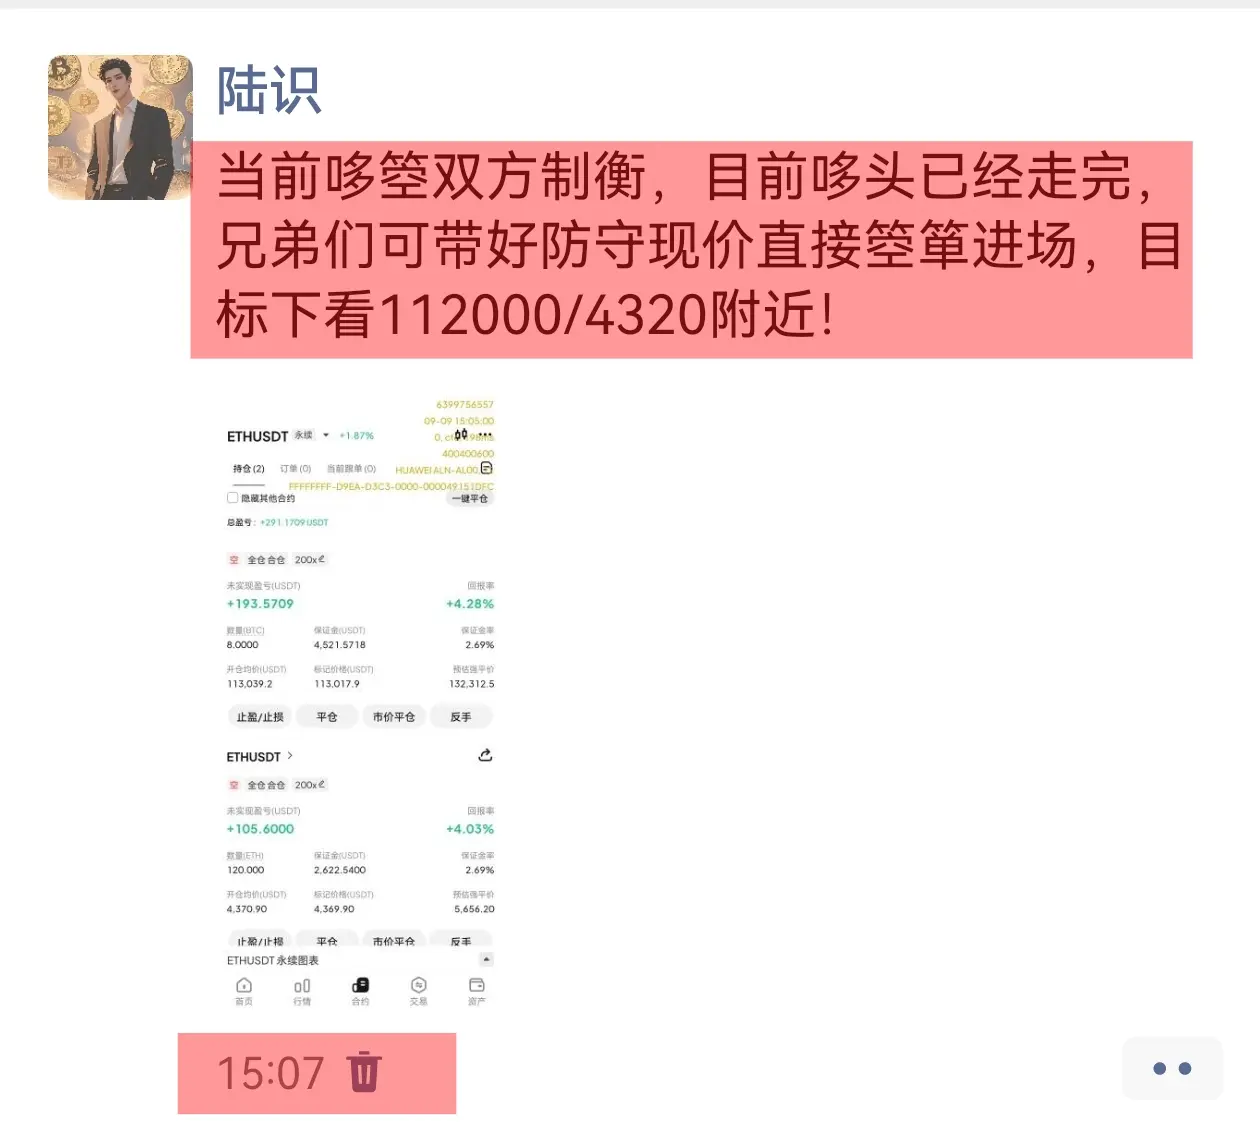
- Reward
- like
- Comment
- Repost
- Share
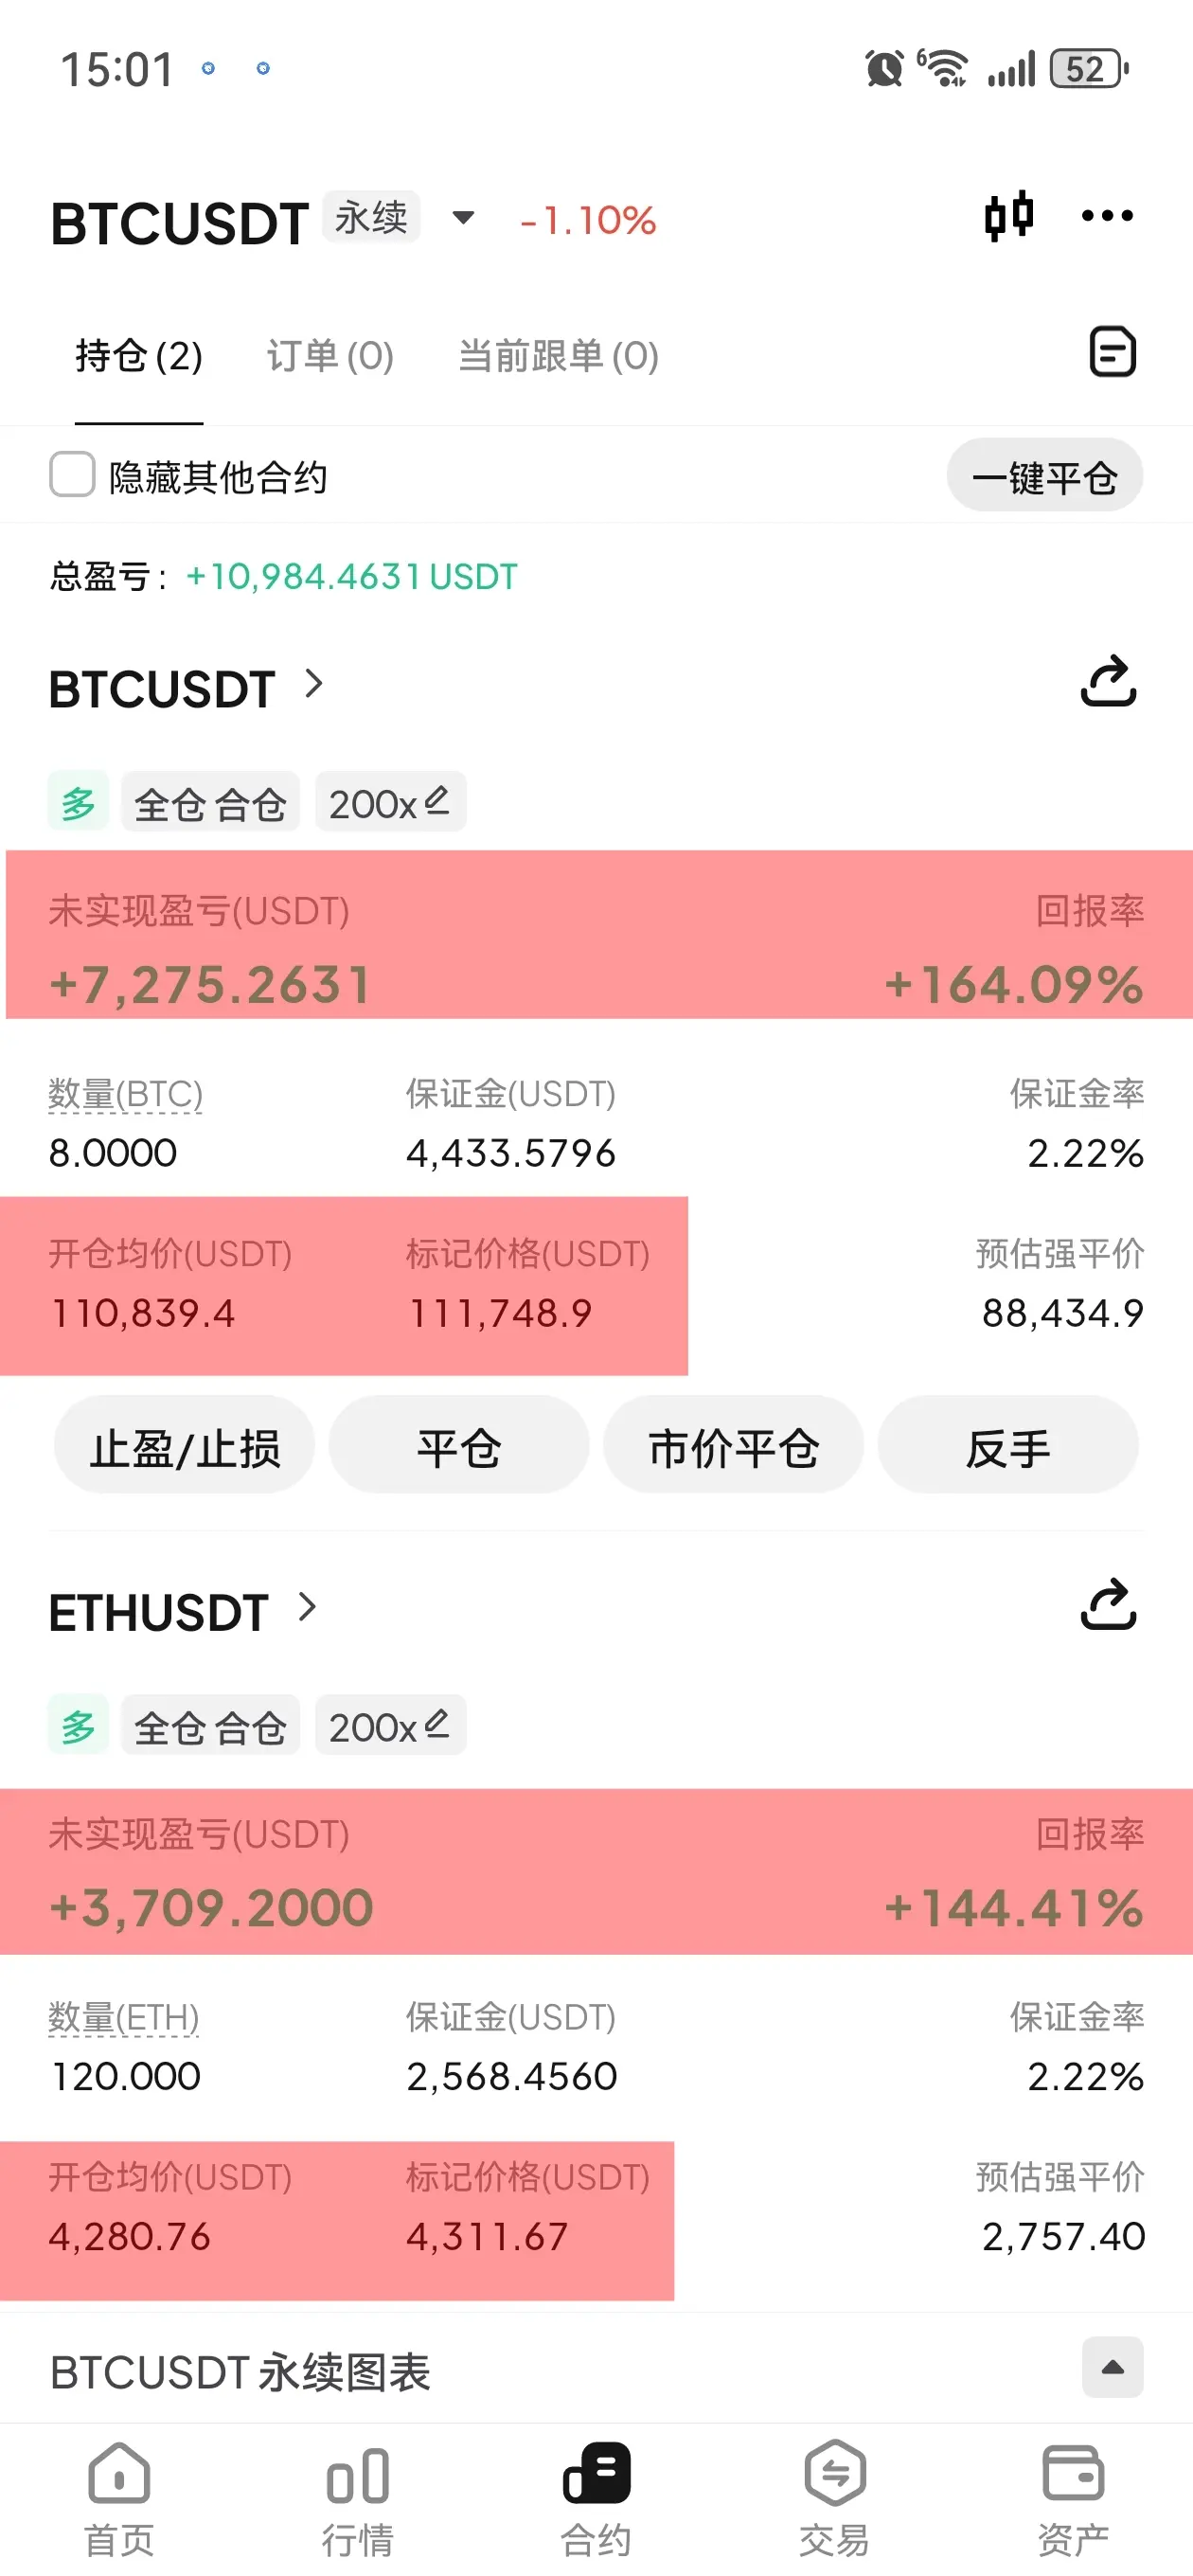
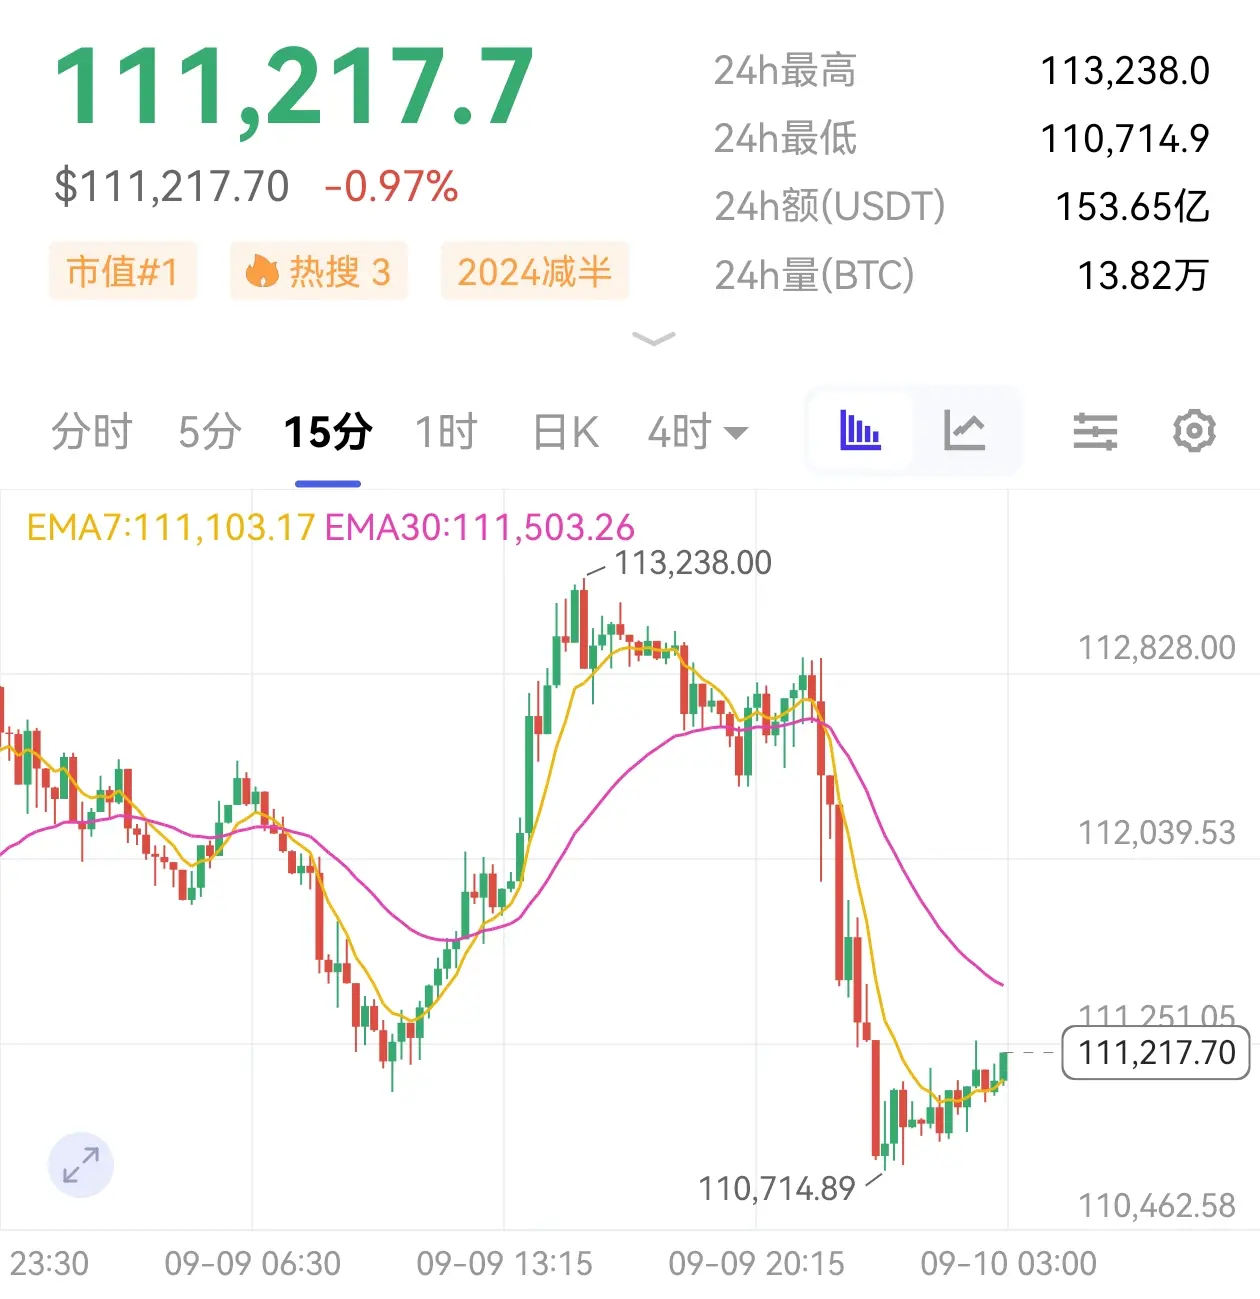
Currently, the balance of power between both sides is maintained. The head has already completed its move. Brothers, you can prepare your defenses and directly enter the market at the current price, targeting around 112000/4320! #Gate Alpha晒单挑战# #山寨币市场回暖# #RWA 总规模持续增长#
View Original
- Reward
- like
- Comment
- Repost
- Share
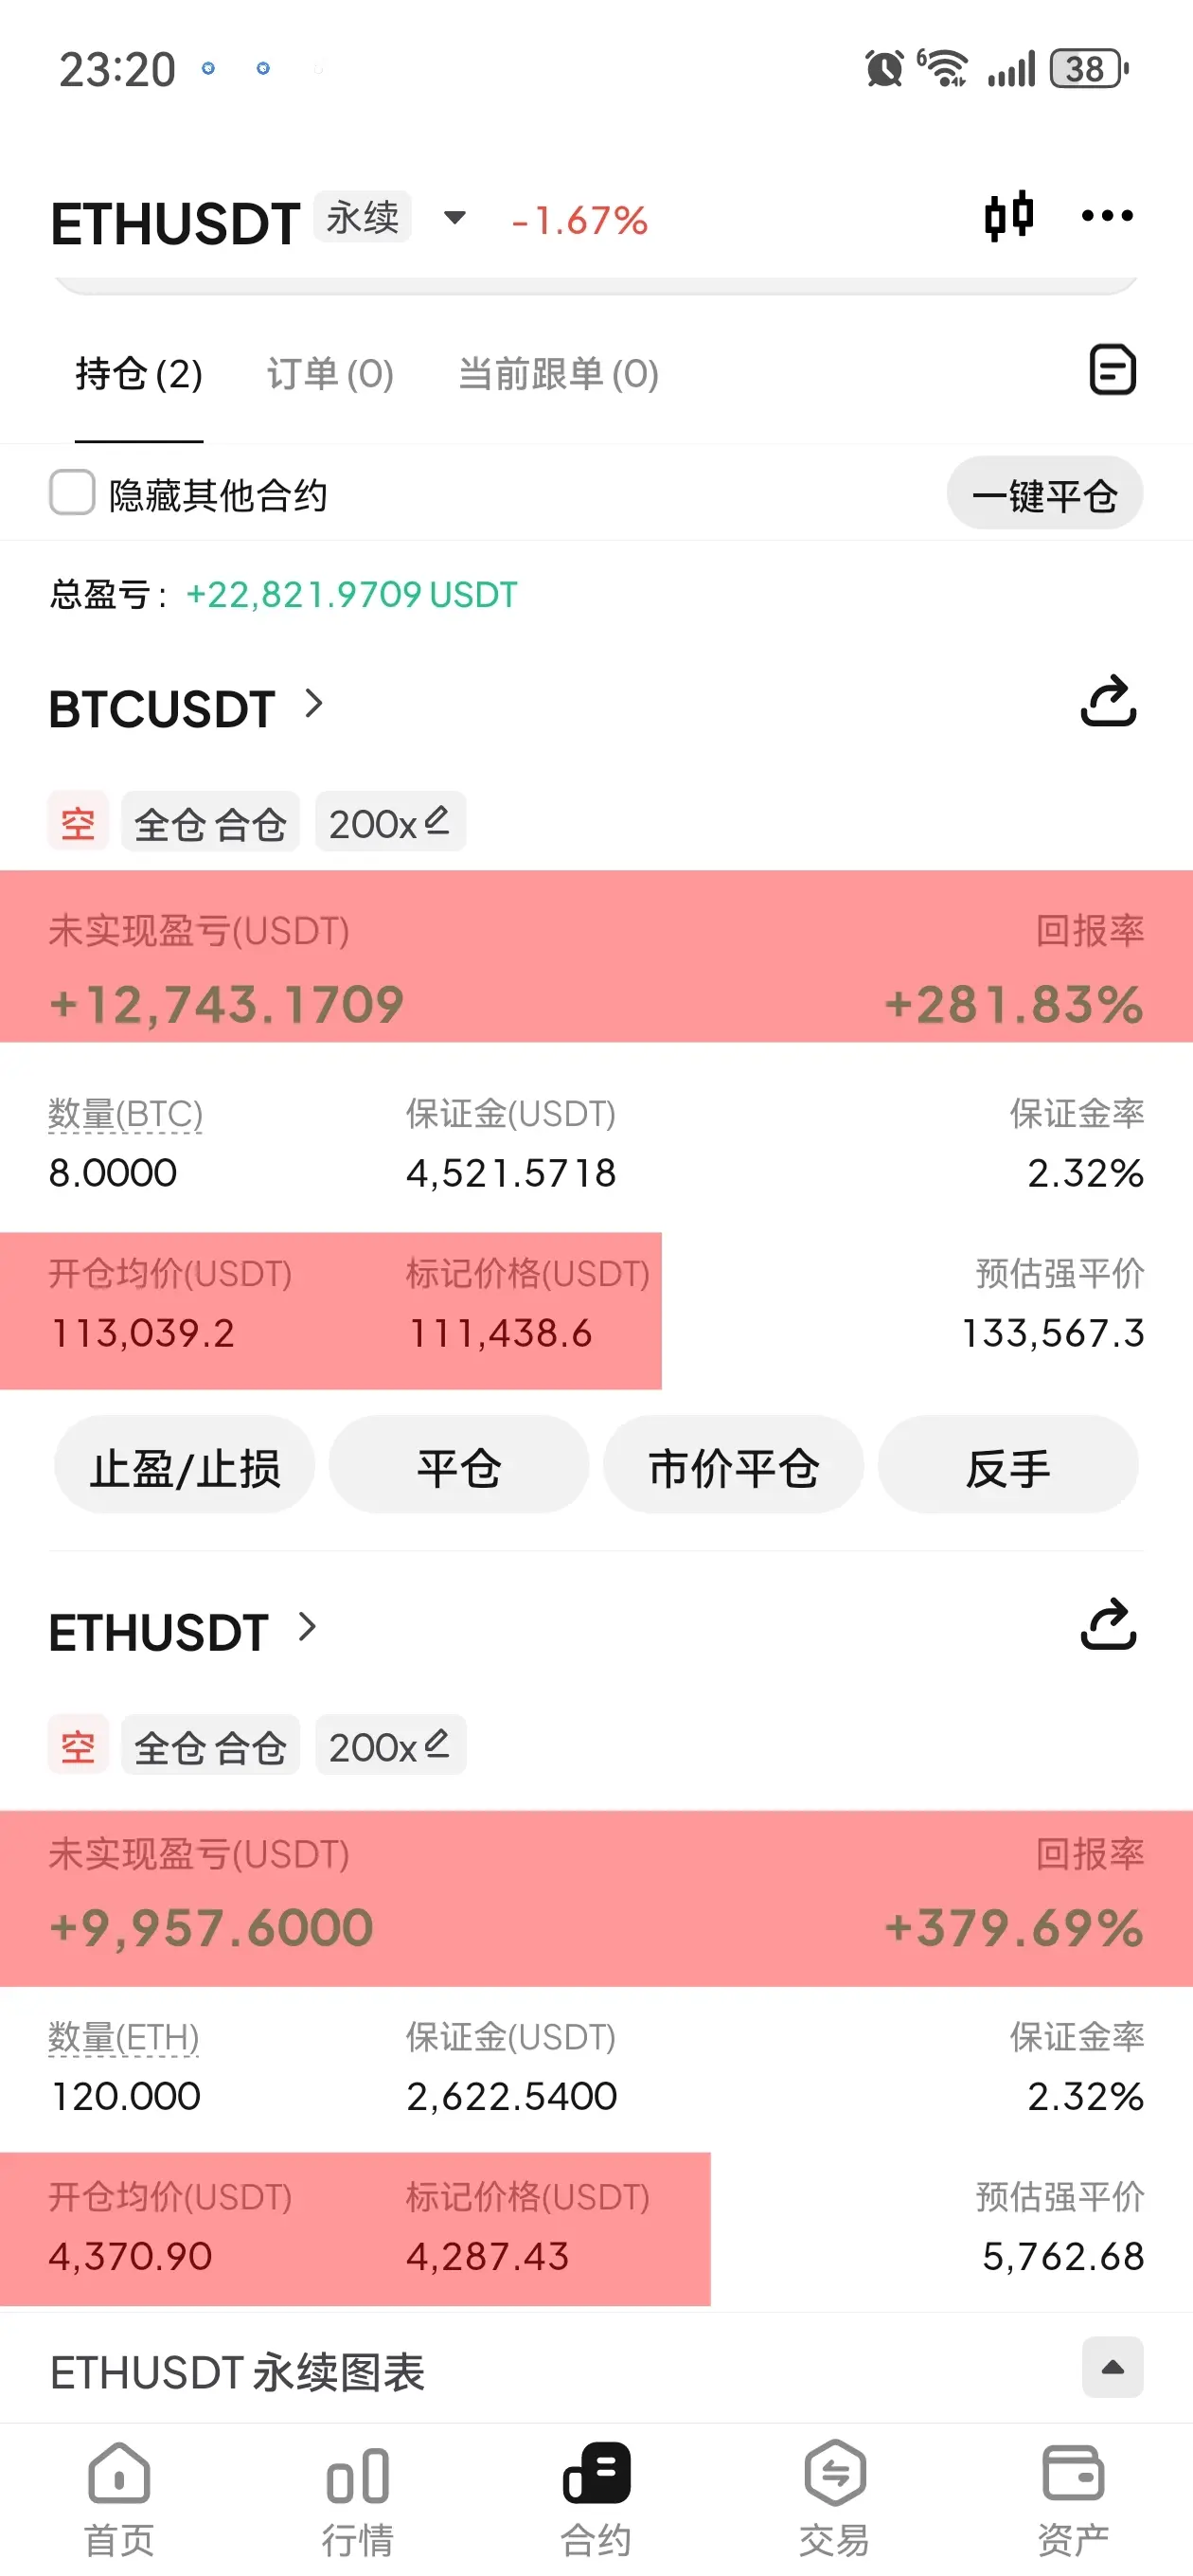
Morning analysis accurately verifies that the market is rising steadily and has reached the target. There is still pressure above; those brothers who can should exit first. After all, only the coins that fall into your pocket are yours! #Gate Alpha晒单挑战# #山寨币市场回暖# #RWA 总规模持续增长#
View Original
- Reward
- like
- 3
- Repost
- Share
RealGold:
Steadfast HODL💎View More
9.9 Market Analysis
The current market sentiment is neutral, with a balance between greed and fear. On one hand, positive news at the macro level is providing some support to the market; on the other hand, recent hacker attacks and other negative events are continuing to ferment, significantly suppressing market confidence.
Under the mutual balancing of long and short factors, the market lacks a clear directional drive, and in the short term, it is highly likely to maintain a range-bound oscillation pattern, making it difficult to form a trending breakout.
Operational Suggestions
The large
View Original
The current market sentiment is neutral, with a balance between greed and fear. On one hand, positive news at the macro level is providing some support to the market; on the other hand, recent hacker attacks and other negative events are continuing to ferment, significantly suppressing market confidence.
Under the mutual balancing of long and short factors, the market lacks a clear directional drive, and in the short term, it is highly likely to maintain a range-bound oscillation pattern, making it difficult to form a trending breakout.
Operational Suggestions
The large
- Reward
- like
- Comment
- Repost
- Share
9.8 Early Morning Analysis
Currently, on the 4-hour chart, Bitcoin continues to oscillate above 111,000, with significant resistance in the 112,000-113,000 pressure zone. The upper Bollinger Band resistance is clear, and multiple attempts to break through have failed, indicating weak momentum.
On the 1-hour chart, after a short-term rebound reaches the upper Bollinger Band, the MACD red bars significantly shorten, indicating a rapid decline in momentum. Moreover, the rebound volume is insufficient, showing a stark contrast to the previous decline in volume, making it difficult to support an
View OriginalCurrently, on the 4-hour chart, Bitcoin continues to oscillate above 111,000, with significant resistance in the 112,000-113,000 pressure zone. The upper Bollinger Band resistance is clear, and multiple attempts to break through have failed, indicating weak momentum.
On the 1-hour chart, after a short-term rebound reaches the upper Bollinger Band, the MACD red bars significantly shorten, indicating a rapid decline in momentum. Moreover, the rebound volume is insufficient, showing a stark contrast to the previous decline in volume, making it difficult to support an
- Reward
- like
- Comment
- Repost
- Share