Trade
Basic
Futures
Futures
Hundreds of contracts settled in USDT or BTC
TradFi
Gold
Trade global traditional assets with USDT in one place
Options
Hot
Trade European-style vanilla options
Unified Account
Maximize your capital efficiency
Demo Trading
Futures Kickoff
Get prepared for your futures trading
Futures Events
Participate in events to win generous rewards
Demo Trading
Use virtual funds to experience risk-free trading
Earn
Launch
CandyDrop
Collect candies to earn airdrops
Launchpool
Quick staking, earn potential new tokens
HODLer Airdrop
Hold GT and get massive airdrops for free
Launchpad
Be early to the next big token project
Alpha Points
Trade on-chain assets and enjoy airdrop rewards!
Futures Points
Earn futures points and claim airdrop rewards
Investment
Simple Earn
Earn interests with idle tokens
Auto-Invest
Auto-invest on a regular basis
Dual Investment
Buy low and sell high to take profits from price fluctuations
Soft Staking
Earn rewards with flexible staking
Crypto Loan
0 Fees
Pledge one crypto to borrow another
Lending Center
One-stop lending hub
VIP Wealth Hub
Customized wealth management empowers your assets growth
Private Wealth Management
Customized asset management to grow your digital assets
Quant Fund
Top asset management team helps you profit without hassle
Staking
Stake cryptos to earn in PoS products
Smart Leverage
New
No forced liquidation before maturity, worry-free leveraged gains
GUSD Minting
Use USDT/USDC to mint GUSD for treasury-level yields
More
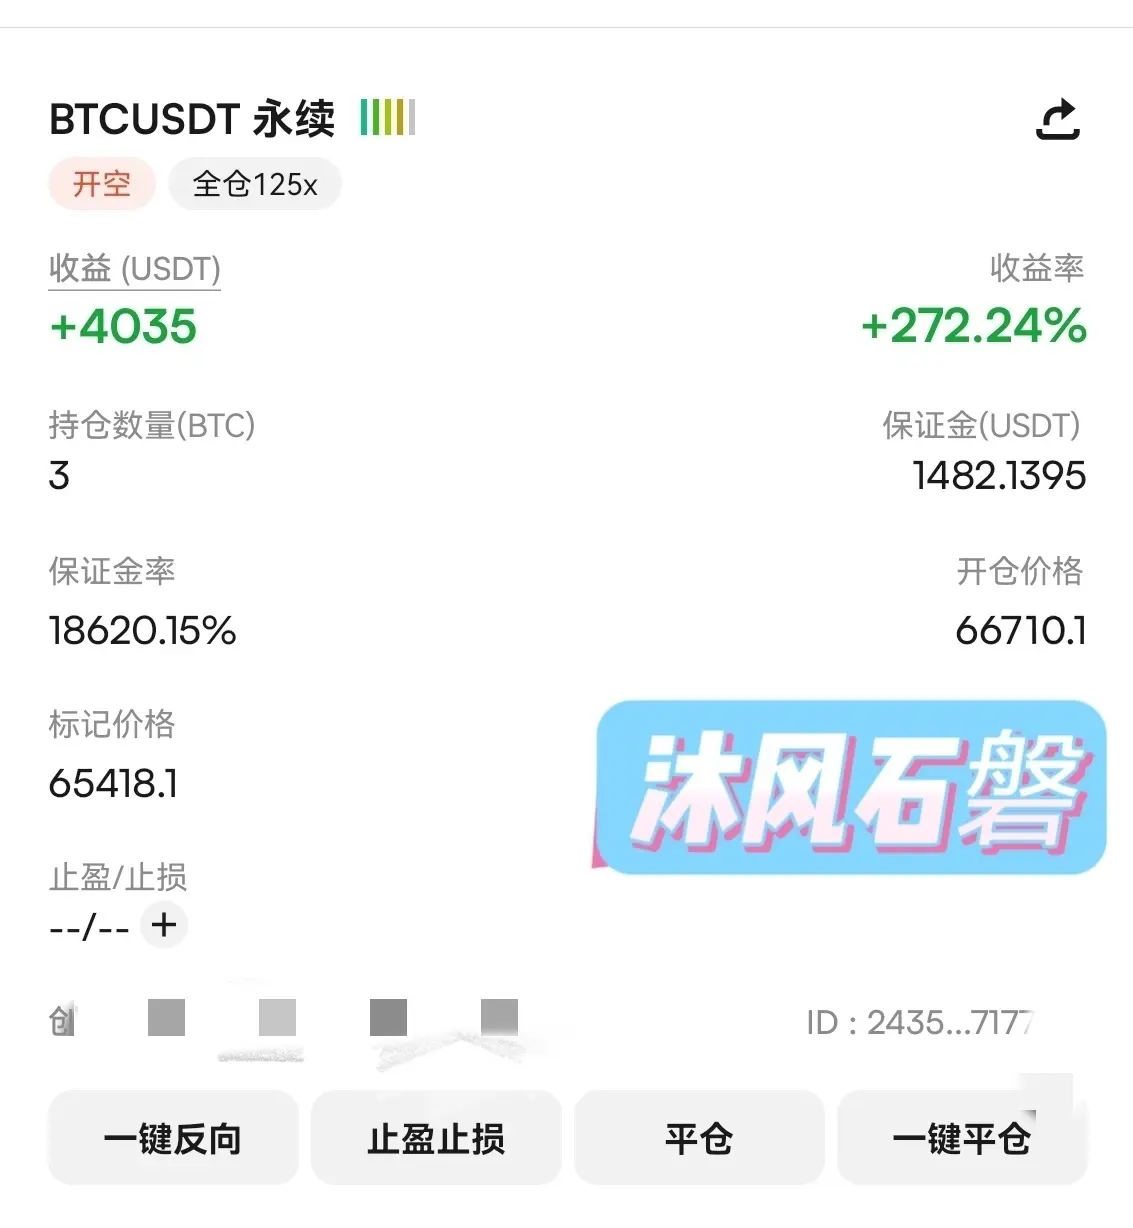
RongchuanMufeng
Monday's third order
Short on Bitcoin at 66,710, exited at 65,418, capturing 1,300 points
Successfully pocketed $4,000 U
View OriginalShort on Bitcoin at 66,710, exited at 65,418, capturing 1,300 points
Successfully pocketed $4,000 U


- Reward
- like
- Comment
- Repost
- Share
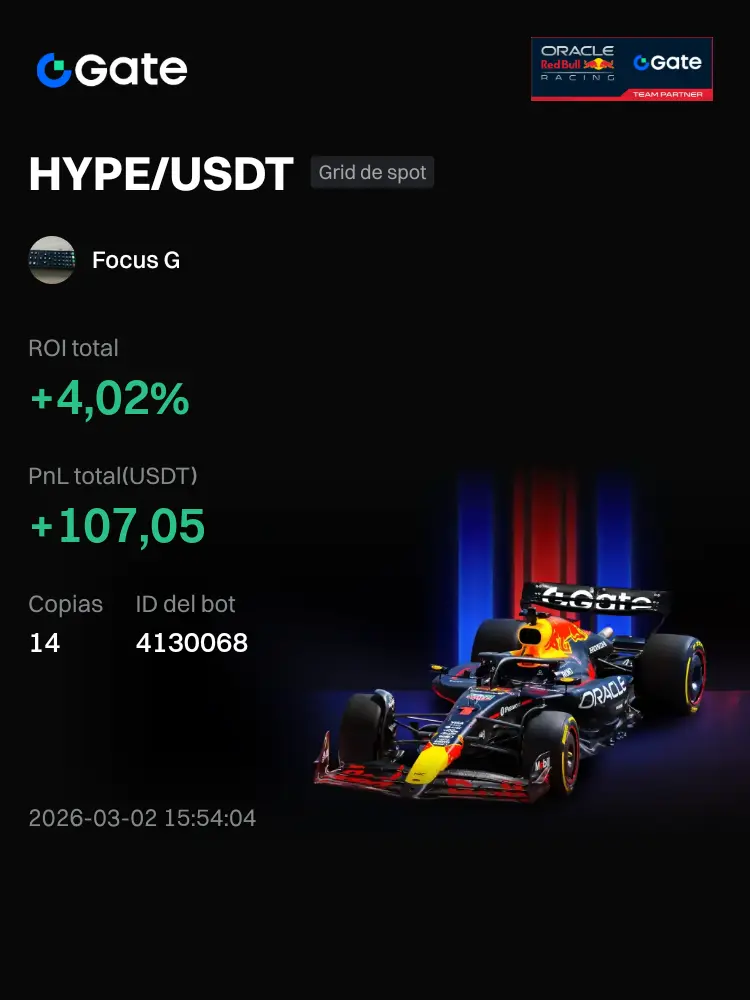
#Bots#Actualmente I am using the HYPE/USDT Spot Grid bot on Gate. The ROI since the bot was created has reached +4.02%. Firefighter in the storm. Holding onto the trunk.
HYPE2,77%

[The user has shared his/her trading data. Go to the App to view more.]
- Reward
- like
- Comment
- Repost
- Share
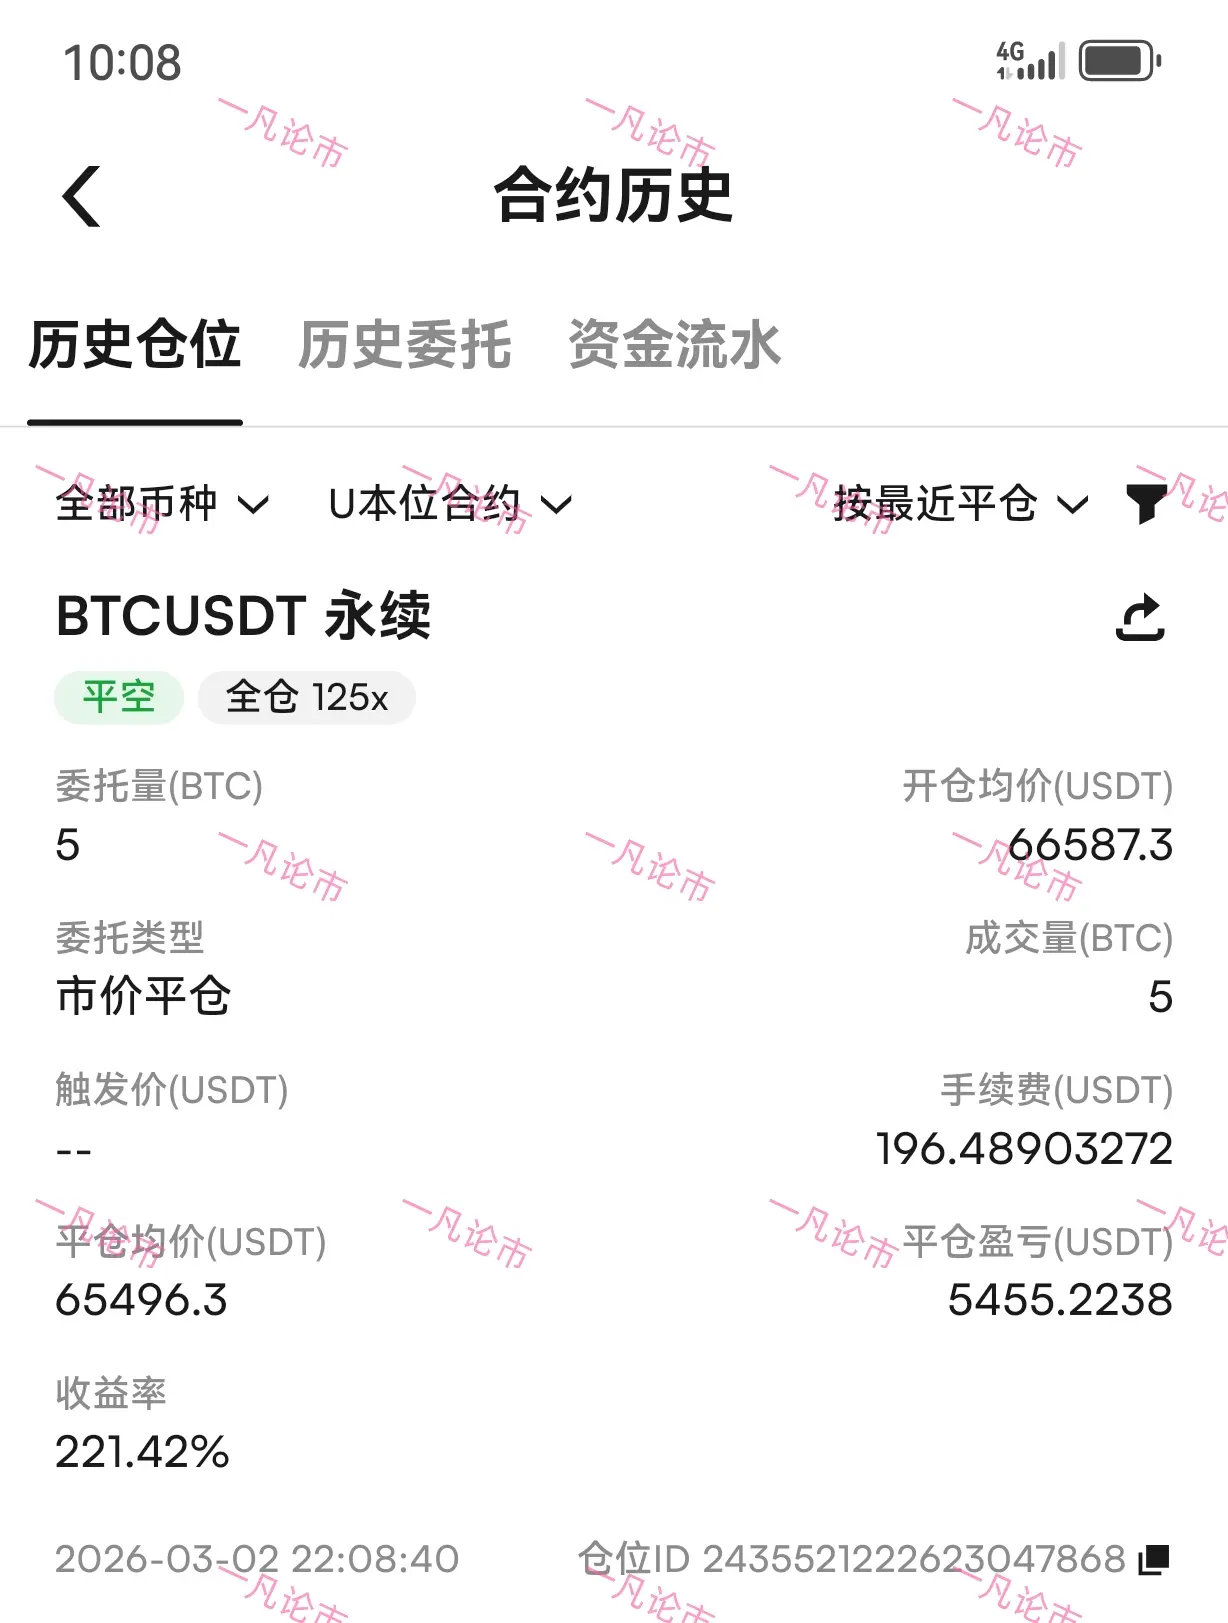
This market momentum is really steady, once again taking a thousand-point gain directly. Locking in profits at Lirun is the real deal!
Keep up the momentum, steadily make gains, and the road ahead will be a long rainbow!🚀
View OriginalKeep up the momentum, steadily make gains, and the road ahead will be a long rainbow!🚀
- Reward
- 3
- 1
- Repost
- Share
LuckyMindset :
:
Strongusdt
usdt
Created By@SamiFundation
Subscription Progress
0.00%
MC:
$0
More Tokens
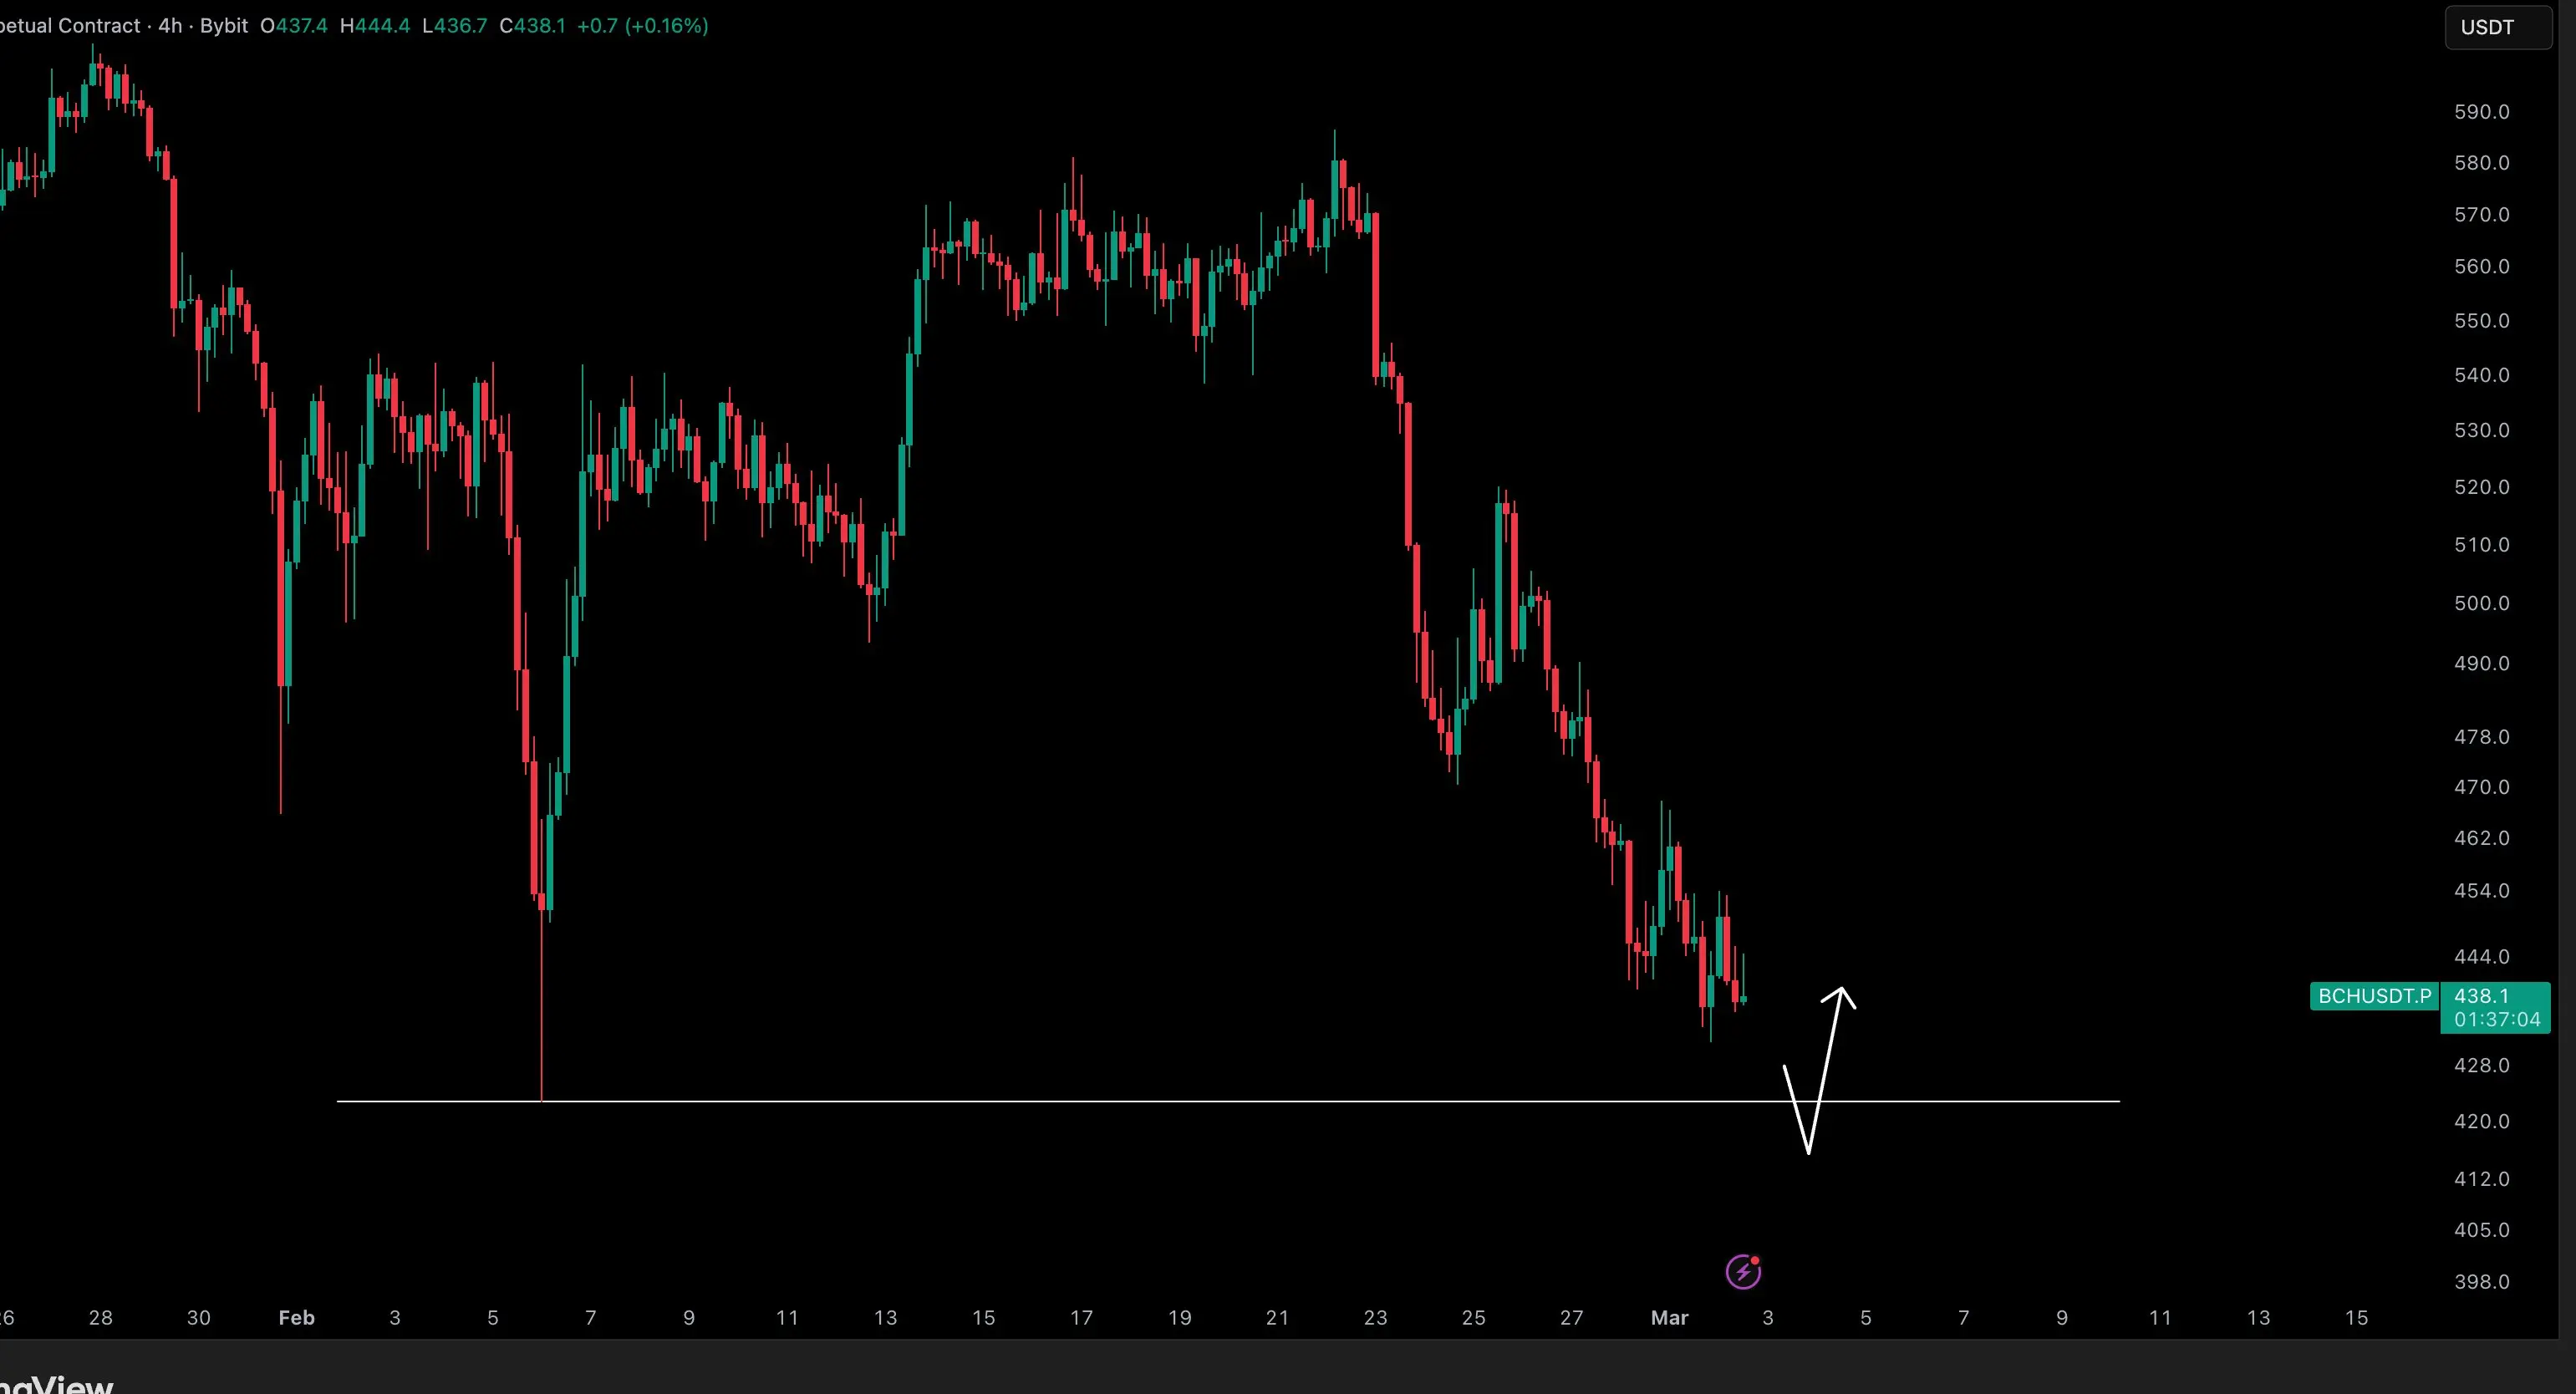
$BCH / $USD Analysis
Clear downtrend + lower highs forming.
Price hovering above key support.
If this level breaks → $420 is next.
Liquidity grab looks imminent.
#BCH #IranTensionsEscalate #PreciousMetalsAndOilPricesSurge #DeepCreationCamp
Clear downtrend + lower highs forming.
Price hovering above key support.
If this level breaks → $420 is next.
Liquidity grab looks imminent.
#BCH #IranTensionsEscalate #PreciousMetalsAndOilPricesSurge #DeepCreationCamp
BCH0,03%
- Reward
- 2
- Comment
- Repost
- Share
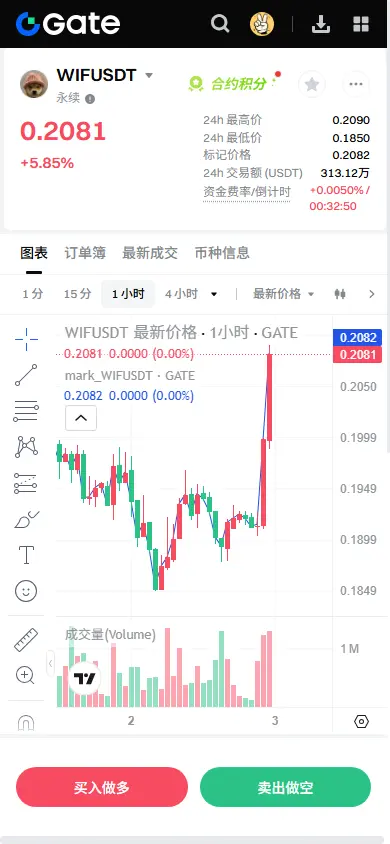
【$WIF Signal】Long - 1H volume breakout, main force clearly intends to support the market
$WIF The 1H timeframe has just experienced a volume breakout above the EMA20 and reached a new high, indicating strong momentum. Although the 4H timeframe is still in a consolidation zone, the latest large bullish candle has broken through the recent consolidation high, forming a short-term bullish structure. In a negative fee environment, prices remain firm and open interest (OI) is stable, suggesting main force support and potential short squeeze risk for bears.
🎯Direction: Long (Long)
⚡Entry/Order: 0.2
View Original$WIF The 1H timeframe has just experienced a volume breakout above the EMA20 and reached a new high, indicating strong momentum. Although the 4H timeframe is still in a consolidation zone, the latest large bullish candle has broken through the recent consolidation high, forming a short-term bullish structure. In a negative fee environment, prices remain firm and open interest (OI) is stable, suggesting main force support and potential short squeeze risk for bears.
🎯Direction: Long (Long)
⚡Entry/Order: 0.2
- Reward
- 1
- Comment
- Repost
- Share
🎉 Just 3 Days Left! Don’t Miss Gate Square’s $50,000 Red Packet Rain! 🧧
The excitement is real, and time is ticking! Gate Square is turning up the heat with its massive $50,000 Red Packet Rain, and the best part is every post you make is guaranteed to win rewards. That’s right, whether you’re a newcomer or a long-time Gate.io user, you have the opportunity to grab your share of this massive prize pool with absolutely no risk. And now, with higher reward caps and daily limits, the more you engage, the bigger your earnings can be.
If you’ve been waiting for the perfect chance to boost your cry
- Reward
- 3
- 2
- Repost
- Share
Yusfirah:
To The Moon 🌕View More
Over 1715+ production-ready skills, install with a single CLI command
Browser automation? Install
GitHub management? Install
Image generation? Install
OpenClaw is not AI, it's the operating system for AI
Skills are its App Store
If you, like me, find it too cumbersome to find skills one by one, then you must check out this GitHub repo ⬇️
View OriginalBrowser automation? Install
GitHub management? Install
Image generation? Install
OpenClaw is not AI, it's the operating system for AI
Skills are its App Store
If you, like me, find it too cumbersome to find skills one by one, then you must check out this GitHub repo ⬇️

- Reward
- 2
- Comment
- Repost
- Share
✍️ My words are firm and unchanging, and my analysis remains constant. The market is at 🟢.
The results of February 2026 recommendations will be published today, God willing.
If I achieve excellent results in the bear market, how can I delay the pump?
The essence of the pump is to exit and take profits for each coin with a separate chart 👌
View OriginalThe results of February 2026 recommendations will be published today, God willing.
If I achieve excellent results in the bear market, how can I delay the pump?
The essence of the pump is to exit and take profits for each coin with a separate chart 👌
- Reward
- 1
- Comment
- Repost
- Share
X
X314
Created By@GateUser-d04ebb81
Listing Progress
0.00%
MC:
$2.43K
More Tokens
Join us in the official live stream at 7 PM tomorrow night, brothers.
View Original
- Reward
- 2
- 9
- Repost
- Share
GateUser-8e32d51d:
Trump produces US dollars, Kim Jong-un also produces US dollars🤜🤛
View More
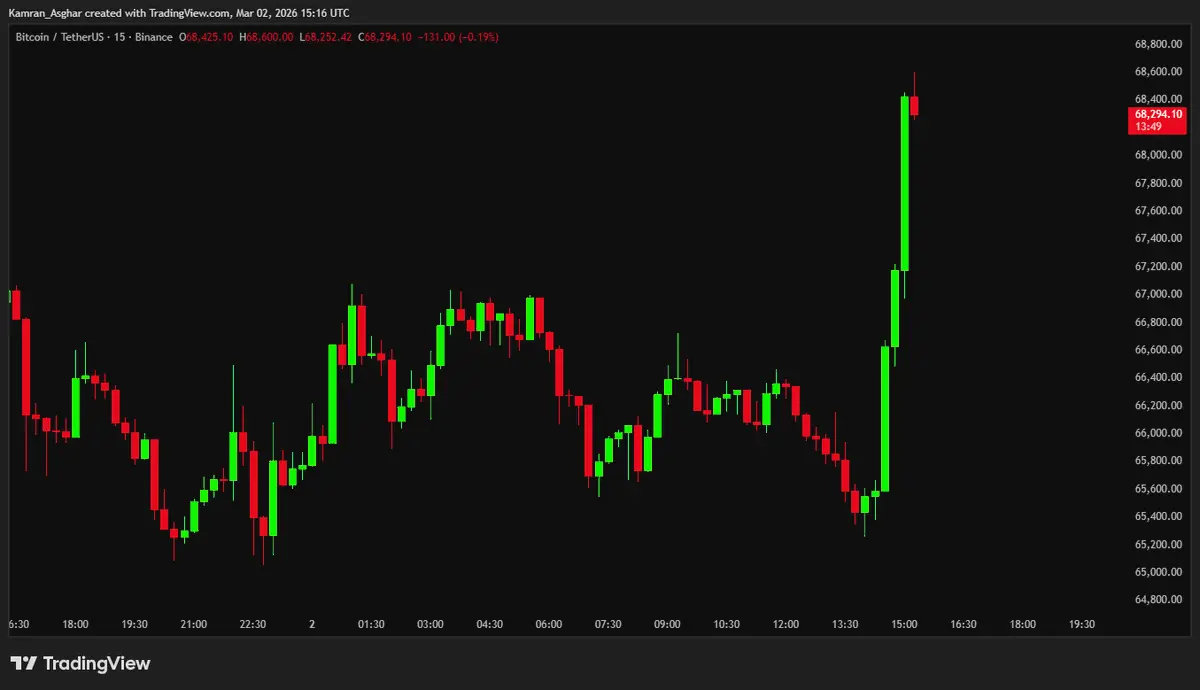
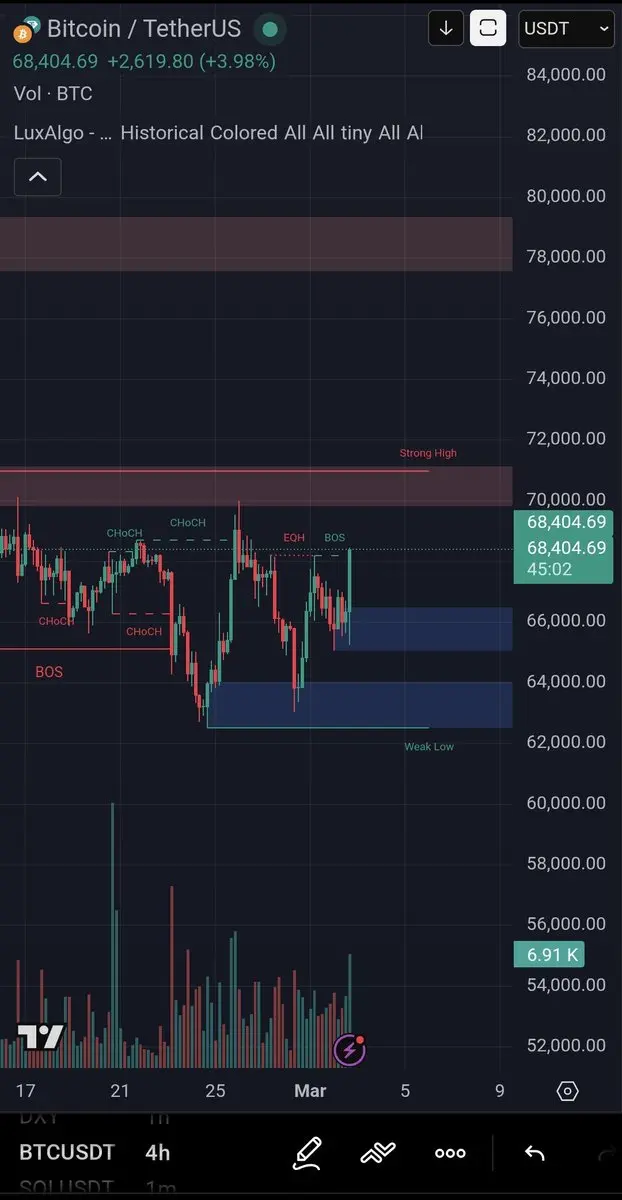
$BTC BTC 15-Minute Chart Analysis — Strong Rally Followed by High-Level Consolidation. Resistance Levels: First Resistance at $67,437 (Recent Rebound High, Short-Term Selling Pressure Zone), Strong Resistance at $67,653-$67,715 (Previous Volatility Platform, Mid-Term Key Resistance). Support Levels: First Support at $66,457-$66,616 (MA5/MA20 Range, Short-Term Bullish Defense Line), Strong Support at $66,241-$66,306 (MA100/MA50 Range, Critical Defensive Zone).
Technical Indicator Analysis: 1. Moving Averages: Short- and medium-term moving averages (MA5/MA10/MA20/MA30/MA50) are in a bullish alig
Technical Indicator Analysis: 1. Moving Averages: Short- and medium-term moving averages (MA5/MA10/MA20/MA30/MA50) are in a bullish alig
BTC3,4%
- Reward
- 1
- Comment
- Repost
- Share
List of stocks related to the Strait of Hormuz closure:
The stocks shown in the chart below do not constitute investment advice. Trade at your own risk. The chart is sourced from publicly available online sources. #贵金原油价格飙升
List of stocks related to the Strait of Hormuz closure:
The stocks shown in the chart below do not constitute investment advice. Trade at your own risk. The chart is sourced from publicly available online sources.
View OriginalThe stocks shown in the chart below do not constitute investment advice. Trade at your own risk. The chart is sourced from publicly available online sources. #贵金原油价格飙升
List of stocks related to the Strait of Hormuz closure:
The stocks shown in the chart below do not constitute investment advice. Trade at your own risk. The chart is sourced from publicly available online sources.


[The user has shared his/her trading data. Go to the App to view more.]
- Reward
- 1
- Comment
- Repost
- Share
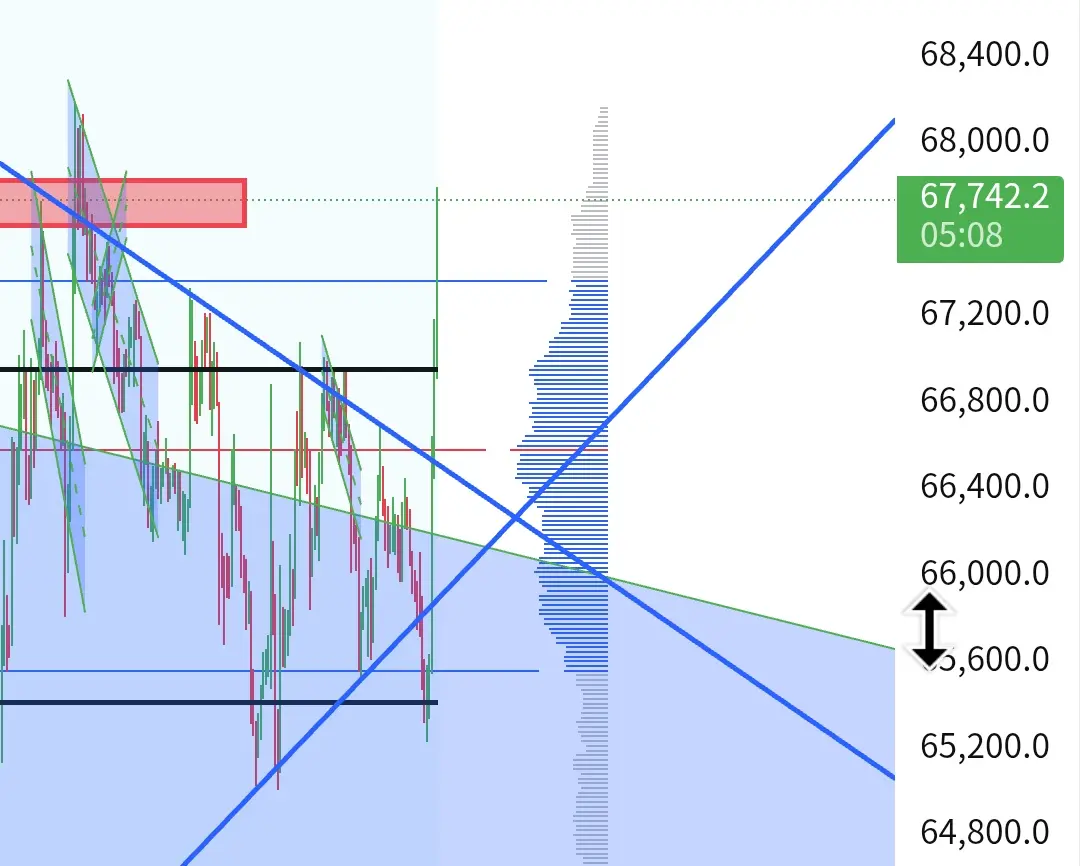
The red box is no longer empty. Once he finishes placing the stop-loss on that cluster above, it will dip to around 69,000. It hasn't exploded yet.
View Original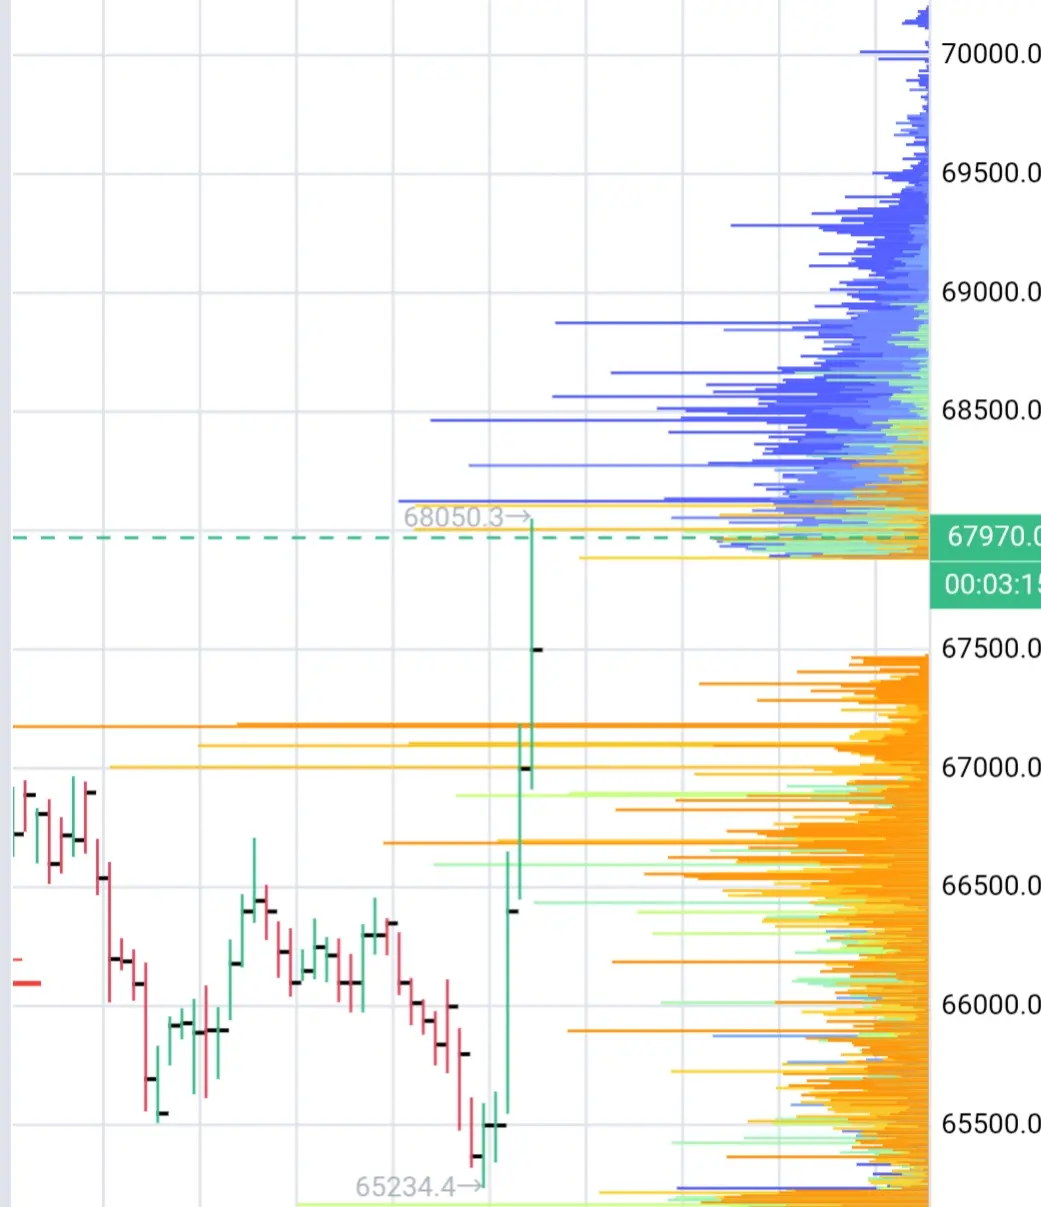
- Reward
- like
- Comment
- Repost
- Share
🎉 Gate Square 50,000 Red Packet Giveaway! 🧧
🔥 Exciting news for all crypto enthusiasts! Gate Square is giving away a total of 50,000 Red Packets! Don’t miss your chance to grab your share of rewards.
How to Participate:
1️⃣ Log in to your Gate Square account.
2️⃣ Go to the Red Packet section.
3️⃣ Claim your Red Packet before it’s gone!
💰 Rewards are limited — first come, first served!
📅 Event Duration: March 2 – March 10, 2026 (UTC+8)
👉 Tag your friends and let them join the fun!

- Reward
- 5
- 7
- Repost
- Share
ShainingMoon:
LFG 🔥View More
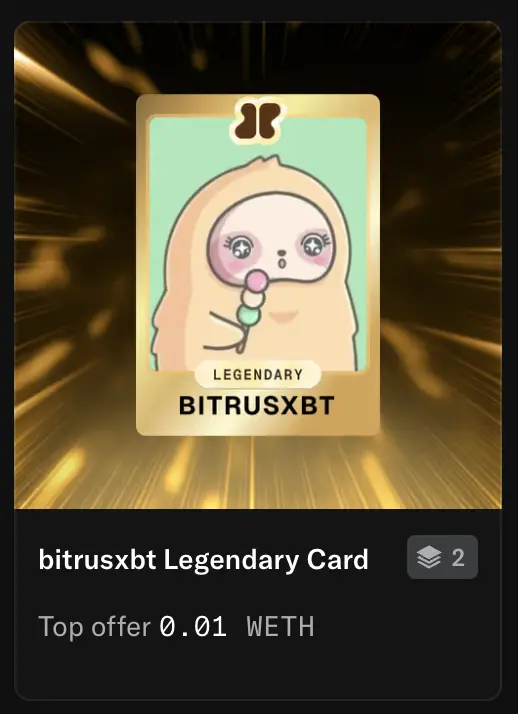
2 people own my Legendary card ($0.01ETH)
9 people hold my rare card
38 people hold my common card
Welcome to the squad, 49 xeeters and counting
Do you hold any of my card yet?
9 people hold my rare card
38 people hold my common card
Welcome to the squad, 49 xeeters and counting
Do you hold any of my card yet?
- Reward
- 1
- Comment
- Repost
- Share
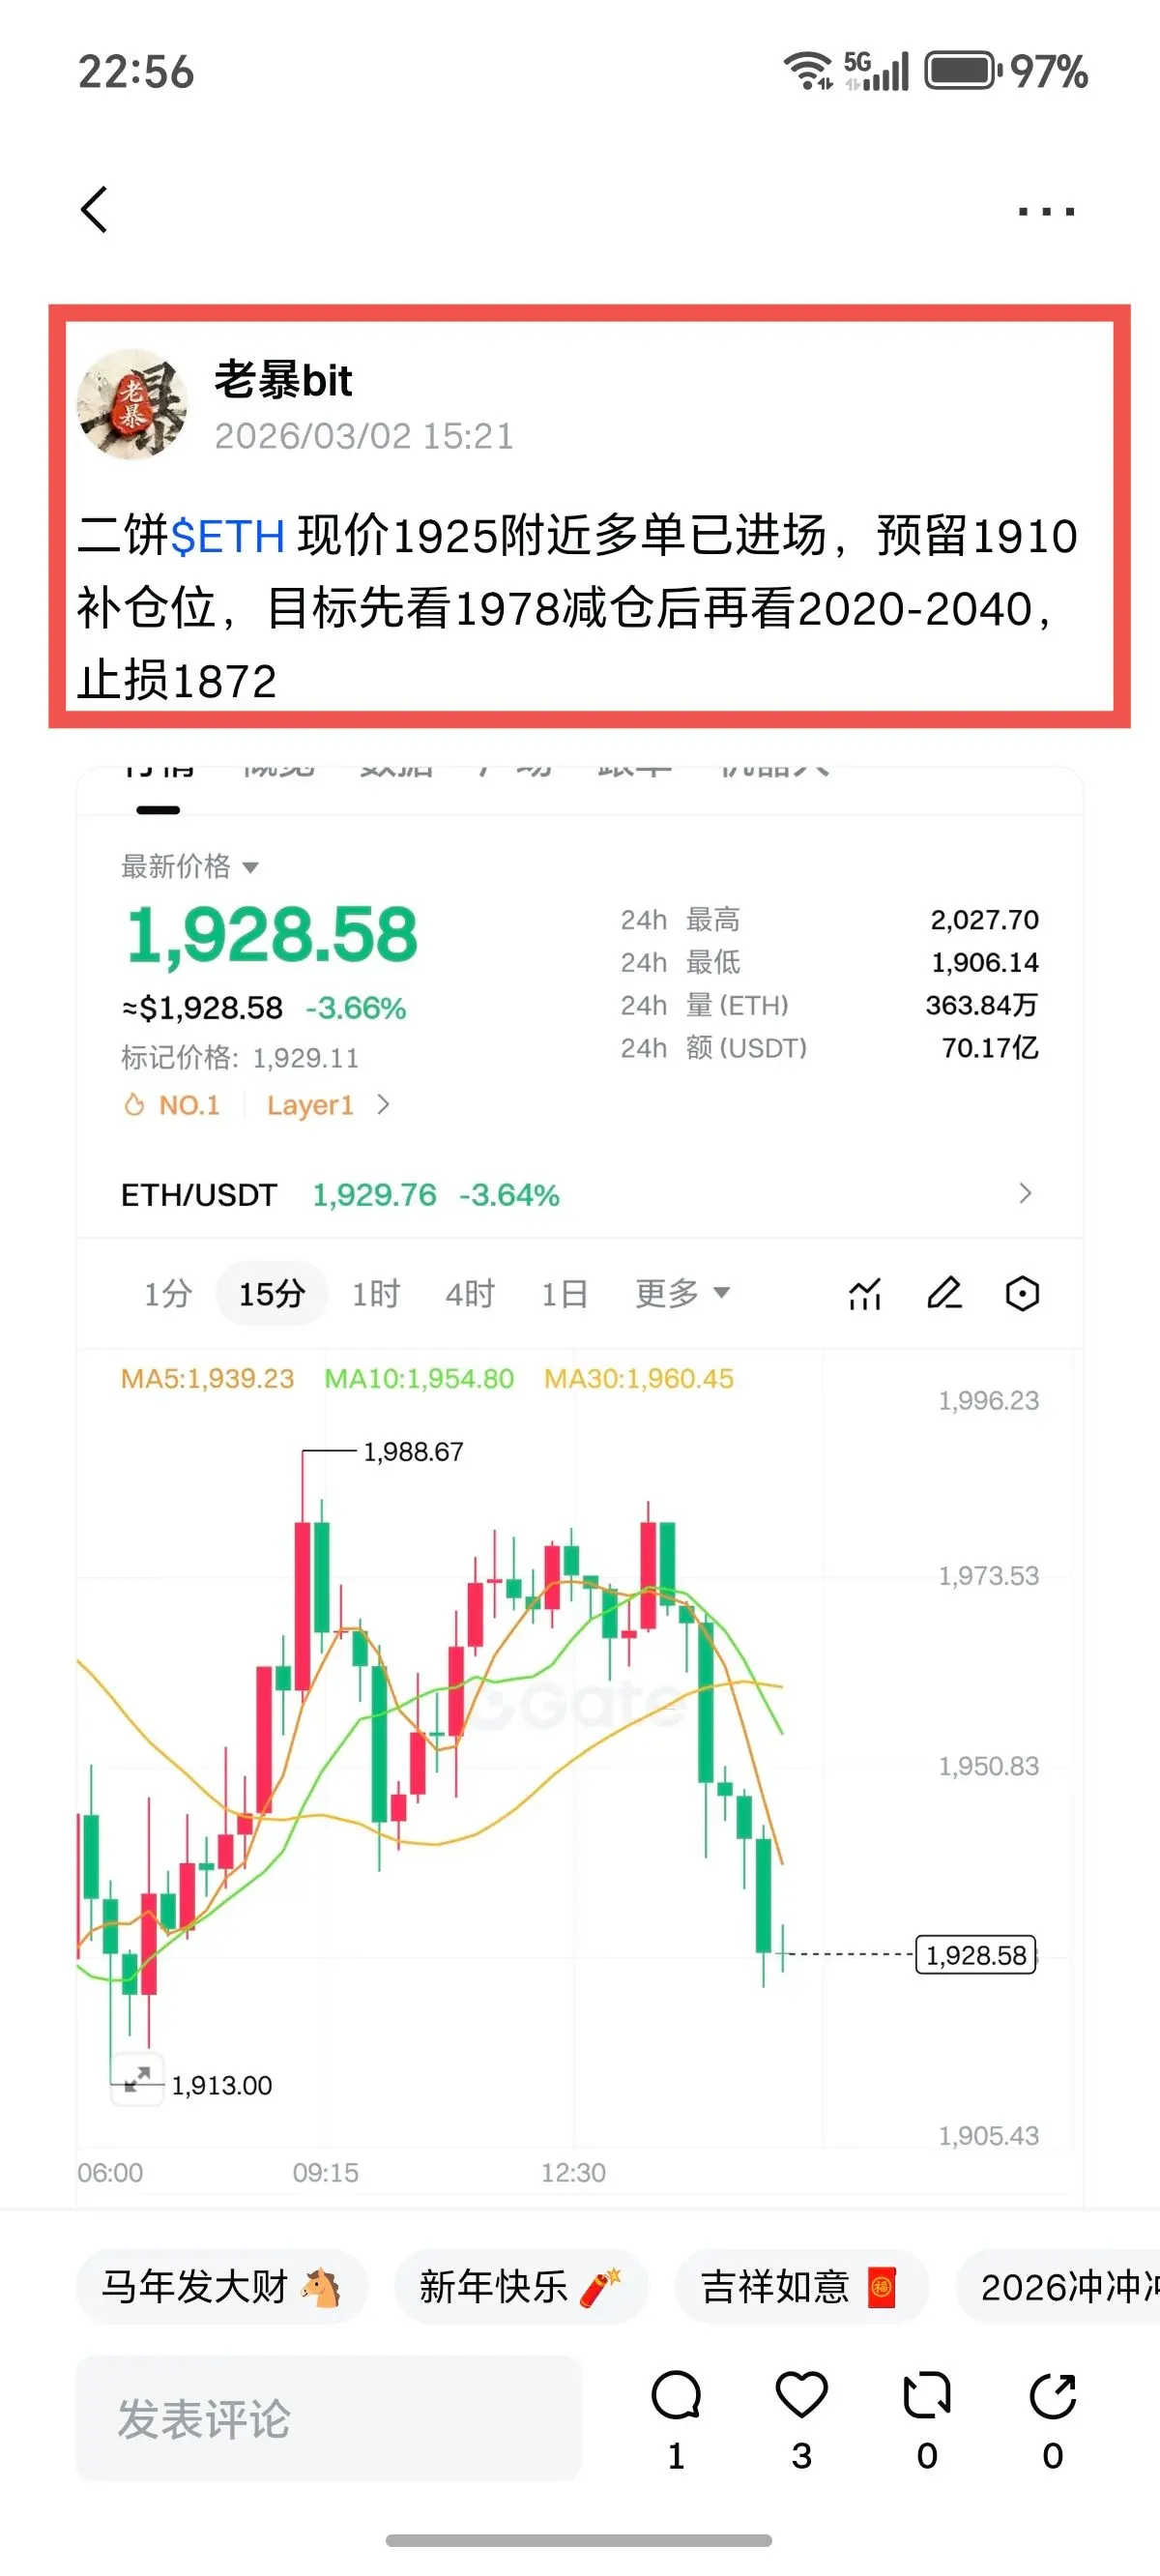
ETH 1925 long position, first target 1978, take profit and reduce 60%, lock in gains. Hold the remaining position with a break-even stop, expecting to reach 2020–2040. The public order is being executed simultaneously. Congratulations to friends who are following the trades and making profits $ETH
ETH2,8%

- Reward
- 4
- 1
- Repost
- Share
GateUser-1fb12ea6 :
:
Impressive👍Load More
Join 40M users in our growing community
⚡️ Join 40M users in the crypto craze discussion
💬 Engage with your favorite top creators
👍 See what interests you
Trending Topics
View More343.74K Popularity
96.06K Popularity
170.74K Popularity
10.95M Popularity
14.53K Popularity
News
View MoreTraditional Finance Drop Alert: XAGUSD Falls Over 6%
4 m
The US Dollar Index (DXY) surged 1% intraday, now at 98.65
4 m
The alliance of 12 EU banks, Qivalis, plans to launch a euro stablecoin in the second half of this year.
6 m
Trump: We are surprised by Iran's attacks on Arab countries
6 m
Ruck increased by 108.22% after launching Alpha, current price is 0.0008920 USDT
8 m
Pin