
Key Highlights
-
Worldcoin (WLD) surged nearly 8% as the broader crypto market turned bullish
-
Daily chart shows a well-formed inverse head and shoulders pattern
-
Price is consolidating below a key neckline resistance at $0.64–$0.6640
-
A confirmed breakout could open the door for a move toward $0.85+
-
Macro tailwinds from cooling U.S. inflation are supporting risk assets
The broader crypto market is showing renewed strength today (January 14, 2026), with Bitcoin (BTC) up nearly 3% and Ethereum (ETH) gaining around 6% over the past 24 hours. Altcoins are following suit, and Worldcoin (WLD) has emerged as one of the notable movers, jumping close to 8% during the session.
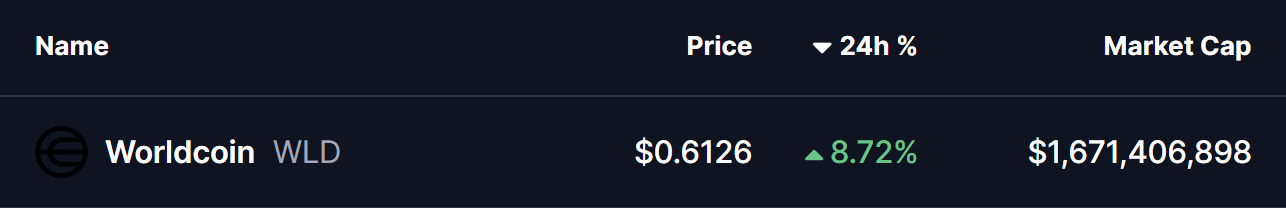
Source: Coinmarketcap
This market-wide lift comes on the back of the latest U.S. CPI data released on January 13, which showed inflation continuing to cool. Headline CPI for December 2025 came in steady at 2.7% year-over-year, matching November, while core CPI edged up modestly to 2.6% YoY. Monthly figures also aligned with expectations, reinforcing the view that macro pressure may be easing.
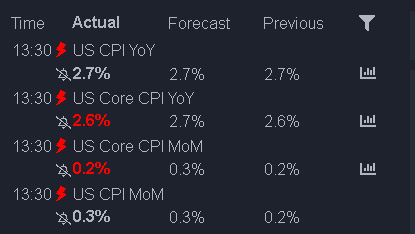
US CPI Data/Source: @camelfinance (X)
Against this improving backdrop, WLD’s chart is beginning to flash a technically constructive setup that could support further upside if key levels are reclaimed.
Inverse Head and Shoulders Pattern Takes Shape
On the daily timeframe, Worldcoin is printing a well-defined inverse head and shoulders pattern — a structure often associated with trend reversals after prolonged downside moves.
The left shoulder formed early last month around the $0.5550 area, followed by a deeper sell-off toward roughly $0.4750, which marked the head of the formation. From there, price rebounded and later carved out a higher low near $0.5550 again, forming the right shoulder.
Since completing the right shoulder, WLD has steadily pushed higher and managed to reclaim the 50-day moving average, which is now acting as short-term support. Price is currently consolidating just below a critical resistance zone around $0.64–$0.6640 — the neckline of the inverse head and shoulders pattern.
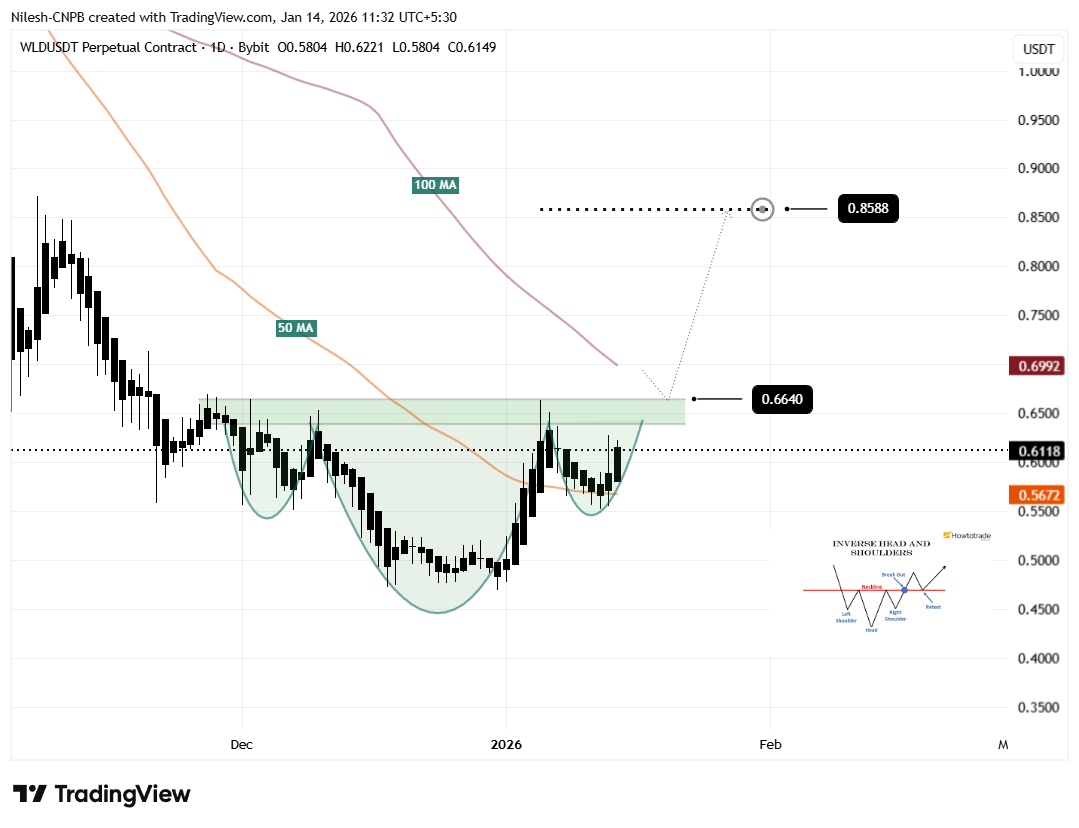
Worldcoin (WLD) Daily Chart/Coinsprobe (Source: Tradingview)
This neckline has capped upside attempts multiple times over the past month, making it a well-established supply zone. A clean daily close above this band would confirm the pattern and shift the technical bias decisively bullish.
What’s Next for Worldcoin (WLD)?
Beyond the neckline, the 100-day moving average near $0.6992 stands out as the next major hurdle. Reclaiming this level would strengthen the breakout narrative and signal that momentum is shifting back in favor of buyers.
Based on the measured move of the inverse head and shoulders structure, a confirmed breakout could open the door for a rally toward the $0.8588 region. That would represent roughly a 40% upside move from the neckline area, aligning with the projection highlighted on the chart.
On the downside, failure to clear the $0.64–$0.6640 zone could keep WLD range-bound, with the 50 day ma region remaining an important support to hold in order to preserve the bullish structure.
Bottom Line
For now, WLD appears to be coiling beneath resistance while the broader market momentum remains supportive. A decisive breakout above the neckline, followed by a successful retest and reclaim of the 100-day moving average, would likely act as the trigger for the next leg higher.
Until then, the neckline remains the key battleground. How price behaves around this zone will likely determine whether Worldcoin transitions into a sustained recovery or continues consolidating.
Frequently Asked Questions (FAQ)
What is happening with Worldcoin (WLD) price?
Worldcoin is showing bullish momentum as an inverse head and shoulders pattern forms on the daily chart, suggesting a potential trend reversal.
Is Worldcoin forming a bullish pattern?
Yes, WLD is forming an inverse head and shoulders pattern, which is widely considered a reliable bullish reversal structure.
What price level confirms a WLD breakout?
A daily close above the $0.64–$0.6640 neckline would confirm the bullish breakout.
What is the upside target for Worldcoin?
If the pattern confirms, the projected upside target sits near $0.8588, representing roughly 40% upside from the neckline.
What could invalidate the bullish setup?
Failure to break above the neckline and a drop below the $0.5550 support area could weaken or invalidate the bullish structure.
Disclaimer: The views and analysis presented in this article are for informational purposes only and reflect the author’s perspective, not financial advice. Technical patterns and indicators discussed are subject to market volatility and may or may not yield the anticipated results. Investors are advised to exercise caution, conduct independent research, and make decisions aligned with their individual risk tolerance.
About Author: Nilesh Hembade is the Founder and Lead Author of Coinsprobe, with over 5 years of experience in the cryptocurrency and blockchain industry. Since launching Coinsprobe in 2023, he has been providing daily, research-driven insights through in-depth market analysis, on-chain data, and technical research.
Disclaimer: The information on this page may come from third parties and does not represent the views or opinions of Gate. The content displayed on this page is for reference only and does not constitute any financial, investment, or legal advice. Gate does not guarantee the accuracy or completeness of the information and shall not be liable for any losses arising from the use of this information. Virtual asset investments carry high risks and are subject to significant price volatility. You may lose all of your invested principal. Please fully understand the relevant risks and make prudent decisions based on your own financial situation and risk tolerance. For details, please refer to
Disclaimer.
Related Articles
Why OGN Just Moons 17.7% in 60 Minutes
OGN has surged 17.7% to $0.02294, with a 24-hour increase of 21.12% and trading volume reaching $662,137.16. Market trends and increased trader activity contribute to this volatility, with traders monitoring key resistance and support levels for future movements.
Coinfomania5m ago
Analyst Says XRP Is ‘Criminally Undervalued’ as RSI Drops
Analyst says XRP RSI reached oversold levels last seen during the 2022 bear market bottom.
XRP trades near $1.39 with key support at $1.30–$1.35 and resistance between $1.45 and $1.70.
Price has declined from about $3.10 since Sept 2025, forming a prolonged downward trend.
XRP trades near
CryptoFrontNews23m ago
'Rich Dad Poor Dad' Author: Bitcoin Will Go Up After 'Giant Crash' - U.Today
Robert Kiyosaki warns of an imminent economic crash, suggesting it’s a buying opportunity. He highlights Warren Buffett’s cash reserves and believes prices for gold, silver, and Bitcoin will rise post-crash, despite facing backlash over his investment claims.
UToday48m ago
DWF Labs: Traditional Altseason Coming to an End, Institutional Capital Shifting to BTC, ETH, and RWA
Andrei Grachev from DWF Labs points out that the traditional "altseason" is gradually disappearing due to structural changes in the crypto market. Institutional capital increasingly favors Bitcoin and Ethereum, exposing altcoins to higher risks and capital outflows. Over the past 13 months, altcoin market capitalization has declined by over $209 billion.
GateNews1h ago
Bitcoin rose 8.55% this week, potentially marking the largest single-week gain since September 2025
Gate News reported on March 15 that according to Coinglass data, Bitcoin's weekly return rate is currently at 8.55%, with a historical average return rate of -1.03%. Despite the escalating Iran-Israel conflict and prevailing risk-averse sentiment in the market, Bitcoin is poised to record its largest single-week gain since September 2025. During the same period, the S&P 500 index (the benchmark index for the U.S. stock market) declined by 1.60%, with BTC's performance significantly outperforming the U.S. stock market.
GateNews1h ago
AI Predicts Where ADA Price Is Headed Next After Cardano’s Technical Flip
Something just changed on Cardano’s 4-hour chart. The ADA price climbed 1.61% in the last few hours, closing at $0.2649. More importantly, it broke above two key moving averages, and the AI tool used by a well-known community analyst just turned positive.
Vincent van Code, a software
CaptainAltcoin1h ago