
Date: Thu, Dec 18, 2025 | 11:00 AM GMT
The broader cryptocurrency market has been experiencing choppy price action over the past several weeks, a phase that began after the sharp sell-off on October 10. That correction dragged Ethereum (ETH) down by nearly 27% over the last 60 days, keeping sustained pressure on major altcoins, including DEX token** Aster ($ASTER).**
ASTER has fallen more than 25% over a week alone, extending its 60-day decline to roughly 42%. While the short-term trend remains firmly bearish, a closer look at the chart suggests something more constructive may be developing beneath the surface.
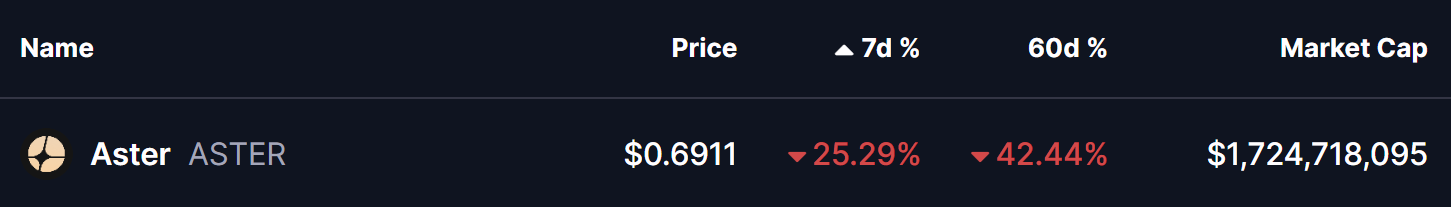
Source: Coinmarketcap
Interestingly, ASTER’s current structure is beginning to resemble the bottoming pattern previously seen in Hyperliquid (HYPE), a setup that ultimately led to a powerful trend reversal earlier this year.
ASTER Mirrors HYPE’s Bottoming Path
Aster appears to be tracing a price structure that closely aligns with HYPE’s April 2025 fractal — a period that preceded a multi-hundred-percent rally.
HYPE’s move began with a sharp correction following its all-time high. That decline eventually forced price below the 50-day moving average, confirming a shift in momentum. Rather than collapsing further in a straight line, HYPE transitioned into a rounding bottom structure, reflecting a gradual slowdown in selling pressure and the early stages of accumulation.
The token ultimately found its floor after a steep 73% drawdown from its peak, a point that marked clear seller exhaustion. From there, momentum shifted decisively. A clean reclaim of the 50-day moving average acted as the key confirmation signal, setting the stage for a breakout from the rounding bottom. What followed was a powerful 434% rally, making it one of HYPE’s most notable reversals of the year.

HYPE and ASTER Fractal Chart/Coinsprobe (Source: Tradingview)
Now, ASTER appears to be walking a similar road.
After topping out near its all-time high around $2.42, ASTER entered a prolonged corrective phase and slipped below its 50-day moving average. The chart now shows price carving out a potential rounding bottom, with the $1.30–$1.40 region acting as a key neckline zone. This structure closely mirrors HYPE’s pre-bottom behavior, as highlighted in the comparative chart.
What’s Next for ASTER?
If this fractal continues to unfold, ASTER may still face some near-term downside pressure. A deeper move toward the $0.60 area would complete a decline of roughly 73% from its all-time high — the same magnitude of correction where HYPE previously established its bottom.
From a bullish standpoint, the first meaningful signal to watch is a reclaim of the 50-day moving average, currently hovering near the $1.04 level. A sustained move above this zone would suggest that bearish momentum is weakening. If followed by a decisive breakout above the neckline resistance, ASTER could transition into a broader recovery phase, potentially echoing the type of upside expansion HYPE experienced after confirming its reversal.
Key Risk Note
While fractal similarities can offer valuable context, they do not guarantee identical outcomes. Market conditions, liquidity dynamics, and broader sentiment can differ significantly from one asset to another. Confirmation remains critical, and downside invalidation levels should be respected if the structure fails to hold.
For now, ASTER appears to be approaching a critical inflection point. Whether this evolving structure turns into a confirmed bottom or merely a pause before further weakness will depend on how price behaves around its moving averages and key support zones in the days ahead.
Disclaimer: The views and analysis presented in this article are for informational purposes only and reflect the author’s perspective, not financial advice. Technical patterns and indicators discussed are subject to market volatility and may or may not yield the anticipated results. Investors are advised to exercise caution, conduct independent research, and make decisions aligned with their individual risk tolerance.
Disclaimer: The information on this page may come from third parties and does not represent the views or opinions of Gate. The content displayed on this page is for reference only and does not constitute any financial, investment, or legal advice. Gate does not guarantee the accuracy or completeness of the information and shall not be liable for any losses arising from the use of this information. Virtual asset investments carry high risks and are subject to significant price volatility. You may lose all of your invested principal. Please fully understand the relevant risks and make prudent decisions based on your own financial situation and risk tolerance. For details, please refer to
Disclaimer.
Related Articles
XRP Today News: Leverage Ratio Drops 78% Sharply, On-Chain Transaction Volume Hits a New Annual High
XRP derivatives market leverage drops to its lowest level in nearly nine months, indicating that the market overheating pressure is easing. At the same time, XRPL’s weekly transaction volume reaches 19 million, driven by Ripple’s business progress and new partnerships. However, the technical risk XRP faces lies in its head-and-shoulders top pattern; the key support level is between $1.37 and $1.40, and a break below could lead to a pullback.
MarketWhisper32m ago
The price of HYPE is facing a risk of a 37% decrease as capital flow turns negative.
Hyperliquid (HYPE) is currently trading around $39, down 2.79%, with a double top formation indicating potential decline. A significant short liquidation zone at $42 acts as resistance, while dwindling CMF shows a shift to negative cash flow, suggesting a possible drop to $21 unless the price exceeds $42.
TapChiBitcoin1h ago
Crypto Fear Index rises to 13, market "fear" sentiment slightly eases
BlockBeats News, March 27 — According to Alternative data, today’s cryptocurrency Fear and Greed Index is 13 (yesterday was 10), indicating a slight easing of market "fear" sentiment.
Note: The Fear and Greed Index threshold is 0-100, including indicators: volatility (25%), market trading volume (25%), social media buzz (15%), market surveys (15%), Bitcoin’s proportion in the overall market (10%), and Google trending searches analysis (10%).
BlockBeatNews1h ago
Peter Brandt: Bitcoin shows a sell signal
Renowned trader Peter Brandt posted a chart indicating that Bitcoin's price is forming an ascending wedge pattern, suggesting a possible decline. The current price is in the $65,000-$70,000 range, and Brandt previously accurately predicted a short-term rebound for Bitcoin.
BlockBeatNews1h ago
The current mainstream CEX and DEX funding rates indicate that the market bearish sentiment has weakened.
According to BlockBeats, Bitcoin prices have slightly declined, and the funding rates on major exchanges indicate a weakening of the bearish market sentiment. The funding rate is a mechanism that adjusts the difference between the contract price and the underlying asset price.
BlockBeatNews1h ago
