Le Bitcoin (BTC) se négocie actuellement à 114 390 $, ayant augmenté de près de 1 % au cours des 24 dernières heures, avec un volume de trading proche de 69,6 milliards de dollars. Bien qu’un rebond à court terme offre un certain répit, les graphiques techniques montrent que le BTC continue de lutter entre des niveaux de support et de résistance clés. L’attention du marché est portée sur la capacité du support de la ligne de cou à 112 000 $ à tenir, ainsi que sur la question de savoir si l’objectif à long terme de 1 million de dollars pour 2030 proposé par Brian Armstrong est réaliste.
Analyse Technique : 112 000 dollars comme point de basculement entre acheteurs et vendeurs
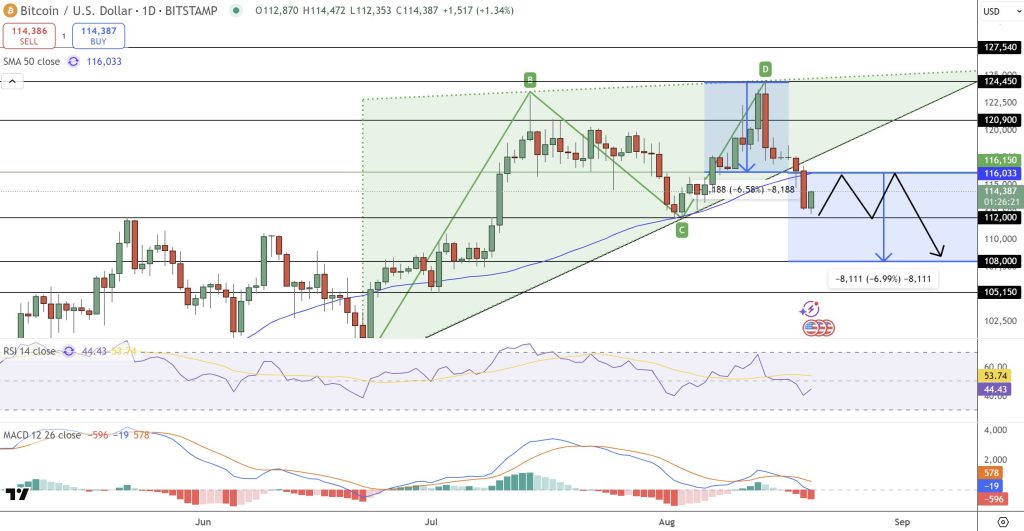
(source : Trading View)
* Tendance à court terme
BTC a déjà franchi la moyenne mobile sur 50 jours ($116,033), cette moyenne mobile est devenue une résistance.
Une bougie englobante baissière s’est formée à $124,450, montrant un affaiblissement de l’élan de rebond de juillet.
Sur le plan technique, la ligne de cou potentielle de la “forme en tête et épaules” près de 112 000 dollars est clé, et une fois qu’elle est franchie, cela pourrait accélérer la descente vers 108 000 $, voire 105 150 $.
* Indicateur de Momentum
MACD : Entrée dans la zone négative, indiquant un renforcement de l’élan baissier.
RSI : situé à 44, il y a encore de l’espace à la baisse.
Structure des bougies K : une formation baissière continue similaire à « trois corbeaux noirs », généralement associée à un retracement plus profond.
Structure à long terme : les haussiers conservent encore leur jeton
Malgré la pression accrue à court terme, le BTC maintient néanmoins une structure de creux plus élevée depuis juin.
Un petit doji autour de 113 000 dollars : montre une hésitation du marché plutôt qu’une vente panique.
Rebond cible : si les acheteurs poussent le BTC à récupérer $116,150, il y a des chances de défier $120,900 → $124,450 → $127,540, et finalement tester $130,000.
Fondamentaux : La vision d’un million de dollars d’Armstrong
Brian Armstrong a déclaré le 20 août qu’il s’attendait à ce que le prix unitaire du BTC atteigne 1 million de dollars d’ici 2030, et a souligné :
1, le taux d’adoption continue d’augmenter
-
Innovation technologique et expansion des cas d’application
-
Diminution de l’offre et effet d’accumulation sur le marché
Bien qu’il admette que ce n’est qu’une “idée générale dans son esprit”, cela reflète la grande confiance des principaux acteurs du marché dans la valeur à long terme de BTC.
Stratégies de Trading et Conseils d’Investissement
* Trader à court terme
Stratégie haussière : si le prix de clôture est supérieur à $116,000, on peut acheter jusqu’à la plage de $124,000-$130,000.
Stratégie de vente à découvert : si le prix de clôture est inférieur à $112,000, vous pouvez vendre à découvert jusqu’à $108,000-$105,000.
* investisseurs à long terme
La plage actuelle peut être considérée comme une zone d’accumulation dans un plus grand marché haussier.
Achetez par paliers lors des baisses, en surveillant les politiques macroéconomiques, les flux de fonds des ETF et les variations des données en chaîne.
Conclusion
Bitcoin est à un point technique clé : le support de 112 000 $ est le point de basculement de la tendance à court terme, tandis que la résistance de 116 000 $ est la clé pour relancer l’attaque. La tendance à court terme pourrait encore fluctuer, mais d’après la prévision à long terme d’Armstrong de 1 million de dollars et la baisse continue de l’offre en chaîne, l’histoire à long terme de BTC reste solide. Pour les traders, c’est une occasion de saisir précisément la rupture de la plage ; pour les investisseurs à long terme, c’est un processus d’attente patiente pour la réalisation de la valeur.
Avertissement : Les informations contenues dans cette page peuvent provenir de tiers et ne représentent pas les points de vue ou les opinions de Gate. Le contenu de cette page est fourni à titre de référence uniquement et ne constitue pas un conseil financier, d'investissement ou juridique. Gate ne garantit pas l'exactitude ou l'exhaustivité des informations et n'est pas responsable des pertes résultant de l'utilisation de ces informations. Les investissements en actifs virtuels comportent des risques élevés et sont soumis à une forte volatilité des prix. Vous pouvez perdre la totalité du capital investi. Veuillez comprendre pleinement les risques pertinents et prendre des décisions prudentes en fonction de votre propre situation financière et de votre tolérance au risque. Pour plus de détails, veuillez consulter l'
avertissement.
