
Ethena has started to draw attention again after holding close to the $0.10 level despite recent weakness across several altcoins. ENA price has moved through a quiet stretch over the past week, and that type of behavior often signals a market that is deciding its next direction. Traders now look at whether this range could lead to a breakout or another leg lower in the coming months.
A recent analysis shared by a market analyst explains the current position of Ethena in more detail. shows that ENA price traded near $0.11 a week ago and now sits around $0.10. That move represents a small pullback rather than a major breakdown.
The structure tells a more important story. The 7-day moving average sits close to the current price, which points to short-term stability. The 30-day average sits much higher, near $0.30, which shows that ENA price still trades well below previous levels.
This gap between short-term and longer-term averages often appears when a market begins to stabilise after a larger decline.
- ENA Price Momentum Indicators Show Neutral Conditions After Recent Bounce
- Key Support And Resistance Levels Define ENA Price Path In 2026
- Three Possible Scenarios Show How ENA Price Could Evolve In The Coming Months
ENA Price Momentum Indicators Show Neutral Conditions After Recent Bounce
The last 24 hours added another piece to the picture. ENA price moved up about 2.6% with trading volume holding above $200 million. That combination suggests that buyers have stepped in, though not with enough strength to force a clear breakout.
Momentum indicators support that view. RSI sits near 48, which places it close to neutral territory. MACD remains slightly negative, which indicates that upward pressure has not yet taken full control.
A look at the daily pivot level near $0.101 shows that ENA price trades just below that mark. That position keeps the short term bias slightly tilted to the downside despite the recent bounce
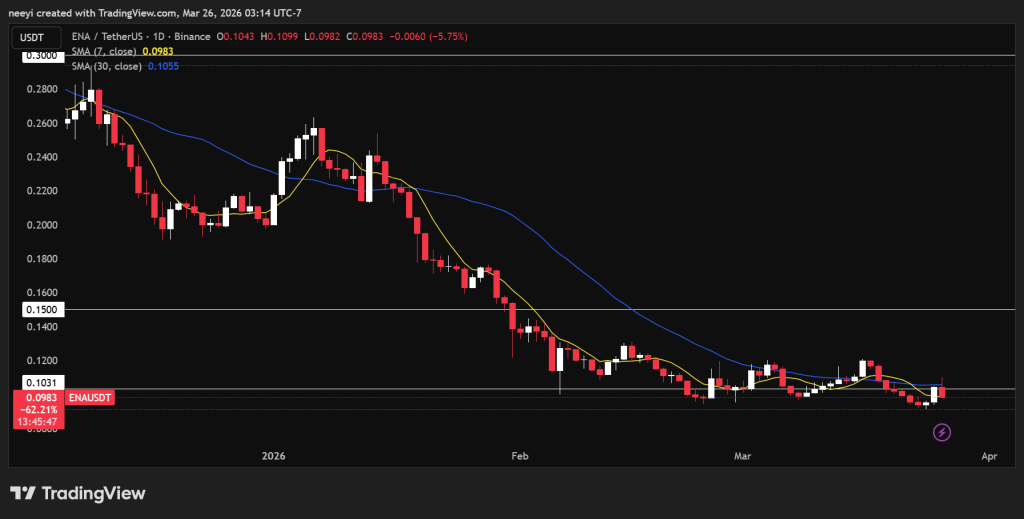
ENA Price Chart / Source: TradingView.com
Key Support And Resistance Levels Define ENA Price Path In 2026
Recent price action has formed a clear range that now acts as a guide for the next move. Support sits around $0.09, which has held during recent pullbacks. Resistance stands near $0.12, which has capped upward attempts over the past week.
Extension levels between $0.13 and $0.15 become relevant if ENA price manages to break above resistance. These levels would mark the first signs of a stronger recovery phase.
This range provides a framework that helps define what could happen next without relying on a single fixed prediction.
Three Possible Scenarios Show How ENA Price Could Evolve In The Coming Months
The base case scenario keeps ENA price within the $0.09 to $0.12 range. This outcome aligns with neutral momentum and steady trading activity. Price could move sideways as the market waits for a clearer catalyst.
A bullish scenario would require ENA price to move above $0.12 and hold strength above $0.15. That type of move would likely depend on stronger demand for Ethena’s products and a supportive broader market environment. A push toward $0.30 becomes possible if those conditions align.
A bearish scenario emerges if ENA price drops below the $0.09 support level. That breakdown could open the door toward the $0.07 region. Such a move would likely follow broader market weakness or project specific challenges.
This Silver Signals Shows Why Bitcoin (BTC) Could Reach New All-Time High in 12 Months_**
The next phase for ENA price depends on both internal and external factors. Growth in Ethena’s synthetic dollar system could support demand if adoption expands across the market. Stronger participation would likely support upward price movement over time.
Macro conditions also remain important. A broader market recovery would support the bullish case, while weakness across major assets could weigh on ENA price.
Disclaimer: The information on this page may come from third parties and does not represent the views or opinions of Gate. The content displayed on this page is for reference only and does not constitute any financial, investment, or legal advice. Gate does not guarantee the accuracy or completeness of the information and shall not be liable for any losses arising from the use of this information. Virtual asset investments carry high risks and are subject to significant price volatility. You may lose all of your invested principal. Please fully understand the relevant risks and make prudent decisions based on your own financial situation and risk tolerance. For details, please refer to
Disclaimer.
