李番番
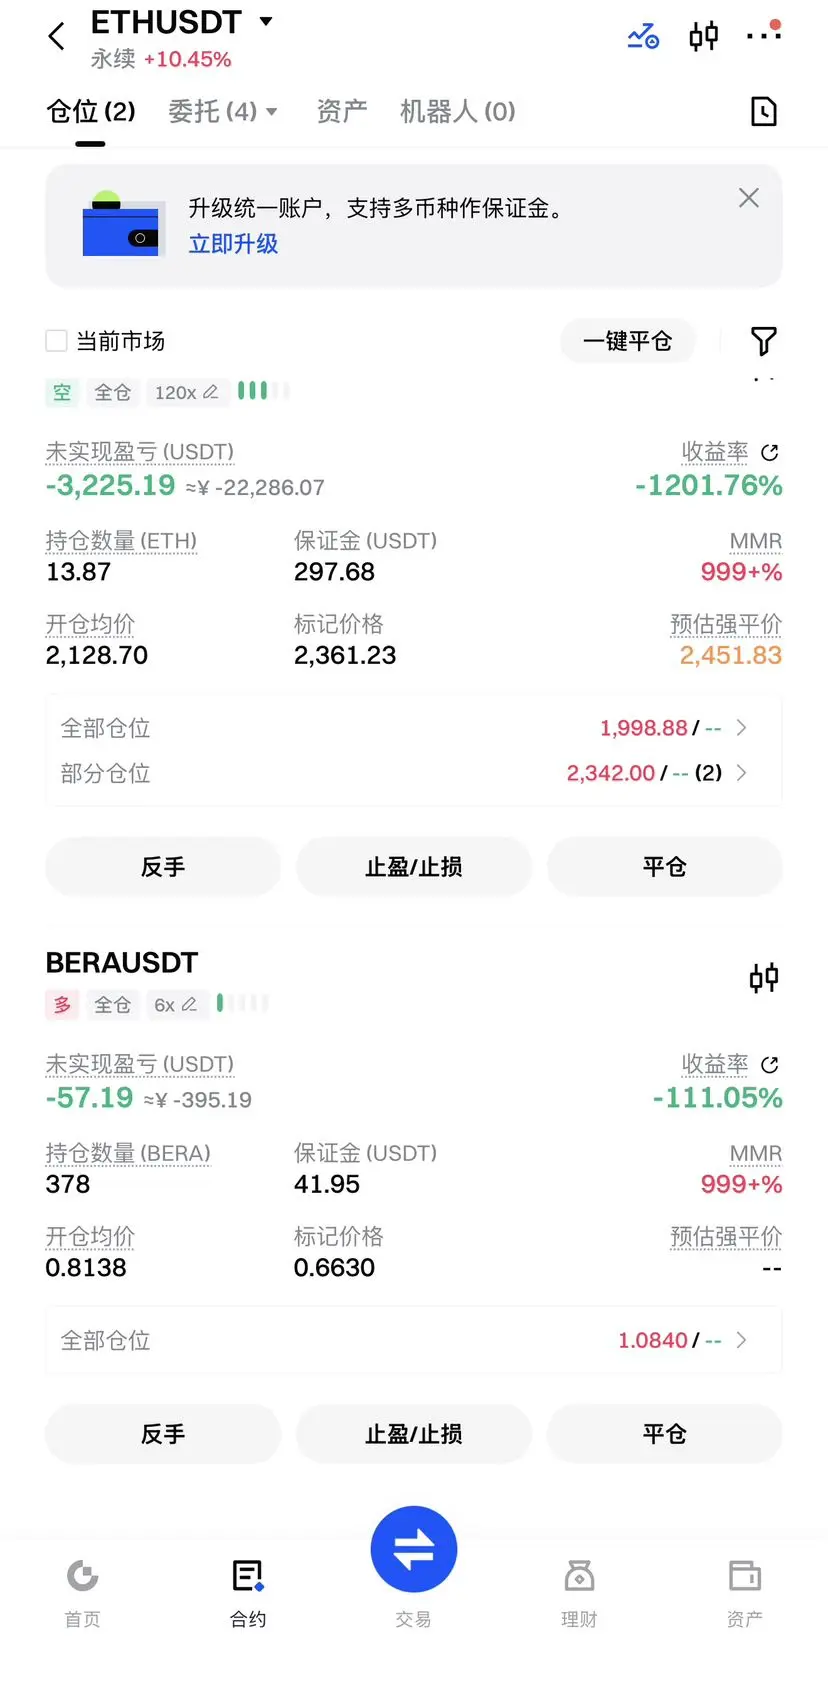
Can't hold on anymore, can't add more margin, ran out of money.
Left it to fate now. The price surge was too fierce, can't bear it emotionally.
查看原文Left it to fate now. The price surge was too fierce, can't bear it emotionally.
- 讚賞
- 3
- 5
- 轉發
- 分享
请叫我江总 :
:
我也是查看更多
- 讚賞
- 按讚
- 留言
- 轉發
- 分享

- 讚賞
- 2
- 留言
- 轉發
- 分享
馬币火
Malaysian Ringgit
創建人@Crypto King2026
上市進度
100.00%
市值:
$1986.98
更多代幣
【$COLLECT 信號】做多 | 放量突破前高,主力資金掃貨
$COLLECT 價格強勢突破0.082前高阻力(現象),4小時級別成交量與持倉量同步激增,買盤主導(資金驗證),這是典型的真突破結構,多頭動能強勁(結論)。
🎯方向:做多
⚡入場:0.0805 - 0.0815
🛑止損:0.0756
🚀目標:0.0901 / 0.0959
🛡策略:觸及目標1時減半倉位,剩餘倉位推保本損,博取更高目標。
查看實時行情 👇 $COLLECT
---
關注我:獲取更多加密市場實時分析與洞察! $BTC $ETH $SOL
#Gate广场AI测评官 #加密市场上涨 #比特币站上七万美元
查看原文$COLLECT 價格強勢突破0.082前高阻力(現象),4小時級別成交量與持倉量同步激增,買盤主導(資金驗證),這是典型的真突破結構,多頭動能強勁(結論)。
🎯方向:做多
⚡入場:0.0805 - 0.0815
🛑止損:0.0756
🚀目標:0.0901 / 0.0959
🛡策略:觸及目標1時減半倉位,剩餘倉位推保本損,博取更高目標。
查看實時行情 👇 $COLLECT
---
關注我:獲取更多加密市場實時分析與洞察! $BTC $ETH $SOL
#Gate广场AI测评官 #加密市场上涨 #比特币站上七万美元

- 讚賞
- 按讚
- 留言
- 轉發
- 分享
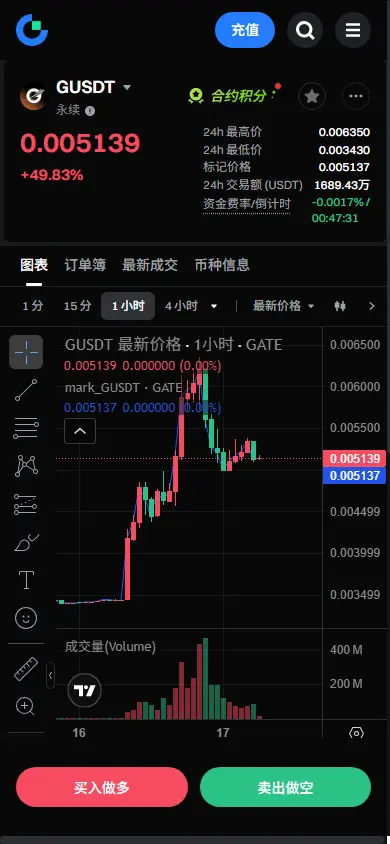
【$GUSDT 信号】轧空回踩,二次上攻
$GUSDT 单日暴涨46%后高位缩量盘整(现象),巨量成交与持仓量稳定表明主力资金未离场,买盘深度显著优于卖盘(资金验证),这是典型轧空后的健康换手,为二次上攻蓄力(结论)。
🎯方向:做多
⚡入场:0.00475 - 0.00488
🛑止损:0.00440
🚀目标:0.00678 / 0.00773
🛡️策略:触及目标1减半仓,推保本损,剩余仓位博取目标2。
查看实时行情 👇 $GUSDT
---
关注我:获取更多加密市场实时分析与洞察! $BTC $ETH $SOL
#Gate广场AI测评官 #加密市场上涨 #比特币站上七万美元
$GUSDT 单日暴涨46%后高位缩量盘整(现象),巨量成交与持仓量稳定表明主力资金未离场,买盘深度显著优于卖盘(资金验证),这是典型轧空后的健康换手,为二次上攻蓄力(结论)。
🎯方向:做多
⚡入场:0.00475 - 0.00488
🛑止损:0.00440
🚀目标:0.00678 / 0.00773
🛡️策略:触及目标1减半仓,推保本损,剩余仓位博取目标2。
查看实时行情 👇 $GUSDT
---
关注我:获取更多加密市场实时分析与洞察! $BTC $ETH $SOL
#Gate广场AI测评官 #加密市场上涨 #比特币站上七万美元
- 讚賞
- 按讚
- 留言
- 轉發
- 分享
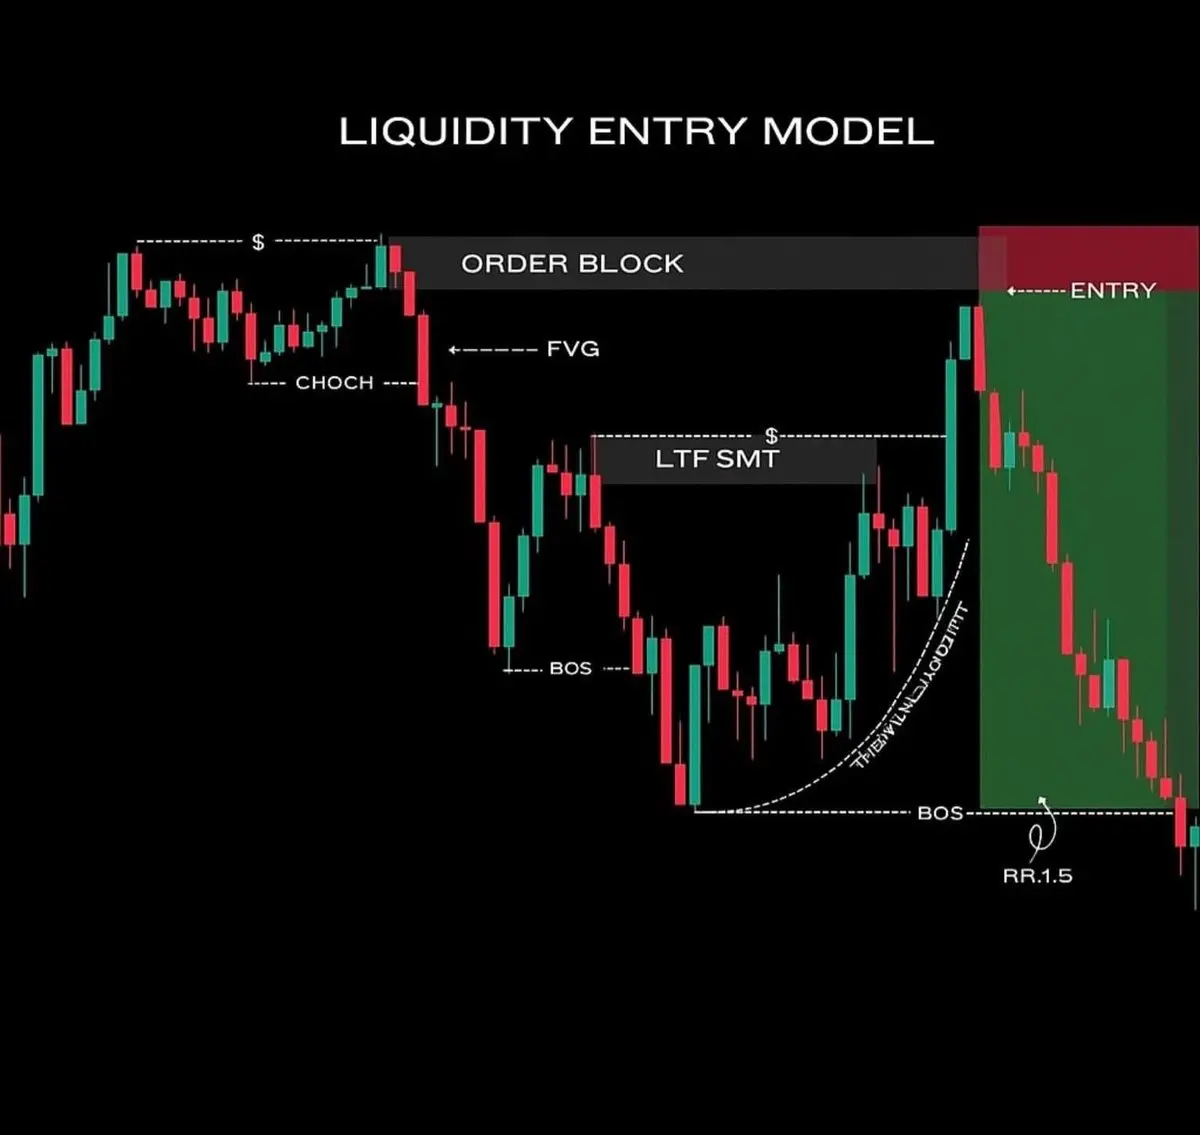
📊 流动性入场模型 – 聰明資金策略
大多數散戶追逐突破。
聰明資金交易流動性。
設置: 1️⃣ 流動性獵取 – 價格掃過前高/前低。
2️⃣ CHOCH – 市場結構轉變。
3️⃣ FVG – 失衡形成,通常會被填補。
4️⃣ 訂單塊 – 機構買/賣區域。
5️⃣ 入場 – 等待價格回到訂單塊以確認。
💡 關鍵概念:
價格先獵取流動性,然後通常朝相反方向移動。
🎯 風險回報比 ~ 1:1.5 使用結構 + 流動性。
⚠️ 不要追逐。等待你的水平。
📈 交易邏輯,不是情感。
查看原文大多數散戶追逐突破。
聰明資金交易流動性。
設置: 1️⃣ 流動性獵取 – 價格掃過前高/前低。
2️⃣ CHOCH – 市場結構轉變。
3️⃣ FVG – 失衡形成,通常會被填補。
4️⃣ 訂單塊 – 機構買/賣區域。
5️⃣ 入場 – 等待價格回到訂單塊以確認。
💡 關鍵概念:
價格先獵取流動性,然後通常朝相反方向移動。
🎯 風險回報比 ~ 1:1.5 使用結構 + 流動性。
⚠️ 不要追逐。等待你的水平。
📈 交易邏輯,不是情感。
- 讚賞
- 2
- 留言
- 轉發
- 分享


星期二下午,2026年3月17日 / 1447年伊斯兰历斋月27日 💫
“天堂承受不了,地狱也不愿意。那個審判很嚴厲,而我卻太懶惰。”
----------
炖菜 🍽️
查看原文“天堂承受不了,地狱也不愿意。那個審判很嚴厲,而我卻太懶惰。”
----------
炖菜 🍽️

- 讚賞
- 按讚
- 留言
- 轉發
- 分享

Hamster
Hamster
創建人@GateUser-4718fe36
認購進度
0.00%
市值:
$0
更多代幣

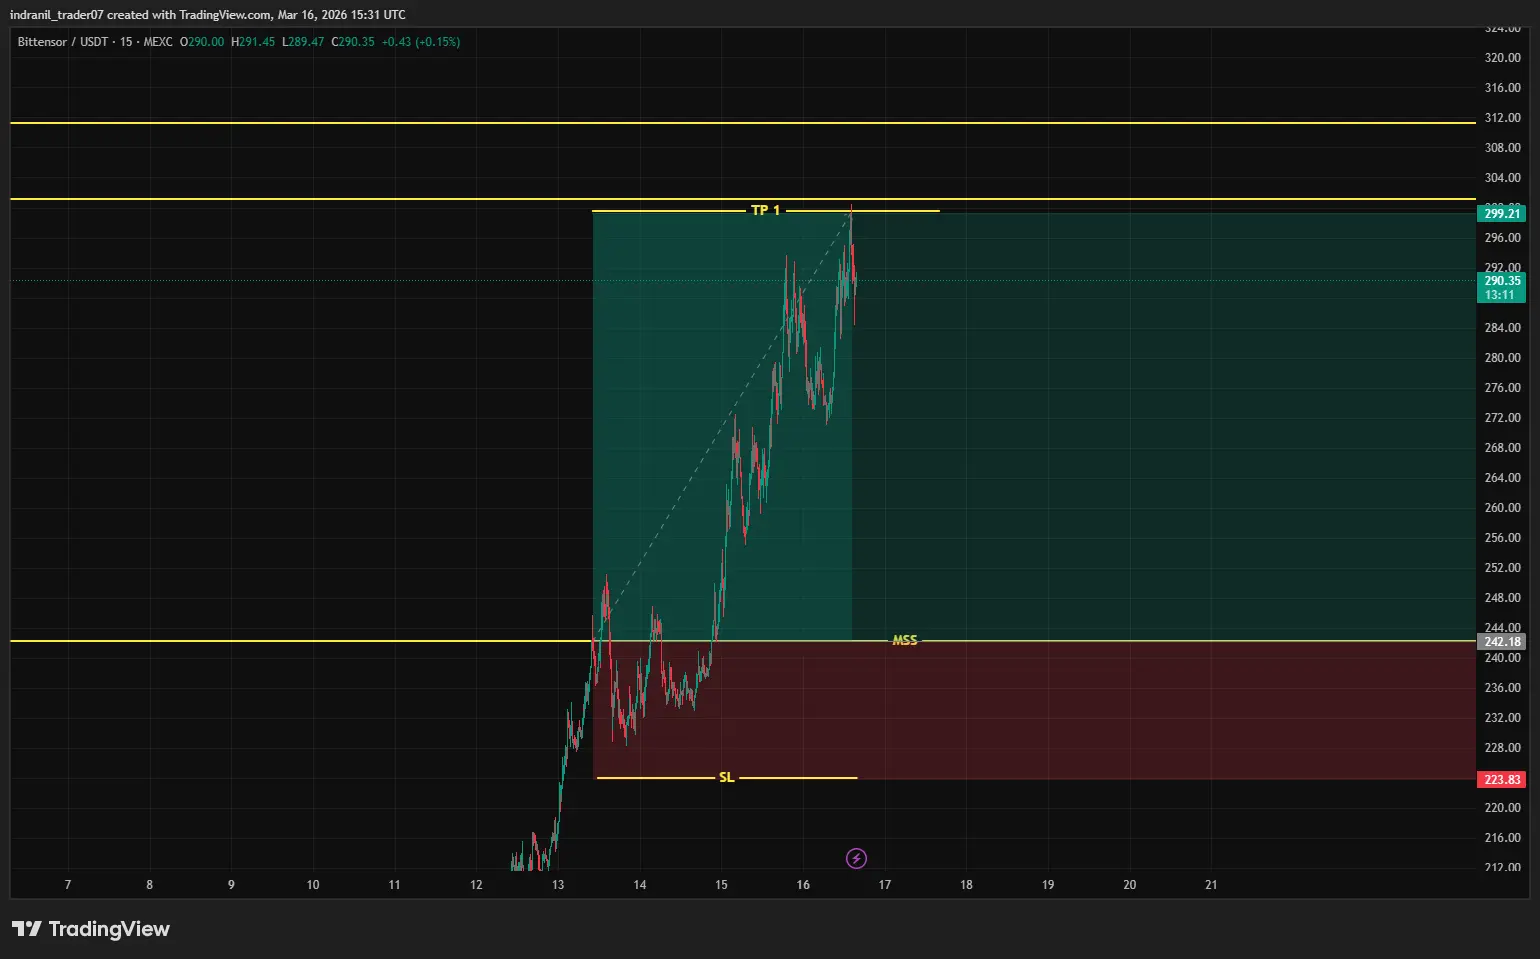
🚀 Bittensor $TAO 交易更新 – 所有目標命中!
Bittensor (TAO) 的驚人走勢!策略完美執行,所有目標已成功命中。 📈🔥
🎯 目標1 – 命中 ✅
🎯 目標2 – 命中 ✅
🎯 目標3 – 命中 ✅
紀律、耐心和相信分析的完美範例。當交易者遵循計劃並正確管理風險時,市場會獎勵一致性。
對於所有持有交易至最終目標的交易者,執行出色。 👏
又一個簡潔的策略,又一個成功的結果。
更多高概率策略即將推出。 🚀
#Bittensor #TAO #CryptoTrading #TradingMentor #PriceAction #加密市場
Bittensor (TAO) 的驚人走勢!策略完美執行,所有目標已成功命中。 📈🔥
🎯 目標1 – 命中 ✅
🎯 目標2 – 命中 ✅
🎯 目標3 – 命中 ✅
紀律、耐心和相信分析的完美範例。當交易者遵循計劃並正確管理風險時,市場會獎勵一致性。
對於所有持有交易至最終目標的交易者,執行出色。 👏
又一個簡潔的策略,又一個成功的結果。
更多高概率策略即將推出。 🚀
#Bittensor #TAO #CryptoTrading #TradingMentor #PriceAction #加密市場
TAO0.21%

- 讚賞
- 1
- 留言
- 轉發
- 分享
獲得 700+ 真實粉絲
盡快打個招呼,
我們快速跟隨
查看原文盡快打個招呼,
我們快速跟隨

- 讚賞
- 按讚
- 留言
- 轉發
- 分享
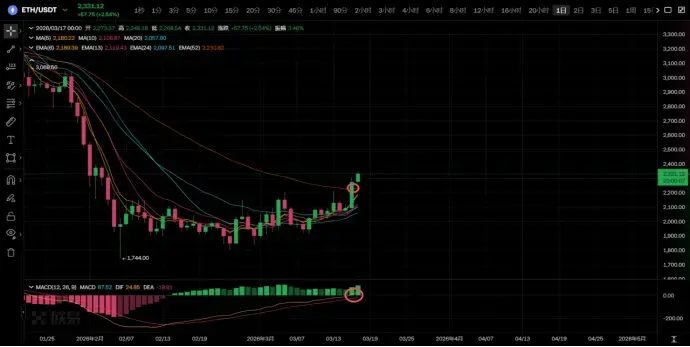
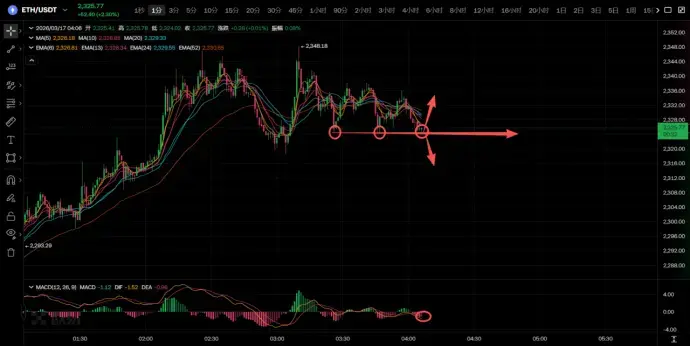
March 17, 2026 Ethereum Market Analysis
Chart 1
You can see that the daily chart has broken through the zero axis and reached the upper trend. Currently, the two-day chart pressure level is around 2527. You can see that the current bullish momentum is extremely strong. Next, from a trend perspective, you can go long at the lower support point, and for long positions, focus on the pattern. For short positions, everyone should note that the market will be dominated by long-term tug-of-war. Don't focus too much on a single direction to avoid capital being trapped.
Chart 2
You can see that multipl
ETH11.34%

- 讚賞
- 2
- 1
- 轉發
- 分享
新起点起飞:
你总是没声音 听不到咋加你 (This text is already in Traditional Chinese, so it remains unchanged.)
好的!nvidia 剛宣布了 NemoClaw,一個為 AI 代理建構的作業系統,基於... OpenClaw
- 基本上就是「企業就緒」的 openclaw,沒有安全問題。
- 公司可以啟動代理並給予他們存取敏感資料的權限,無需擔心漏洞利用。
- 為企業建構客製化的 AI 模型
- 適用於任何業務、科學和重點領域。
與 @steipete 合作完成 - 他媽的史詩級成果
查看原文- 基本上就是「企業就緒」的 openclaw,沒有安全問題。
- 公司可以啟動代理並給予他們存取敏感資料的權限,無需擔心漏洞利用。
- 為企業建構客製化的 AI 模型
- 適用於任何業務、科學和重點領域。
與 @steipete 合作完成 - 他媽的史詩級成果
- 讚賞
- 按讚
- 留言
- 轉發
- 分享
Quant Network 表示代幣化存款可以改變銀行業,但孤立協議存在效率風險。真正的規模需要互操作、中立的基礎設施。
了解更多:
#QuantNetwork # 互操作性 #FinTech #區塊鏈
查看原文了解更多:
#QuantNetwork # 互操作性 #FinTech #區塊鏈

- 讚賞
- 1
- 留言
- 轉發
- 分享

加載更多
加入 4000萬 人匯聚的頭部社群
⚡️ 與 4000萬 人一起參與加密貨幣熱潮討論
💬 與喜愛的頭部創作者互動
👍 查看感興趣的內容
熱門話題
查看更多34.06萬 熱度
53.78萬 熱度
4988.46萬 熱度
17.7萬 熱度
208.59萬 熱度
熱門 Gate Fun
查看更多- 市值:$2531.03持有人數:10.00%
- 市值:$2517.24持有人數:20.06%
- 市值:$2557.91持有人數:20.13%
- 市值:$2527.58持有人數:10.00%
- 市值:$2541.37持有人數:10.00%
最新消息
查看更多置頂
Gate Booster 第 4 期:發帖瓜分 1,500 $USDT
🔹 發布 TradFi 黃金福袋原創內容,可得 15 $USDT,名額有限先到先得
🔹 本期支持 X、YouTube 發布原創內容
🔹 無需複雜操作,流程清晰透明
🔹 流程:申請成為 Booster → 領取任務 → 發布原創內容 → 回鏈登記 → 等待審核及發獎
📅 任務截止時間:03月20日16:00(UTC+8)
立即領取任務:https://www.gate.com/booster/10028?pid=allPort&ch=KTag1BmC
更多詳情:https://www.gate.com/announcements/article/50203🤖 尋找 Gate 廣場 AI 評測官!$50,000 懸賞令發布!
發帖聊 AI,獎金拿到手軟!新人首帖獎勵翻倍,單帖最高 200U!
📝 立即報名:https://www.gate.com/questionnaire/7477
1️⃣ 發帖得紅包,單帖最高 100U!
2️⃣ Top 體驗分享官:帶 #Gate广场AI测评官 聊技巧,贏國米球衣!
3️⃣ 收益率 PK 王:曬 AI 收益截圖,贏 Gate 定制運動套裝!
4️⃣ 深度好文額外加碼 30U 每篇張榜公布!
💬 來 Gate 廣場,把握行業新趨勢:https://www.gate.com/post
時間:3/12 18:00 – 3/27 24:00 (UTC+8)
詳情:https://www.gate.com/announcements/article/50206Gate 廣場內容挖礦獎勵繼續升級!無論您是創作者還是用戶,挖礦新人還是頭部作者都能贏取好禮獲得大獎。現在就進入廣場探索吧!
創作者享受最高60%創作返佣
創作者獎勵加碼1500USDT:更多新人作者能瓜分獎池!
觀眾點擊交易組件交易贏大禮!最高50GT等新春壕禮等你拿!
詳情:https://www.gate.com/announcements/article/49802