$GT #MarchCPIDataReleased Based on the chart for GT/USDT, here is a concise technical analysis:
1. Current Price Action
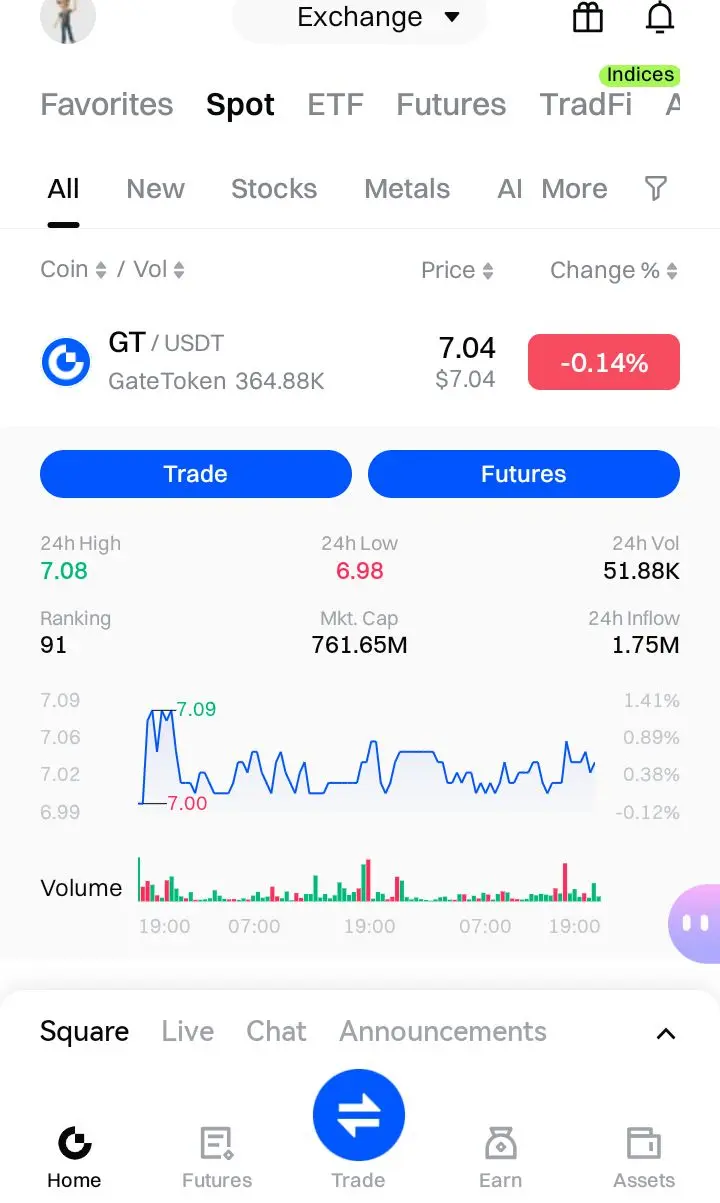
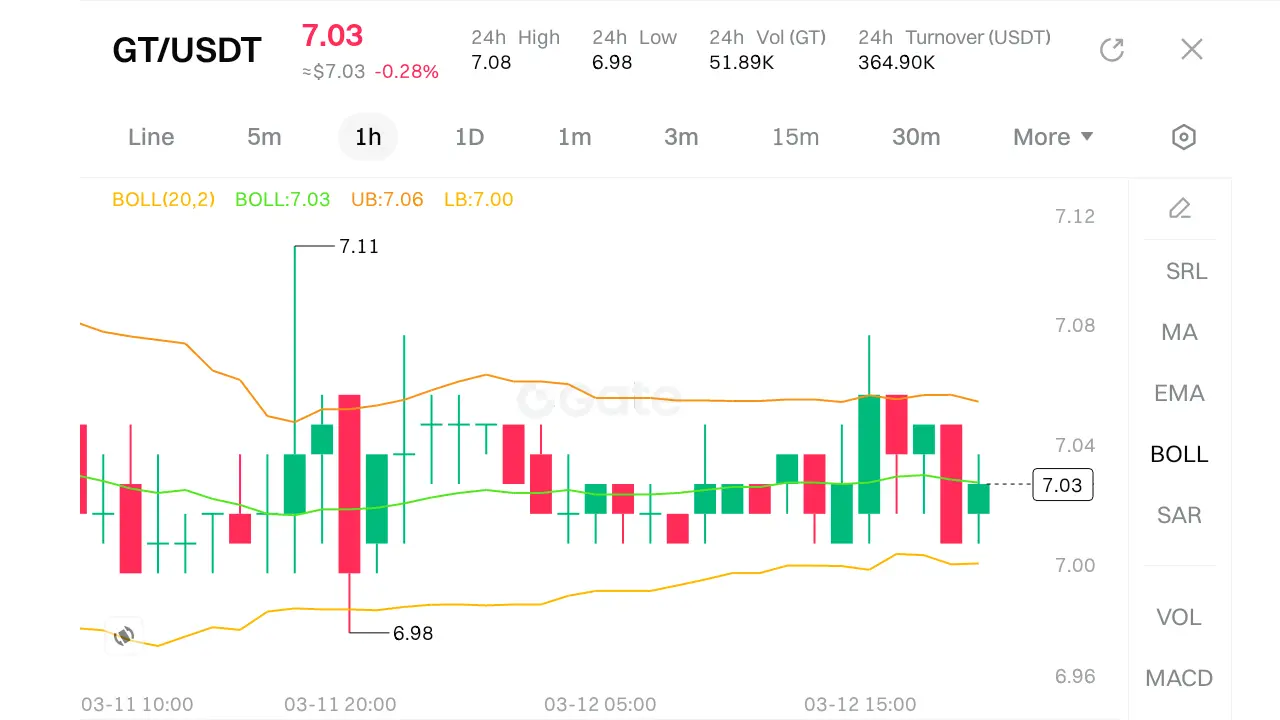
· Price: $7.03
· Daily Change: -0.28%
· The price is currently trading near the middle of its recent range, between the 24h Low of $6.98 and the 24h High of $7.08.
2. Bollinger Bands Analysis (20,2)
· Upper Band (UB): 7.06
· Middle Band (BOLL): 7.03 (Current Price)
· Lower Band (LB): 7.00
Interpretation:
· The price is sitting exactly on the Middle Band (7.03) . This often acts as a dynamic support/resistance level.
· The bands are relatively narrow (range of 0.06 from LB to