Trade
Basic
Futures
Futures
Hundreds of contracts settled in USDT or BTC
TradFi
Gold
Trade global traditional assets with USDT in one place
Options
Hot
Trade European-style vanilla options
Unified Account
Maximize your capital efficiency
Demo Trading
Futures Kickoff
Get prepared for your futures trading
Futures Events
Participate in events to win generous rewards
Demo Trading
Use virtual funds to experience risk-free trading
Earn
Launch
CandyDrop
Collect candies to earn airdrops
Launchpool
Quick staking, earn potential new tokens
HODLer Airdrop
Hold GT and get massive airdrops for free
Launchpad
Be early to the next big token project
Alpha Points
Trade on-chain assets and enjoy airdrop rewards!
Futures Points
Earn futures points and claim airdrop rewards
Investment
Simple Earn
Earn interests with idle tokens
Auto-Invest
Auto-invest on a regular basis
Dual Investment
Buy low and sell high to take profits from price fluctuations
Soft Staking
Earn rewards with flexible staking
Crypto Loan
0 Fees
Pledge one crypto to borrow another
Lending Center
One-stop lending hub
VIP Wealth Hub
Customized wealth management empowers your assets growth
Private Wealth Management
Customized asset management to grow your digital assets
Quant Fund
Top asset management team helps you profit without hassle
Staking
Stake cryptos to earn in PoS products
Smart Leverage
New
No forced liquidation before maturity, worry-free leveraged gains
GUSD Minting
Use USDT/USDC to mint GUSD for treasury-level yields
More
CryptOpus
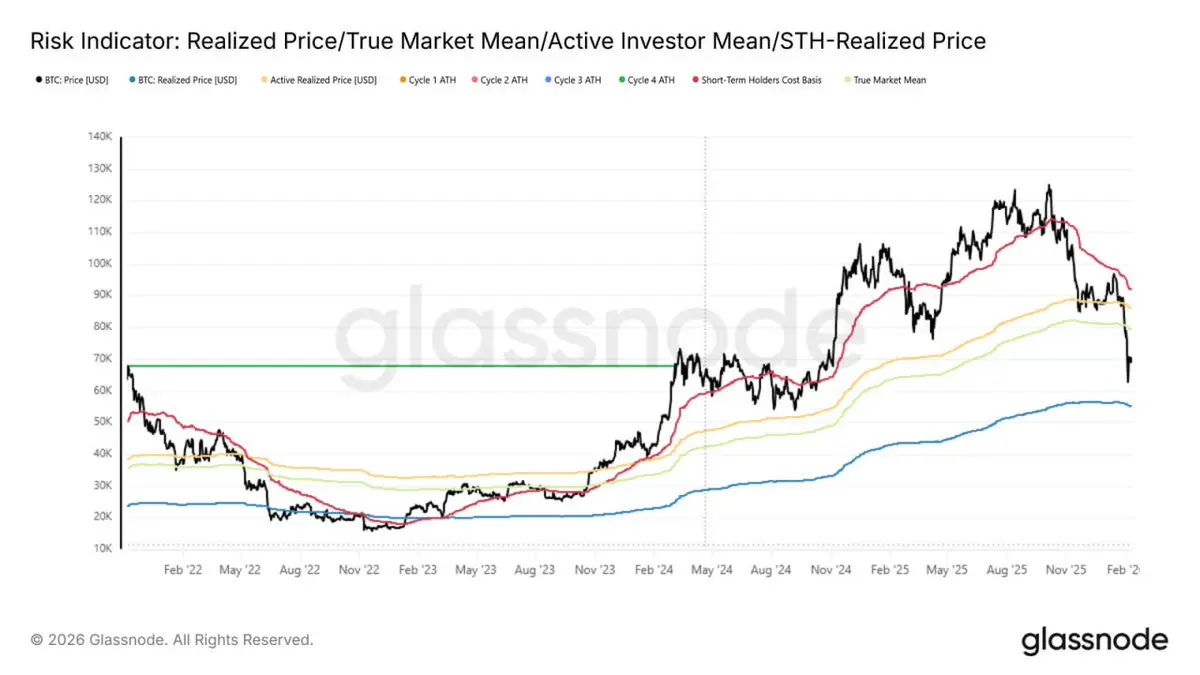
The current range between True Market Mean near $79.2K and Realized Price around $55K resembles early 2022 📊. Price is expected to oscillate within this corridor as new buyers emerge and accumulate supply ⏳. A short-term regime #shift needs an extraordinary catalyst either reclaiming $79.2K signaling renewed strength 📈 or a systemic shock like LUNA/FTX forcing price below $55K 📉. Without extremes, prolonged range-bound absorption is the most probable mid-term path ⚠️💰. #crypto
- Reward
- 1
- Comment
- Repost
- Share
🚨 JUST IN: X is set to launch “Smart Cashtags” in the coming weeks.
Users will reportedly be able to trade stocks and crypto directly from the timeline.
Social media → Trading terminal.
The lines keep blurring.
Big move for fintech.
Users will reportedly be able to trade stocks and crypto directly from the timeline.
Social media → Trading terminal.
The lines keep blurring.
Big move for fintech.

- Reward
- like
- Comment
- Repost
- Share
SCOIN
SCoin
Created By@0xd1b5...a733
Listing Progress
0.00%
MC:
$2.54K
More Tokens
- Reward
- like
- Comment
- Repost
- Share
Participate in horse racing betting, complete tasks to earn horse racing tickets, and enjoy a million red envelope rain daily, sharing a prize pool of 100,000 USDT at the Gate 2026 Spring Festival Celebration. https://www.gate.com/competition/year-of-horse-2026?ref_type=165&utm_cmp=7EQB9Jba&ref=VLMQUVXBAW
View Original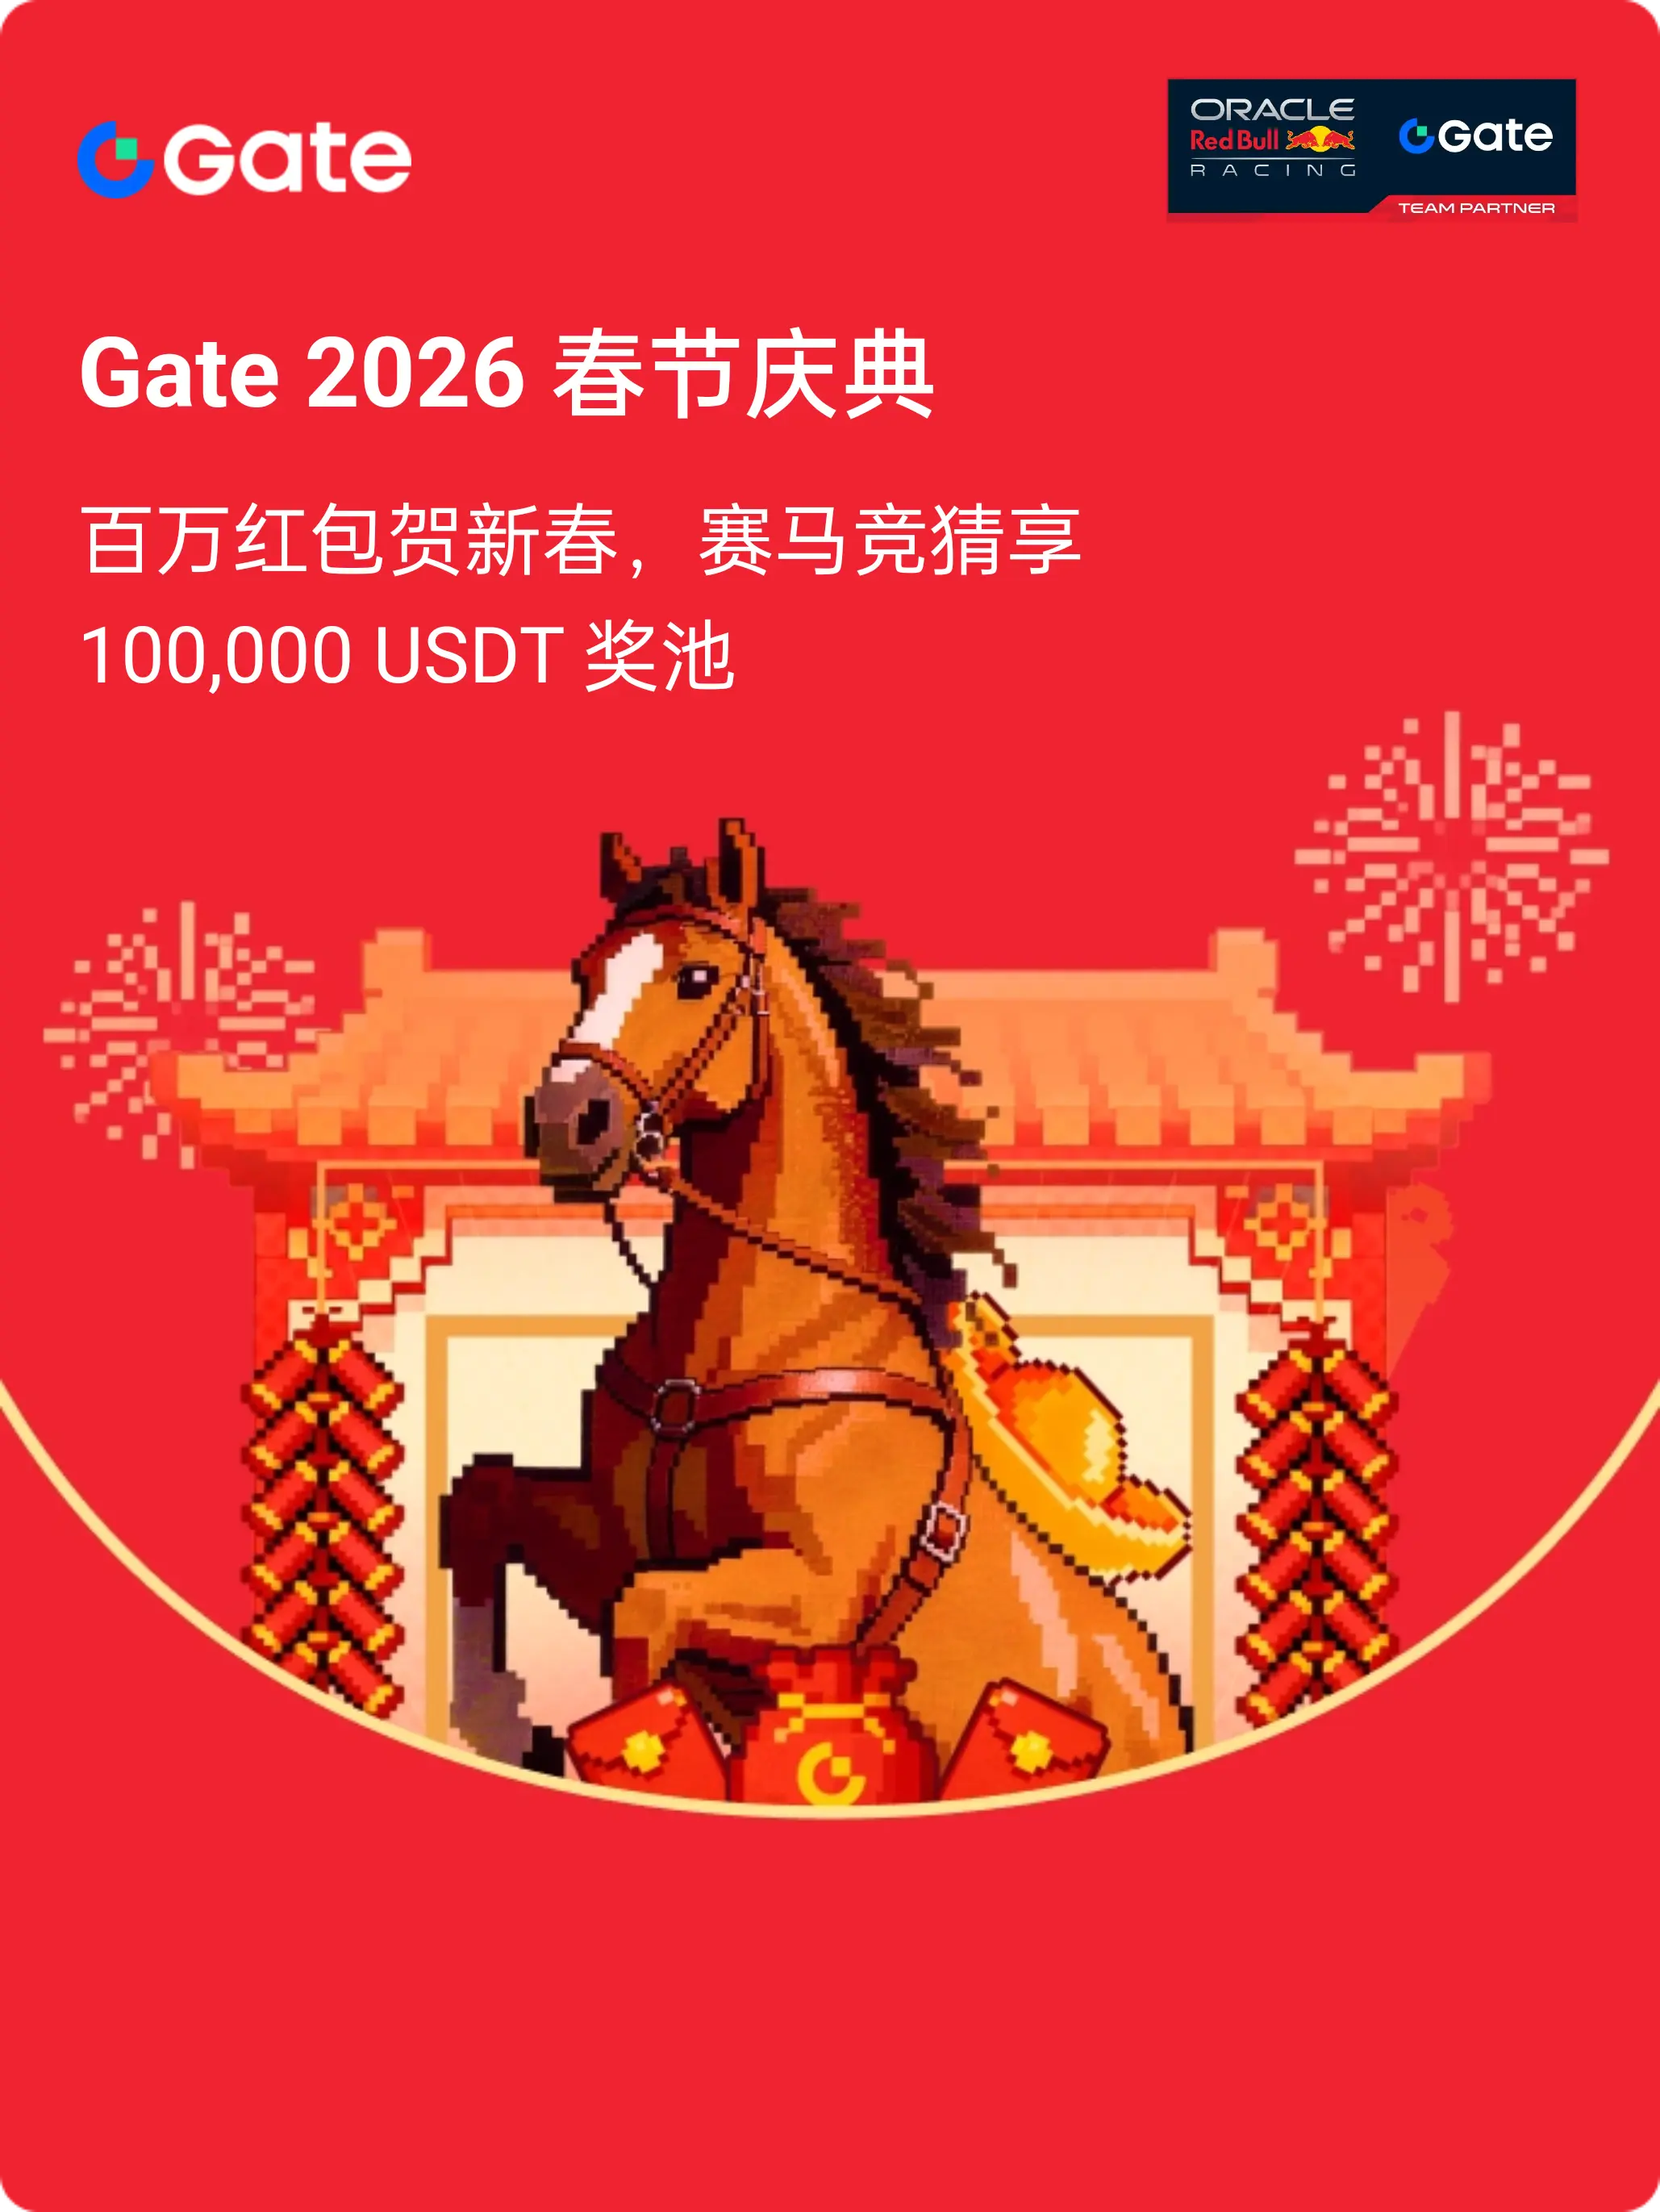
- Reward
- like
- Comment
- Repost
- Share
Check out Gate and join me in the hottest event! https://www.gate.com/campaigns/4067?ref=UFJNV19Z&ref_type=132
- Reward
- like
- Comment
- Repost
- Share
decided to enter my bald arc
brian i salute you
brian i salute you

- Reward
- like
- Comment
- Repost
- Share
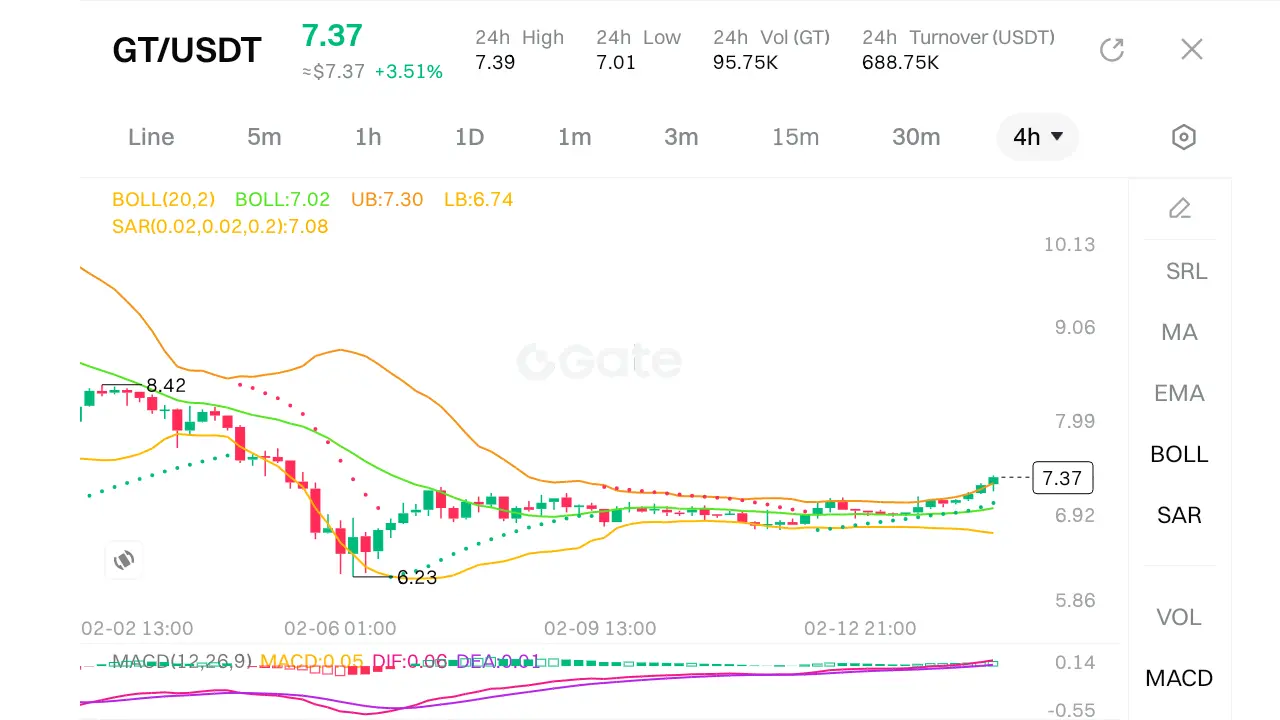
$GT #USCoreCPIHitsFour-YearLow
GT/USDT, here is a technical analysis:
Price Action and Trend
· Current Price: 7.37 USDT, up +3.51% over the last 24 hours.
· 24h Range: High of 7.39, low of 7.01, indicating a strong upward move from the daily low.
· The price is currently trading near the 24h high, showing bullish momentum.
Bollinger Bands (20,2)
· Upper Band (UB): 7.30
· Middle Band (BOLL): 7.02
· Lower Band (LB): 6.74
· Observation: Price (7.37) is above the upper band, suggesting an overbought condition and strong bullish momentum. However, this can also signal a potential pullback or conso
GT4,25%

- Reward
- like
- Comment
- Repost
- Share
Check out Gate and join me in the hottest event! https://www.gate.com/campaigns/4078?ref_type=132

- Reward
- 1
- 1
- Repost
- Share
xxx40xxx :
:
2026 GOGOGO 👊
- Reward
- like
- 1
- Repost
- Share
WangErxiaoHerdingCatt:
111🔹 Standard Chartered expects Bitcoin could rebound before year-end
876
- Reward
- 2
- 1
- Repost
- Share
Crypto_Buzz_with_Alex:
🌱 “Growth mindset activated! Learning so much from these posts.”LS
LionStar
Created By@Takadaffin
Listing Progress
0.00%
MC:
$0.1
More Tokens
Take a moment to rest, oh gorgon man, the world doesn't demand us to hurry ☕🍃
View Original
- Reward
- like
- Comment
- Repost
- Share
- Reward
- like
- 1
- Repost
- Share
GateUser-e157ddae :
:
This title will sell in another two hours ......Participate in horse racing betting, complete tasks to earn horse racing tickets, and enjoy a million red envelope rain daily, sharing a prize pool of 100,000 USDT at the Gate 2026 Spring Festival Celebration. https://www.gate.com/competition/year-of-horse-2026?ref_type=165&utm_cmp=7EQB9Jba&ref=VLJBVV5DAW
View Original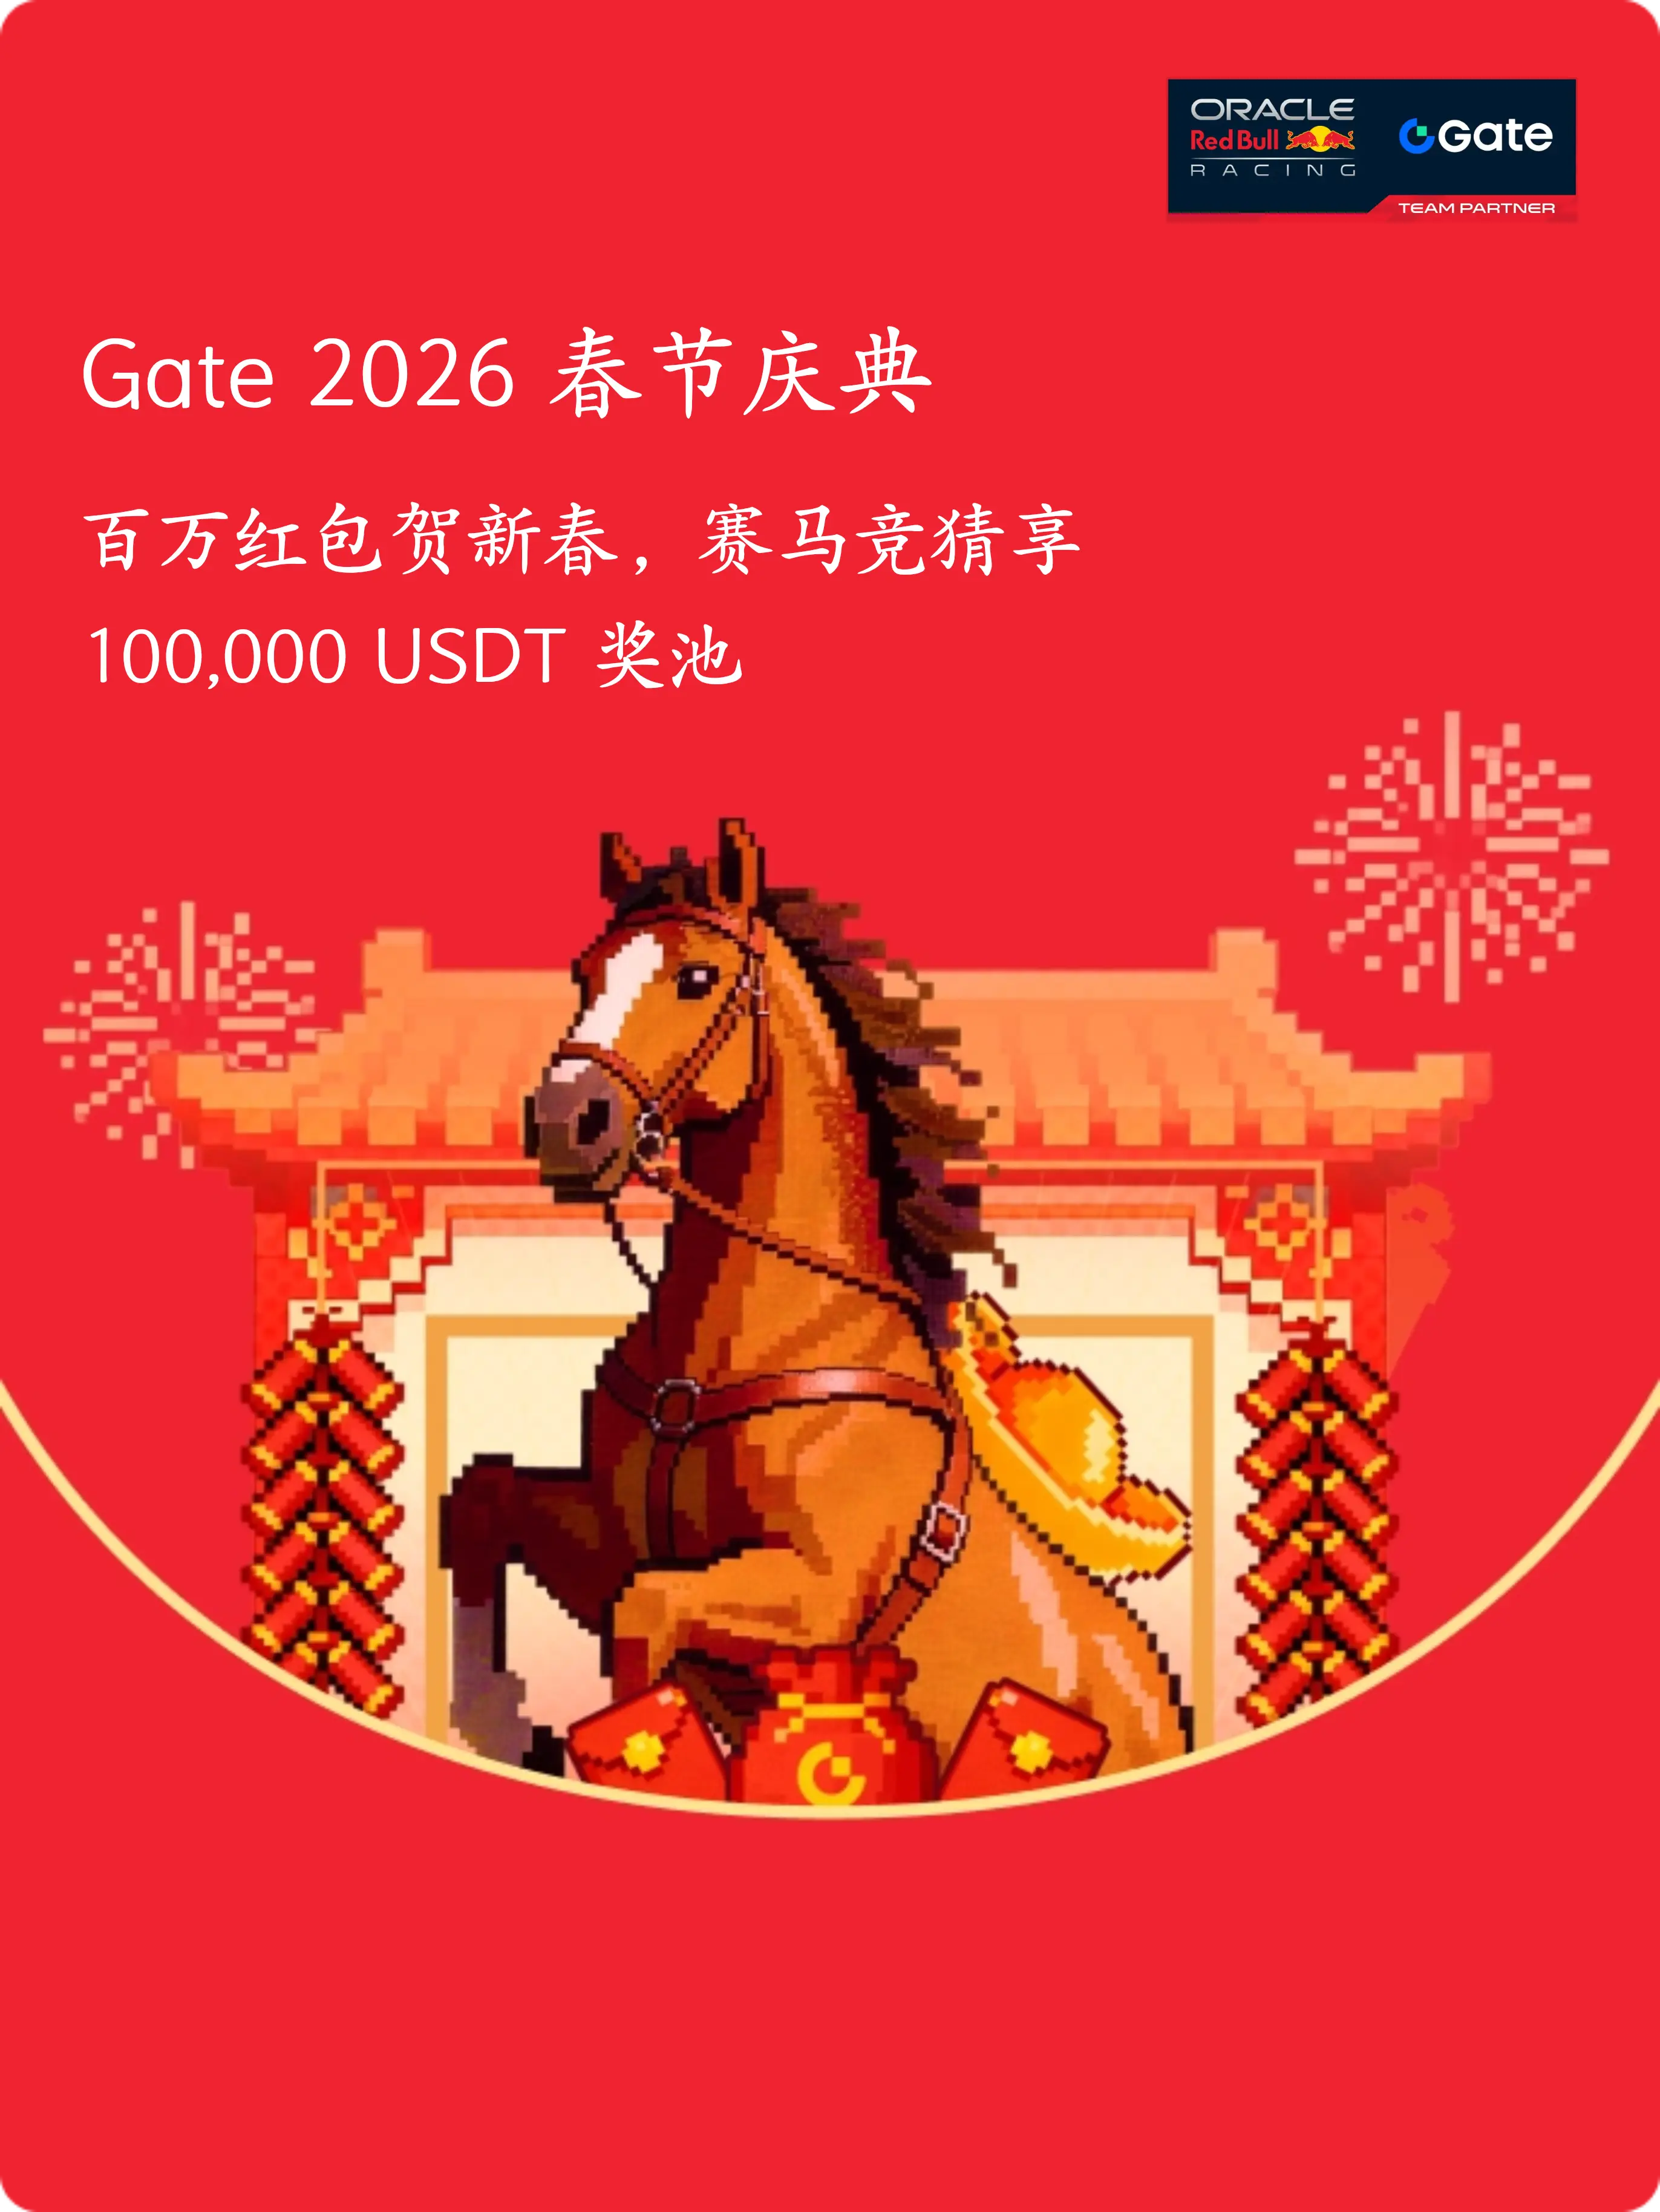
- Reward
- like
- Comment
- Repost
- Share
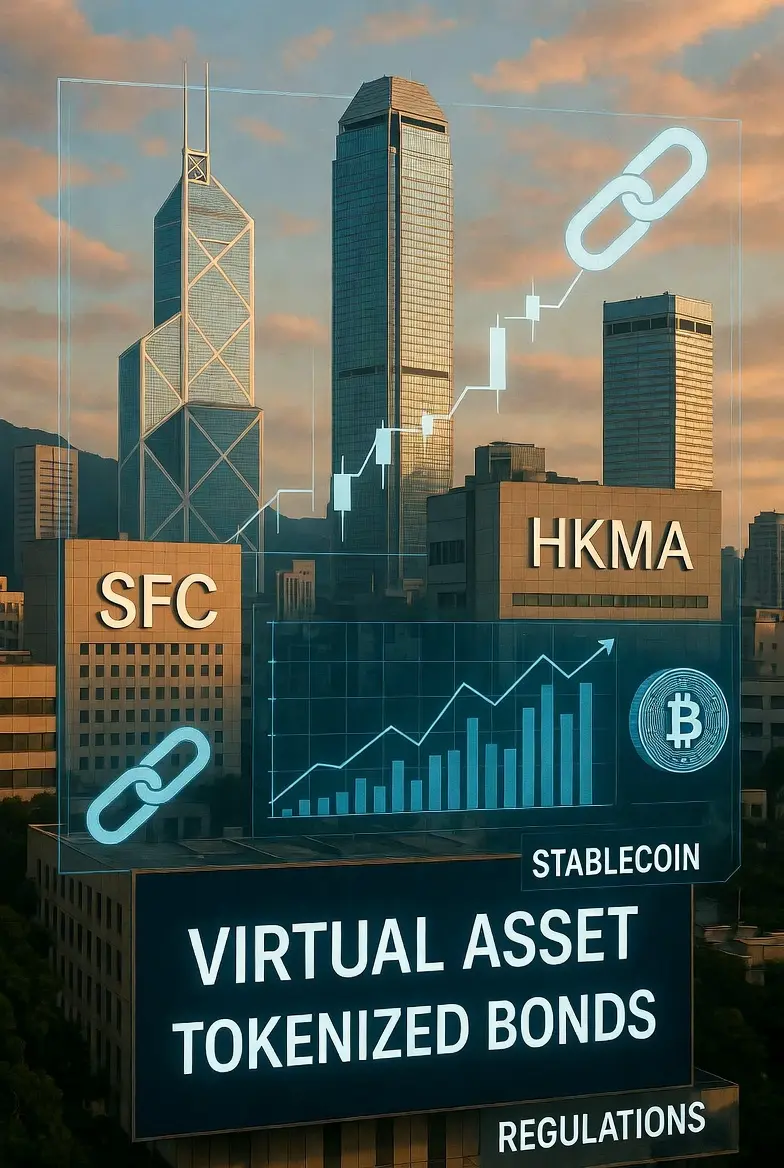
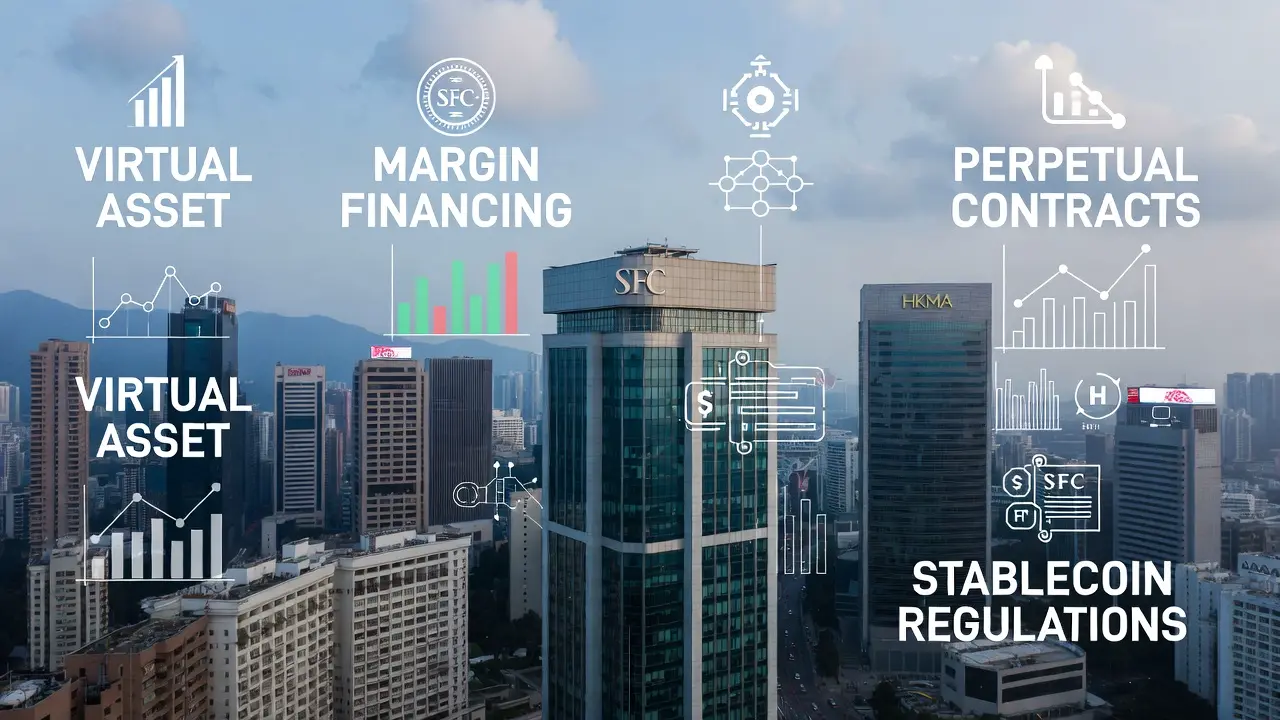
#HongKongPlansNewVAGuidelines
Hong Kong's evolving virtual asset (VA) framework, led by the SFC and HKMA, is actively reshaping the crypto market with fresh initiatives rolled out in early 2026. These include margin financing, perpetual contracts for professionals, enhanced liquidity access, and impending stablecoin licenses — all aimed at deeper, more efficient, and regulated trading.
Hong Kong is stepping up as Asia's premier regulated crypto hub. Recent SFC moves (Feb 11, 2026) + HKMA stablecoin progress are driving real market change — more liquidity, institutional tools, and sustainabl


- Reward
- 4
- 5
- Repost
- Share
Ryakpanda:
2026 Go Go Go 👊View More
🇭🇰 LONGITUDE Hong Kong raised the bar. Big ideas and real conversations shaping crypto’s next chapter took the spotlight. Co-hosted by Cointelegraph and. On to the next! #crypto

- Reward
- like
- Comment
- Repost
- Share
Agree
2.14 Valentine's Day, happy holiday to all lovers
Bitcoin and Ethereum have rebounded sharply, mainly because last night’s CPI dropped from 2.7% to 2.4%, an unexpected positive signal. Jingyi was caught in a short position yesterday, but Shipan’s fans remain loyal and continue to trust her as always. No teacher is invincible, and Jingyi’s win rate is already very high, surpassing many others. She always takes responsibility to the end, and of course, Jingyi will not betray that trust!
For now, there’s no rush to short Bitcoin; first watch the resistance around 710-720, and consider a lig
BTC1,54%

- Reward
- like
- Comment
- Repost
- Share
#GateSpringFestivalHorseRacingEvent 🐎 Gate.io Spring Festival Horse Racing 2026: Gamified Futures Trading in Action 🚀
As the 2026 Spring Festival kicks off, Gate.io has launched its most interactive gamified event yet — the Spring Festival Horse Racing, now integrated with futures trading mechanics. This isn’t just a festive celebration; it’s a carefully engineered engagement campaign that merges entertainment, strategy, and financial opportunity, allowing users to participate actively while maximizing their rewards.
At its core, the event leverages horse racing-inspired gamification to driv
GT4,25%

- Reward
- 8
- 8
- Repost
- Share
ShainingMoon:
2026 GOGOGO 👊View More
Load More
Join 40M users in our growing community
⚡️ Join 40M users in the crypto craze discussion
💬 Engage with your favorite top creators
👍 See what interests you
Trending Topics
View More77.75K Popularity
5.61K Popularity
5.42K Popularity
51.72K Popularity
2.82K Popularity
Hot Gate Fun
View More- MC:$2.54KHolders:10.00%
- MC:$2.54KHolders:10.00%
- MC:$2.54KHolders:10.00%
- MC:$2.54KHolders:10.00%
- MC:$0.1Holders:10.00%
News
View MoreIn the past 24 hours, the entire network's contract liquidations reached $144 million, mainly from short positions.
2 m
Roundhill has submitted multiple "prediction market event contract" election ETF applications
7 m
Polymarket launches a new 5-minute cryptocurrency price fluctuation trading market, powered by Chainlink
49 m
Bitcoin OG Garrett Jin Sells 5,000 BTC Worth $348.82M, Withdraws $53.12M USDT
1 h
"Zhuankong New Coin" trader closes MEGA short position again, achieving profit once more
1 h
Pin