Share crypto content and earn up to 60% commissions through content mining.
placeholder
gatefun
$BTC 4.15 Bitcoin Price Trend Analysis
Bitcoin Yb wave is moving in the wxyxz wave pattern, and is currently in an upward Z wave. The Z wave is currently nearing the end.
The Z wave forms a three-jagged zigzag structure. In a normal trend, it should break through the previous high of 76000.
Currently, it is forming the last zigzag. The first upward segment has been completed; after a pullback, there will be a third upward segment.
Risk warning: This is only an analysis of market structure and does not constitute any trading advice.
#BTC #BTC Price Trend Analysis #Commander
BTC0,04%
View Original
post-image
  • Reward
  • Comment
  • Repost
  • Share
#Trading Bot #我正在 Gate uses XAGUSDT contract grid bot, total return since creation +13.97% $XAG
View Original
post-image
  • Reward
  • Comment
  • Repost
  • Share
✨SEC Makes Historic Move
$25,000 Day Trading Rule Abolished🔥🔥🔥
A historic regulatory change directly impacting retail investors in US financial markets has gone into effect. The U.S. Securities and Exchange Commission (SEC) has approved a long-debated regulation proposed by the Financial Industry Regulatory Authority (FINRA), officially eliminating the $25,000 minimum account balance requirement for day trading.
This change marks the end of the regulation known as the "Pattern Day Trader" (PDT) rule, which has been in effect since 2001.
24-Year-Old Rule Becomes History
Under the previous re
post-image
  • Reward
  • 3
  • Repost
  • Share
discovery:
LFG 🔥
View More
BTC Market Analysis:
1. AI Macro Multi-Dimensional Analysis: Convergence and Trend Reversal
1. Price Action and Liquidity
Currently, BTC's real-time price is consolidating in the $73,900 - $74,600 range. On the daily chart, it shows an "ascending wedge" or "converging triangle" pattern, with prices constrained by the $75,000 psychological level and previous high resistance. On-chain data indicates exchange Bitcoin reserves have fallen to a near three-year low (about 2.69 million coins), showing that spot selling pressure mainly comes from high-leverage contracts rather than spot sell-offs. Thi
BTC0,04%
View Original
post-image
post-image
  • Reward
  • Comment
  • Repost
  • Share
$RAVE Brothers, it's empty.
#$RAVE #RAVE
Welcome to Yunnan, Guizhou, and Sichuan
RAVE132,26%
View Original
post-image
  • Reward
  • Comment
  • Repost
  • Share
#Share My Futures Return# ✌️😎
post-image
  • Reward
  • Comment
  • Repost
  • Share
Yesterday's Bitcoin and Ethereum current price strategy!
Short Bitcoin at the current price of 74,700-75,000, target 74,000-73,000, stop loss at 75,500!
Short Ethereum at the current price of 2,380-2,400, target 2,330-2,300, stop loss at 2,430!
Bitcoin regretfully hit stop loss, Ethereum precisely took profit!
Strategies are time-sensitive; please refer to private real-time guidance!#WCTC交易赛瓜分800万USDT
BTC0,04%
ETH-1,69%
View Original
post-image
Masahiko
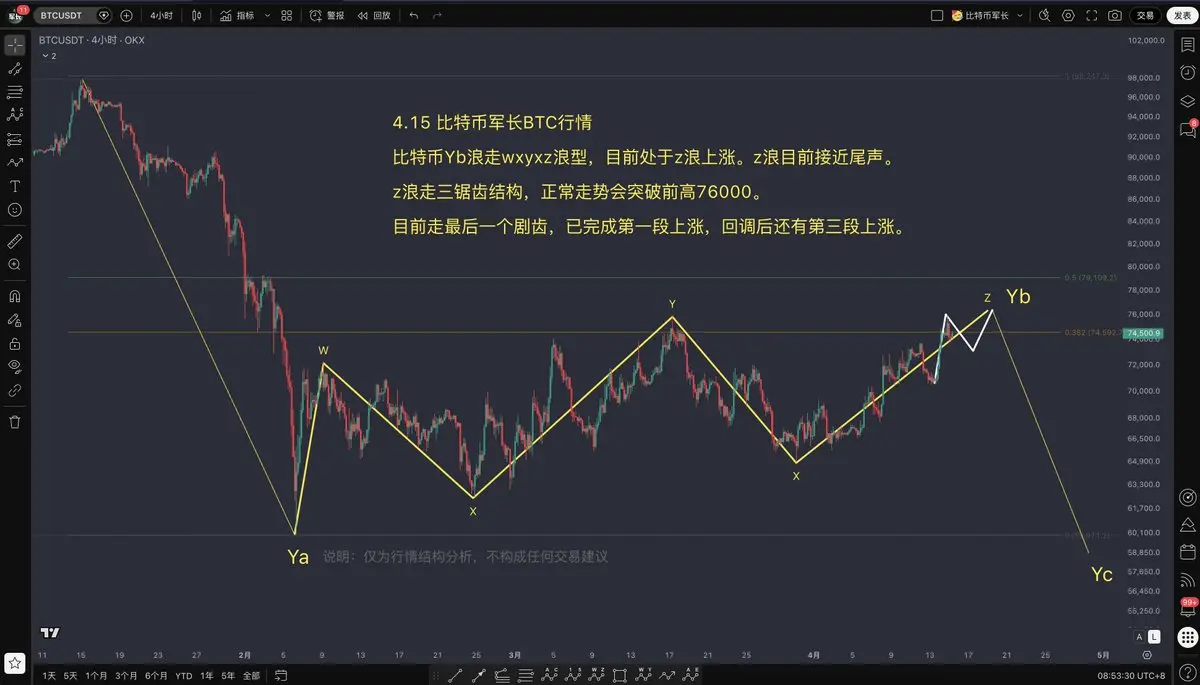
4.14 Bitcoin and Ethereum current price strategy!
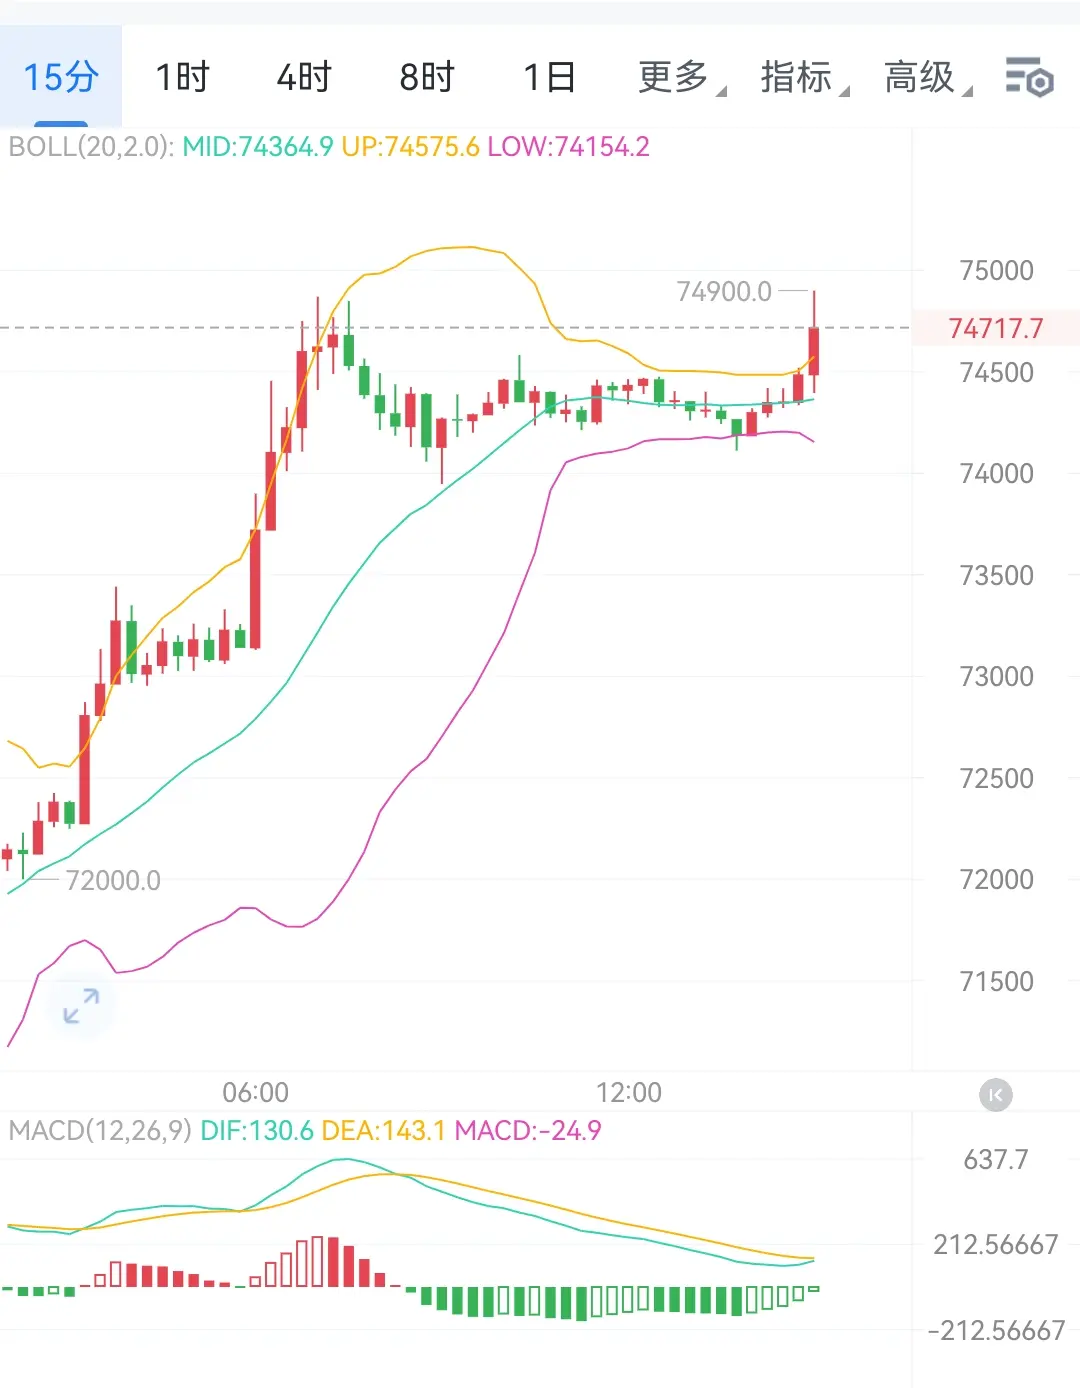
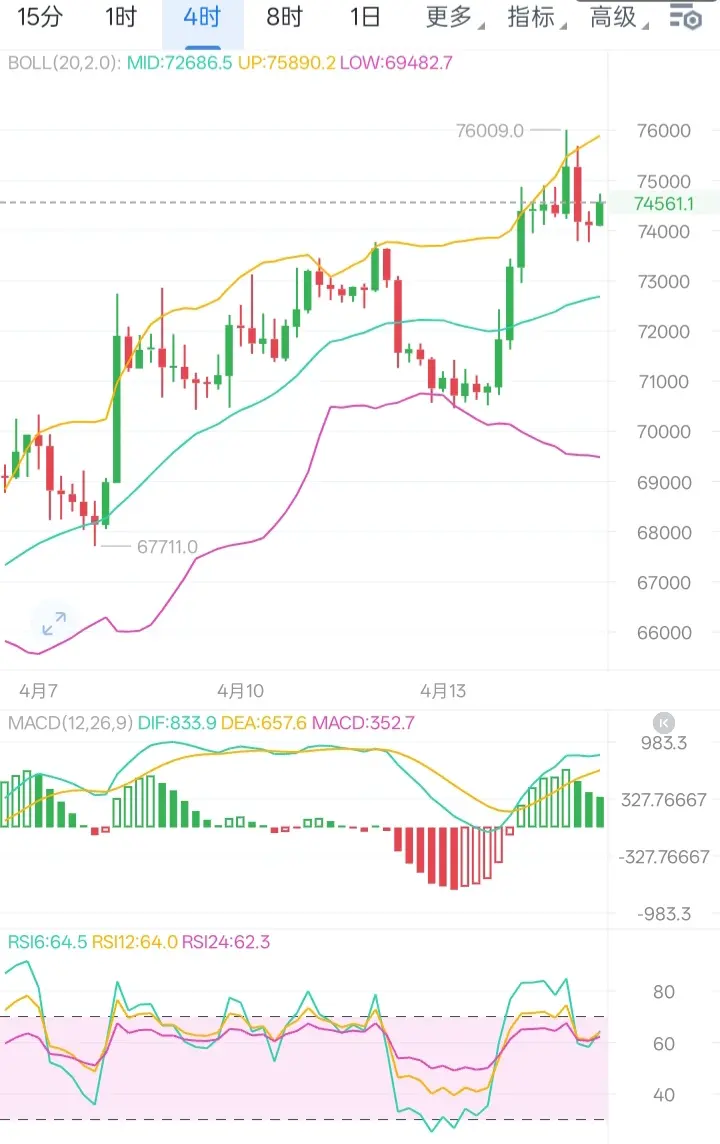
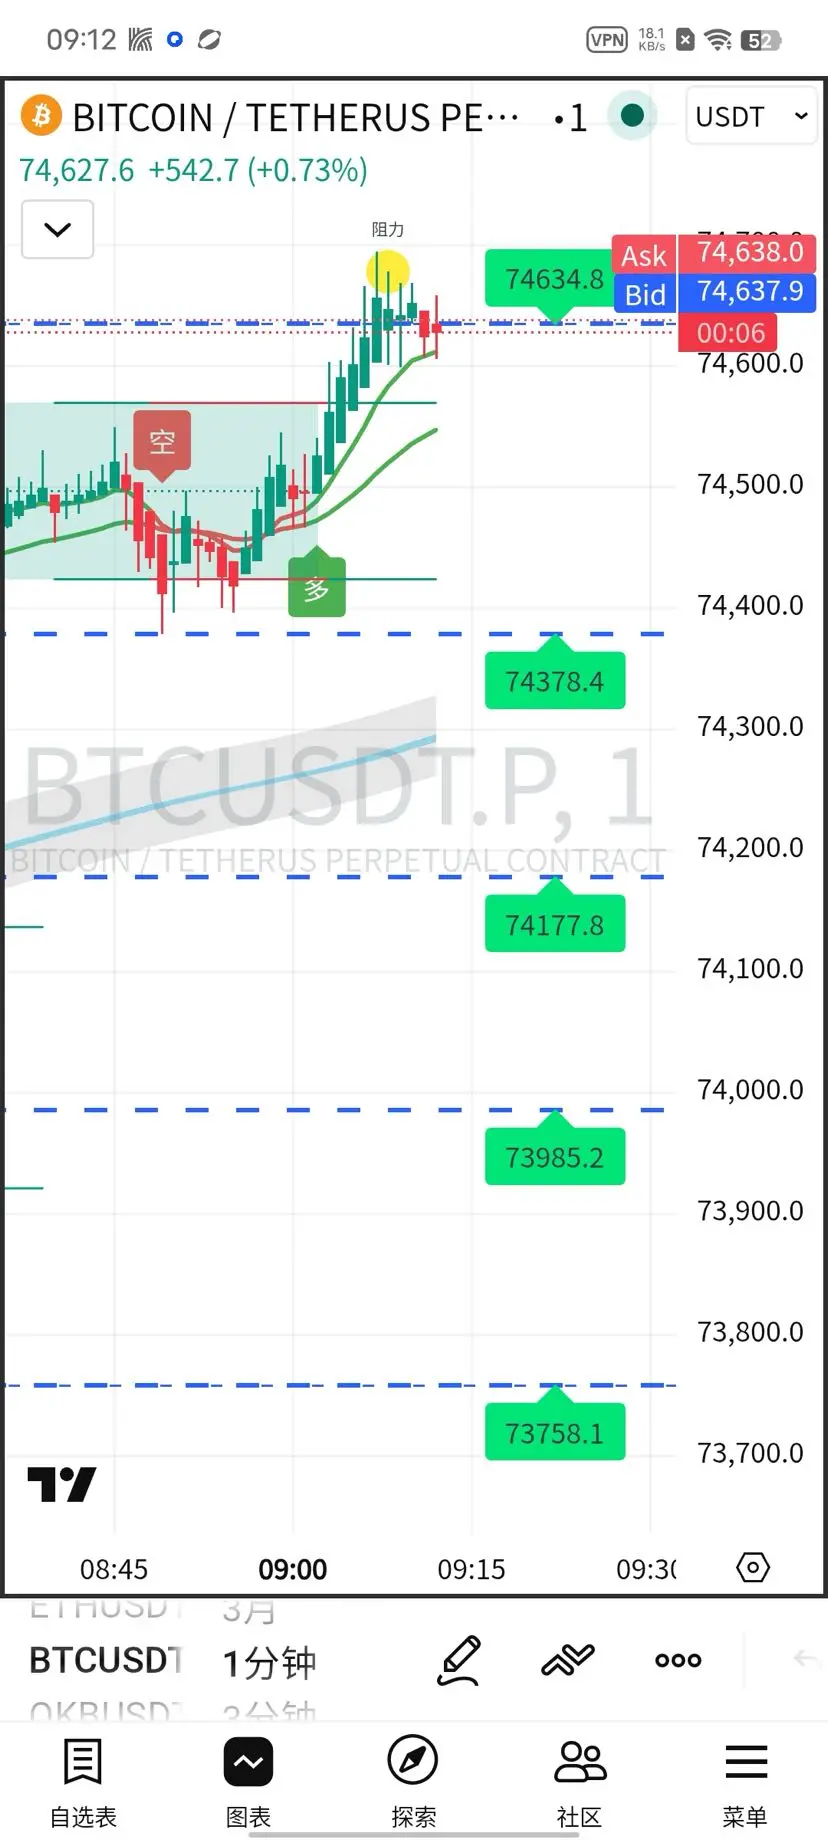
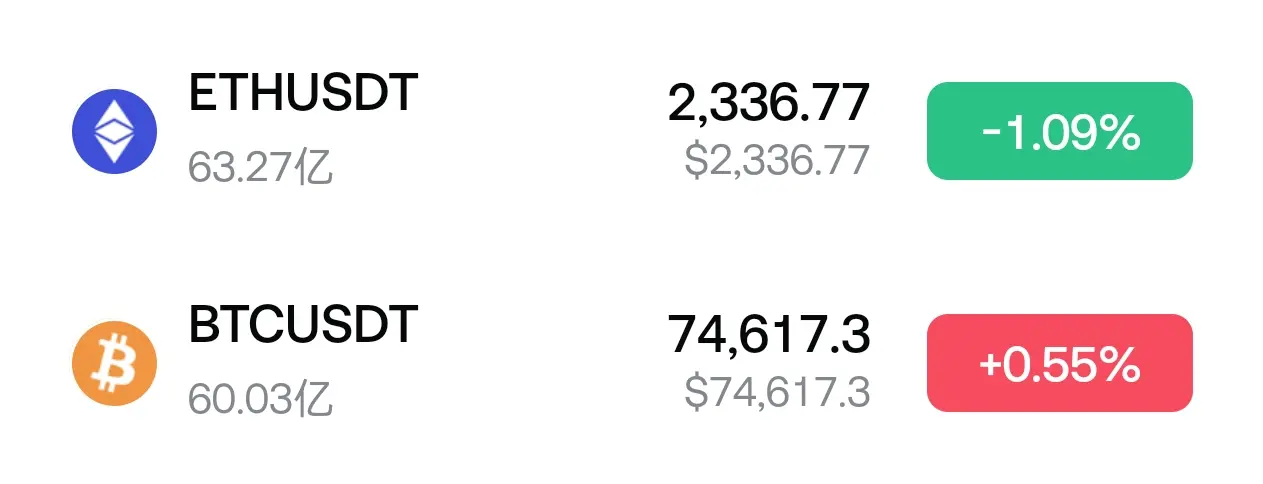
Buy Bitcoin short at the current price of 74,700-75,000, target 74,000-73,000, defend at 75,500!
Buy Ethereum short at the current price of 2,380-2,400, target 2,330-2,300, defend at 2,430!
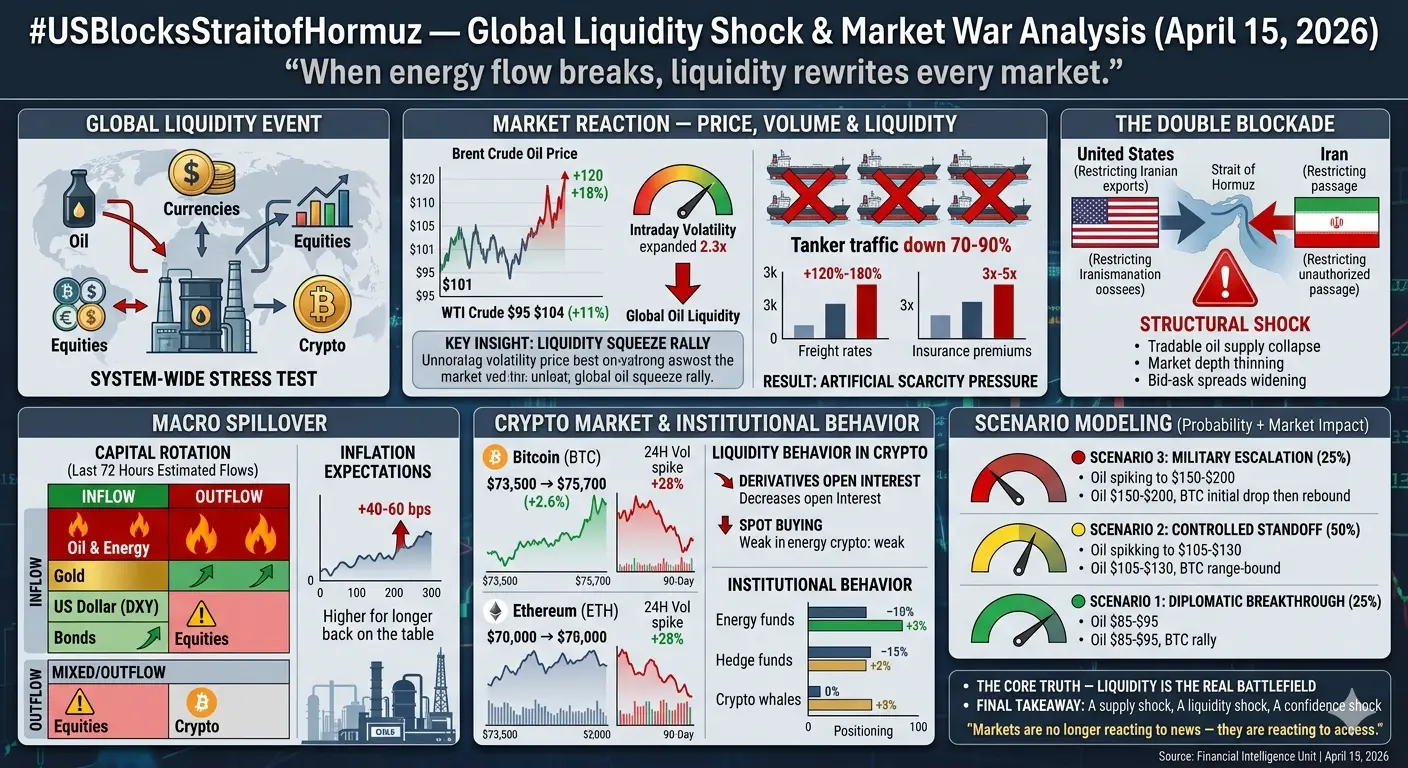
The strategy is time-sensitive; specifics are subject to private real-time guidance!#Gate13周年Dr.Han公开信 #加密市场回升 #美军封锁霍尔木兹海峡
repost-content-media
  • Reward
  • Comment
  • Repost
  • Share
JUST IN: Tether Launches Its Own Bitcoin and USDT Wallet
The USDT issuer has unveiled Tether Wallet, a self-custody application with support for USDT, USDA, XAUT, and Bitcoin, including the Lightning Network.
BTC0,04%
XAUT1,57%
post-image
post-image
  • Reward
  • Comment
  • Repost
  • Share
$ENJ Signal】1H level pullback confirmation, bullish momentum awaiting release
$ENJ Around 0.0607 near the upper band of the 4H Bollinger Bands shows selling pressure, 1H MACD histogram narrows, bullish momentum temporarily slows down.
Market depth indicates buy support remains solid, funding rate -0.3063% provides potential fuel for short squeeze.
Price consolidates around 0.0589, 1H EMA20 at 0.0524 forms the first line of defense below.
4H EMA50 has significantly risen to 0.0360, strengthening the medium-term trend structure.
Current volume has decreased compared to previous large-
ENJ34,52%
BTC0,04%
ETH-1,69%
SOL-2,8%
View Original
post-image
  • Reward
  • Comment
  • Repost
  • Share
JUST IN: Although Bitcoin rebounded to nearly $75,000 due to temporary relief on the geopolitical front, several analysts maintain that the market has not yet seen its definitive capitulation. In that scenario, the $50,000 level emerges as a potential accumulation zone before any sustained recovery.
BTC0,04%
post-image
post-image
  • Reward
  • Comment
  • Repost
  • Share
The digestion period after the breakout is it a bull correction or a trap for shorting?
In the past 24 hours, Bitcoin showed a typical sharp rise followed by a pullback pattern: an immediate surge in the morning, narrow fluctuations during the daytime with minimal retracement space, and a solid bullish structure; in the evening session, it moved in tandem with the US stock market, further gaining strength, reaching a high of 76,120, but then tested 75,600 twice and faced resistance both times, with short-term resistance at high levels clearly evident, ultimately falling back to the 73,700-74,6
BTC0,05%
View Original
post-image
  • Reward
  • Comment
  • Repost
  • Share
As of the morning of April 15, 2026, BTC spot is approximately $74,500; it is strong in the short term but faces heavy overhead resistance.
1. Today’s key levels (short-term)
• Support
◦ First support: $71,500–$72,000
◦ Strong support: $69,500–$70,000
◦ Trend support: $67,000 (2026 core line of defense)
• Resistance
◦ First resistance: $75,000–$75,900 (March high, dense trading zone)
◦ Strong resistance: $76,000 (Gamma peak)
◦ Breakout target: $79,500–$80,000
2. Brief technical analysis
• Daily
◦ Back above $70,000, the short-term structure is leaning bullish.
◦ Still near the upper edge of th
BTC0,05%
View Original
post-image
  • Reward
  • Comment
  • Repost
  • Share
market analysis 🥰🥰🌹🌹
gate liveLIVE
1.054
  • Reward
  • Comment
  • Repost
  • Share
$RAVE Is the funding rate this terrifying?
RAVE132,26%
View Original
post-image
post-image
post-image
  • Reward
  • Comment
  • Repost
  • Share
Five Technical Analysis Traps (And How to Avoid Them)
You've probably encountered situations where technical analysis fails. Even the strongest chart patterns can break down; let's break down the main mistakes.
Ignoring the Big Picture:
Day traders focus on 5-minute charts but forget the daily trend. This is a common mistake among beginners. A trading setup only makes sense if it aligns with the larger timeframe trend. Multi-timeframe analysis = the key to survival.
Ignoring Fundamentals:
Chart patterns are not isolated. FOMC meetings, CPI data, or even a random speech by a Federal Reserve off
View Original
post-image
[The user has shared his/her trading data. Go to the App to view more.]
  • Reward
  • Comment
  • Repost
  • Share
Yesterday's evening analysis publicly outlined the idea, and it has successfully broken through the 4830 target level! A single hit was a coincidence; consecutive accurate predictions demonstrate true strength!#现货黄金
View Original
post-image
post-image
  • Reward
  • Comment
  • Repost
  • Share
Bitcoin surged up to the 76000 level, then came under pressure and pulled back. The low dipped to around 73743 to find support. Currently, it is trading in a range around 74500, consolidating and organizing, and in the short term it maintains operation within the high-level range.

Morning strategy:
Go long on pullbacks near 74300—73800, with a target of 75200—76300. Set your stop loss reasonably on your own; operate steadily with a light position.

$BTC $ETH
BTC0,04%
ETH-1,69%
View Original
post-image
  • Reward
  • 1
  • Repost
  • Share
Schelling'sTheoryOfForce:
+
+
Three
Articles
xl618
618
#USBlocksStraitofHormuz
“When energy flow breaks, global liquidity rewrites every market.”
The ongoing US blockade around the Strait of Hormuz has evolved from a geopolitical confrontation into a system-wide global liquidity shock, impacting oil, currencies, equities, and crypto markets simultaneously. This is no longer a regional conflict — it is a global financial stress test where energy flow disruption is directly translating into liquidity fragmentation across all major asset classes.
The Strait of Hormuz — a critical maritime chokepoint connecting the Persian Gulf to global markets — ha
BTC0,04%
ETH-1,69%
post-image
post-image
  • Reward
  • 2
  • Repost
  • Share
discovery:
2026 GOGOGO 👊
View More
Further escalation? The U.S. is reportedly considering a blockade of the Strait of Hormuz - could extreme market volatility be next
gate liveLIVE
908
live-coin
  • Reward
  • Comment
  • Repost
  • Share
$COAI Signal】Waiting for a pullback, low-cost accumulation
$COAI 1H level surged higher then entered narrow consolidation, price stuck around 0.408. The upper band of the 4H Bollinger Bands at 0.4258 acts as clear resistance, the 1H MACD fast and slow lines crossed below the zero line, histogram turned negative, short-term momentum waning. Market depth is imbalanced at -5.96%, sell orders are thicker, active buying strength weakening.
Current risk-reward ratio is not ideal, chasing higher is riskier than potential gains. Waiting for a decent correction.
⚡Order placement: Price retraces
COAI37,07%
BTC0,04%
ETH-1,69%
SOL-2,8%
View Original
post-image
  • Reward
  • Comment
  • Repost
  • Share
Load More