Bitcoin (BTC) heads into the March monthly close as it risks its sixth straight month of losses.
-
BTC price action touches $65,000 to start the week as traders expect a copycat bear flag breakdown.
-
Iran headlines dominate the macro mood amid rumors of a US ground invasion.
-
March could go either way for Bitcoin as it sits on the edge of its first six-month losing streak since 2018.
-
Whales have begun to reduce their BTC exposure, adding to mid-term price headwinds.
-
Modest demand in the current trading range lacks “magnitude” to support a trend reversal.
BTC price action revisits $65,000
Bitcoin faced last-minute selling into Sunday’s weekly close, dropping to $65,000 before a modest rebound.
Data from TradingView shows $67,500 forming a focus for Monday, with traders still firmly risk-off on the short-term outlook.
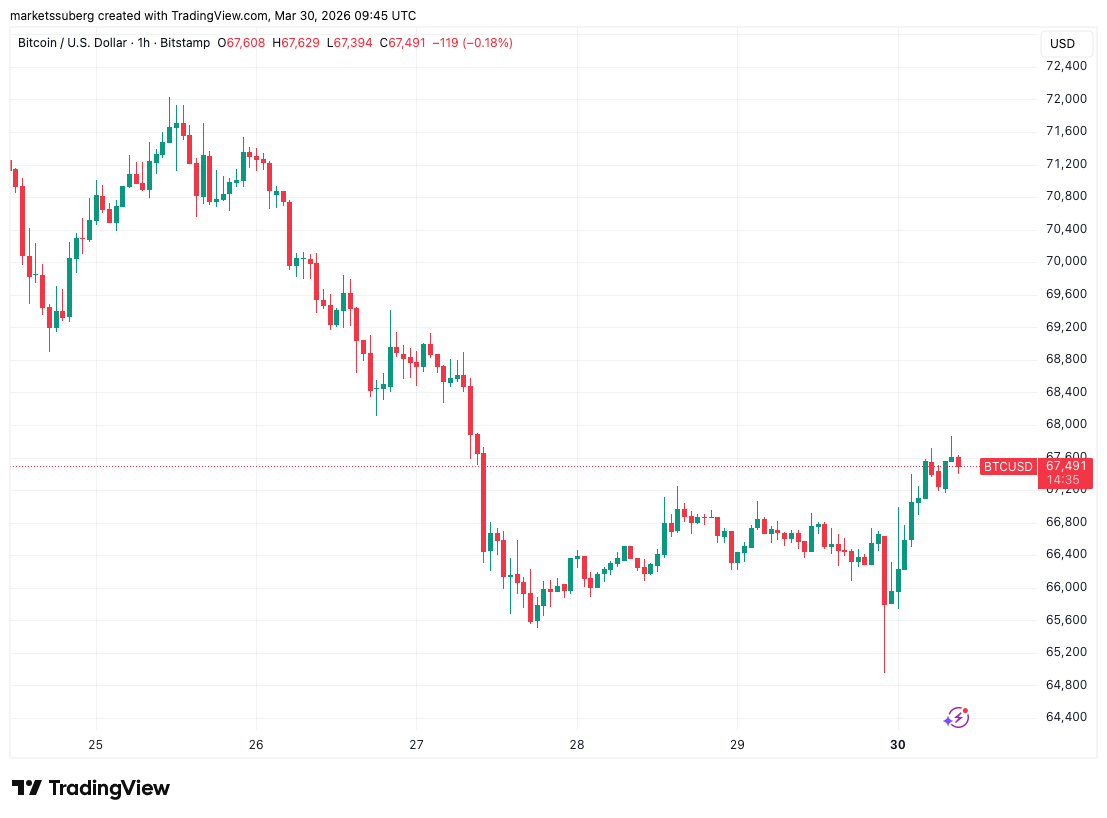
_BTC/USD one-hour chart. Source: Cointelegraph/_TradingView
In its latest post to Telegram channel subscribers, analytics resource Technical Crypto Analyst wrote:
“BTC is showing a clear shift in structure on the 4H, with price forming lower highs and losing the 68–69k support, which now acts as resistance; this confirms short-term bearish momentum, and unless price quickly reclaims 69–70k, the path of least resistance remains downward toward the 65k demand zone.”
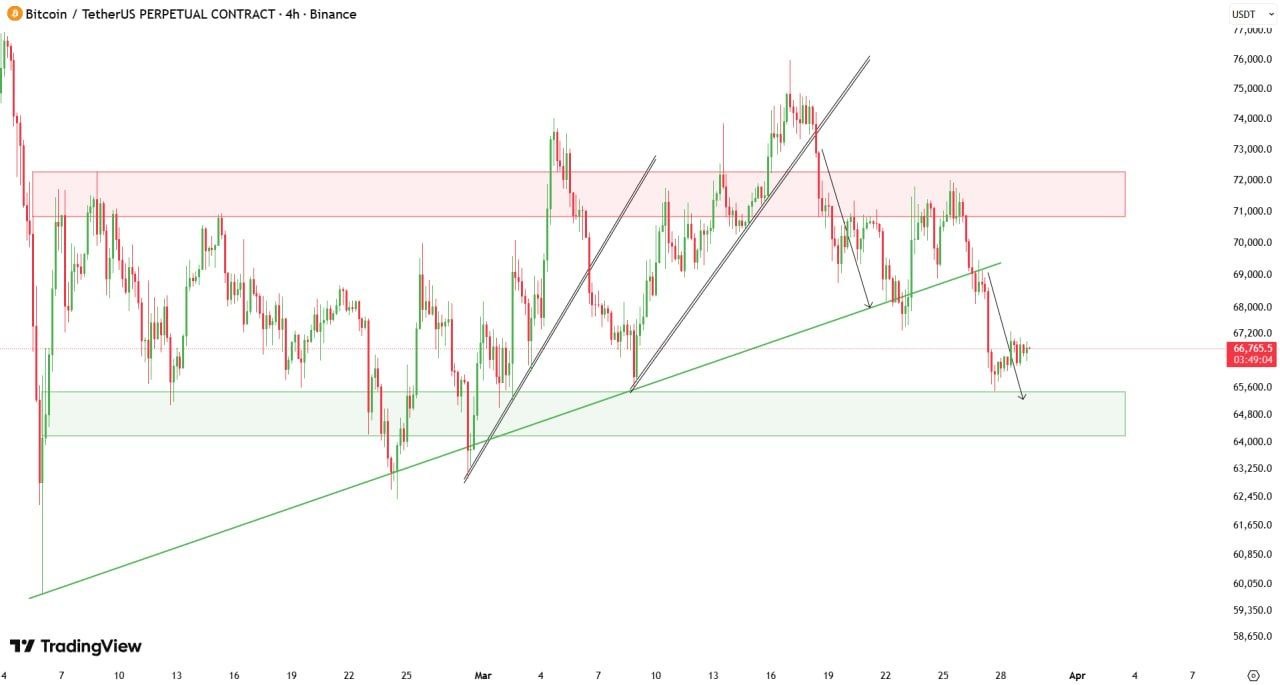
BTC/USDT four-hour chart. Source: Technical Crypto Analyst/Telegram
Last week, Cointelegraph reported on $70,000 rapidly becoming new resistance, with a key long-term trend line at $68,300 unable to function as support.
“BTC’s local uptrend is over - as expected - and price is starting to move lower again,” trader Jelle continued on Monday.
“Testing the previous lows as resistance as we speak; bears are back in the drivers’ seat.”
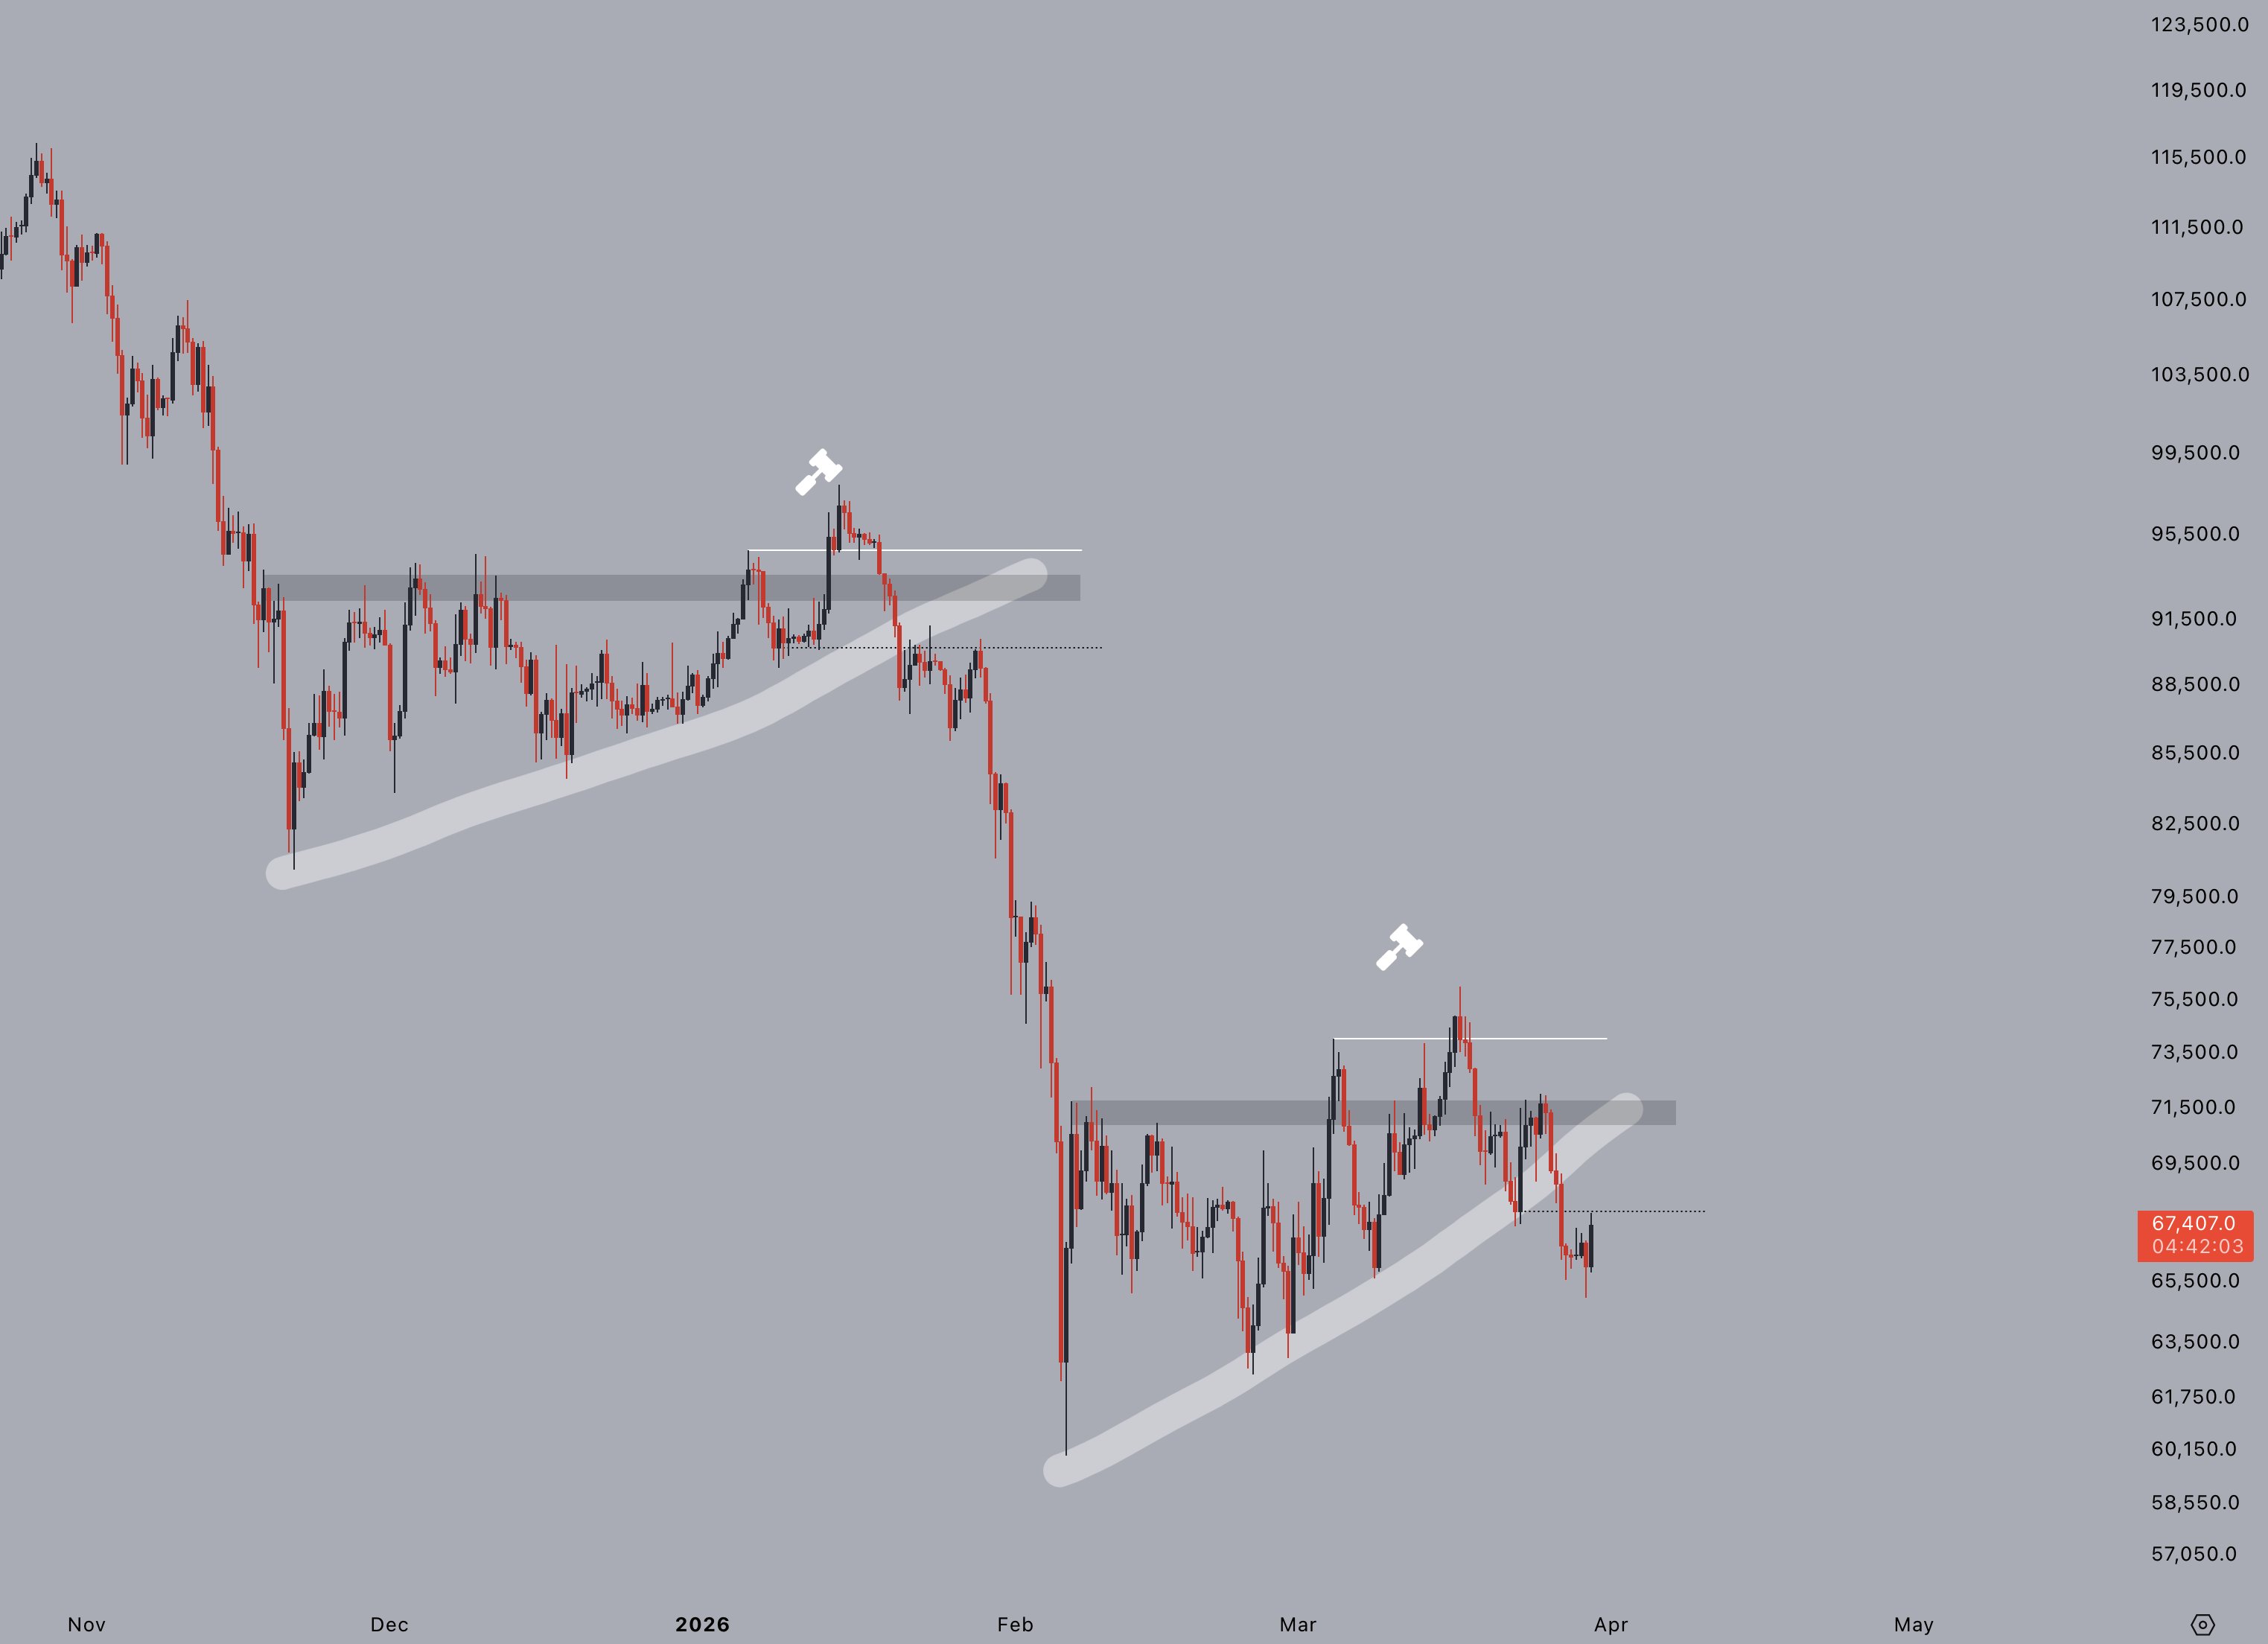
BTC/USD one-day chart. Source: Jelle/X
Others also focused on the continuing breakdown of Bitcoin’s second bear flag of 2026 — something that has already sparked sub-$50,000 BTC price targets.
“Repeating the exact same bear flag breakdown like we saw in January,” trader Roman summarized.
Iran war rattles stocks with inflation in focus
Macro markets remain highly sensitive to developments in the US-Iran war, and these keep coming as April arrives.
US President Donald Trump reported a “big day” militarily to start the week amid reports of plans for a ground invasion of Iran.
BREAKING: President Trump is weighing a military operation to extract nearly 1,000 pounds of uranium from Iran, per WSJ.
Details include:
-
This is considered a “complex and risky” mission that would likely put American forces inside the country for days or longer
-
Trump…
— The Kobeissi Letter (@KobeissiLetter) March 30, 2026
Asia stock markets opened sharply down on Monday as the impact of the oil-supply crisis made its presence felt.
“The ongoing tensions means that tanker traffic through the Strait of Hormuz remains limited, which continues placing strains on global energy markets along with uncertainty over access to fertilizer products for farming,” trading resource Mosaic Asset Company commented in the latest edition of its regular newsletter, “The Market Mosaic.”
“That’s weighing on the S&P 500, which has now closed out five consecutive weeks with a loss.”
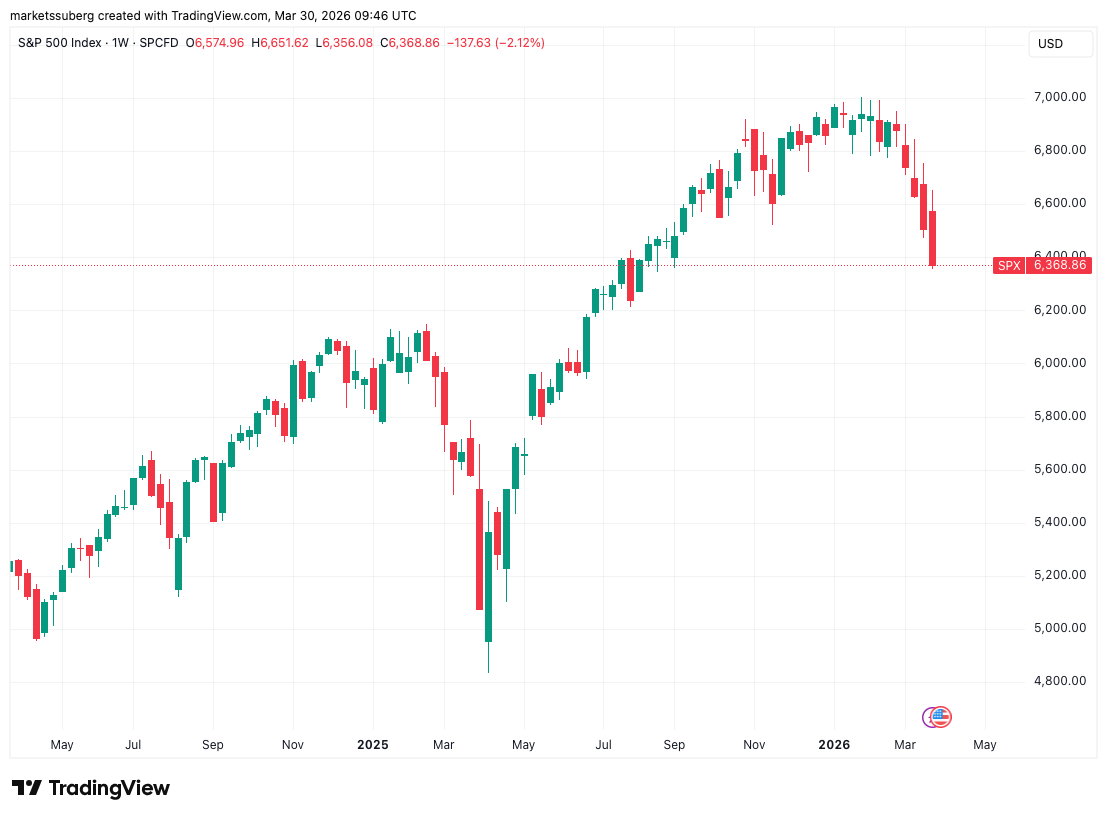
S&P 500 one-week chart. Source: Cointelegraph/TradingView
Mosaic noted that the S&P’s red streak was now the longest since the 2022 Russia-Ukraine war.
“The growing risk of lasting damage on the global economy from high energy prices is pressuring the stocks market,” it continued.
“But perhaps the most consequential spillover impact is on the outlook for inflation, and implications for interest rates on both the short- and long-end of the yield curve.”
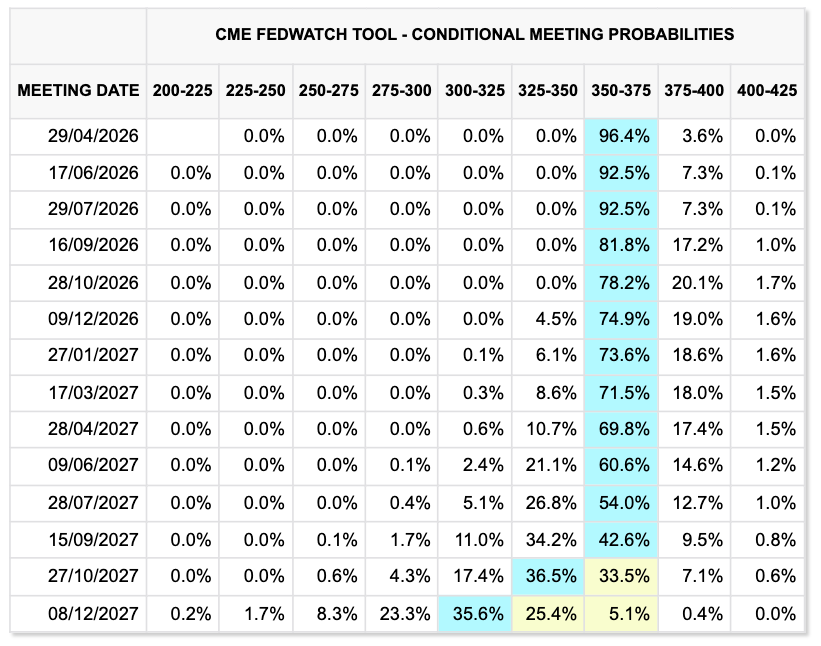
_Federal Reserve target rate probabilities (screenshot). Source: CME Group _FedWatch Tool
As Cointelegraph reported, crypto markets joined stocks in a comedown in late March as the odds of the Federal Reserve cutting interest rates in 2026 faded. At the same time, bets of a recession coming this year increased to their highest since last September.
Fed Chair Jerome Powell is due to take to the stage on Monday, potentially offering more insight into officials’ positions on the economy. Powell will participate in a moderated discussion at the Harvard University Principles of Economics Class.
“The outlook for rate cuts by the Federal Reserve is in jeopardy, while long-term rates are jumping higher as well due to uncertainty around inflation,” Mosaic added.
“The 30-year Treasury yield is close to breaking higher from an ominous pattern that could mean sharply higher rates ahead.”
March risks becoming sixth red BTC price month
Bitcoin bulls have little to boast about as March comes to a close, with BTC/USD about to seal its sixth consecutive month of losses.
Data from CoinGlass shows the result on a knife-edge ahead of the monthly close, with a “green” finish still possible.
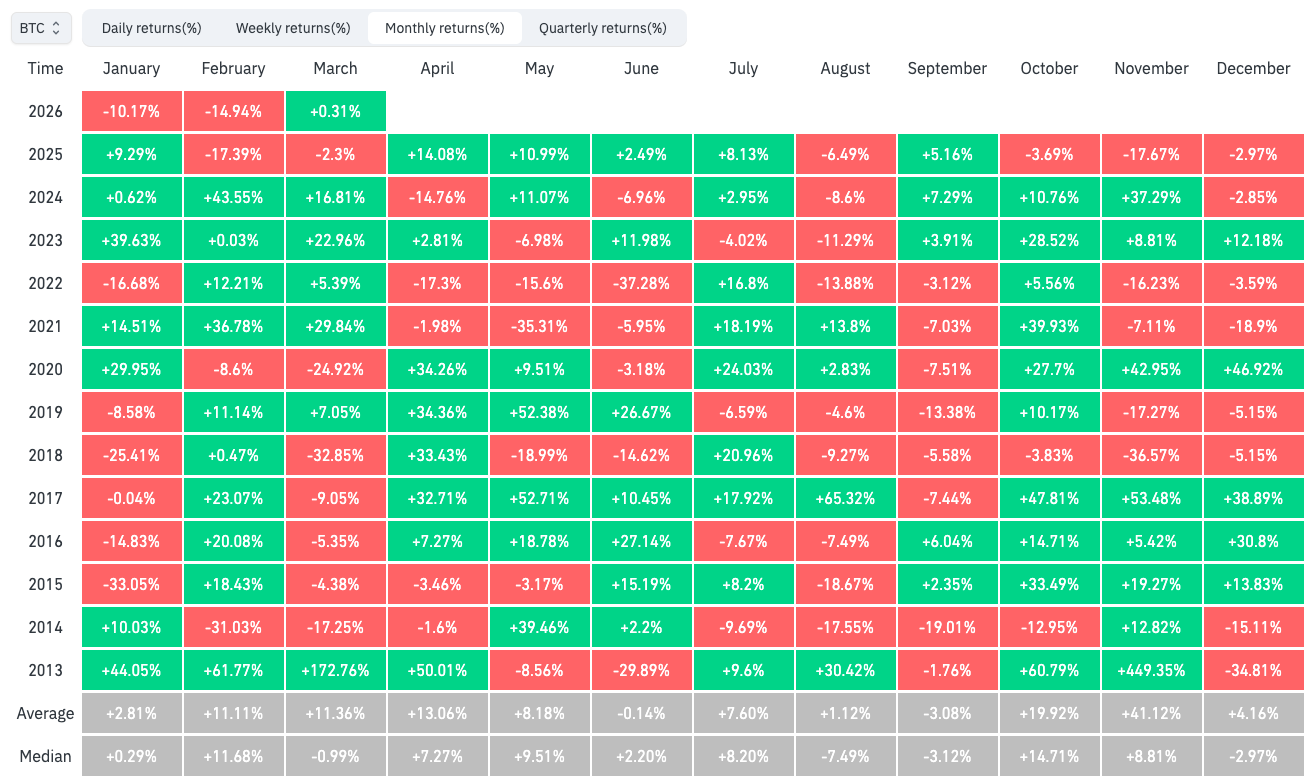
BTC/USD monthly returns (screenshot). Source: CoinGlass
If Bitcoin ends March lower than its starting price, it would mark the first six straight “red” months since the 2018 bear market.
“Very slow month so far all things considered. Bitcoin pretty much flat on the month just like last year,” trader Daan Crypto Trades commented about the CoinGlass data.
Daan Crypto Trades noted that over Bitcoin’s history, April has always been comparatively strong.
“Historically speaking, April is bitcoin’s 3rd best month in average returns,” he added.
Trader XO observed that in February 2019, following Bitcoin’s first six-month losing streak, monthly gains totaled 11%.
“If April sees an early sweep into the $55–60K range, it could create a compelling setup for mean-reversion longs imo… (much depends on the overall macro landscape),” they told X followers.
“That said, the higher timeframe structure remains in control until a clear contextual ‘structural’ shift is confirmed.”
Bitcoin whales flip defensive
Bitcoin whales have sparked concerns about future downward pressure on BTC price action.
After an “aggressive” accumulation period at the start of 2026, whales have started reconsidering their exposure, per data from onchain analytics platform CryptoQuant.
“A clear divergence has formed: on-chain buying has ceased while large-scale inflows to exchanges are rising,” contributor Sunny Mom wrote in a “QuickTake” blog post.
“Although the price continues to oscillate around $67K, the data suggests the market is entering another phase of hand-overs (re-distribution).”
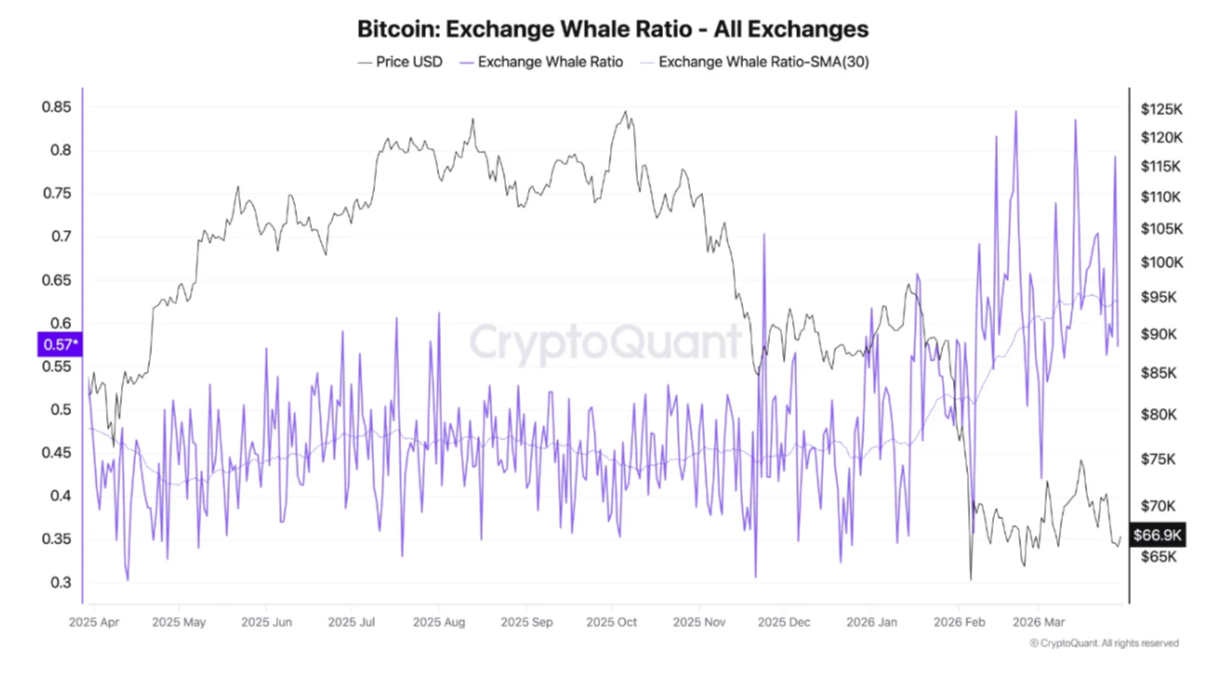
Bitcoin exchange whale ratio (screenshot). Source: CryptoQuant
CryptoQuant noted increasing whale presence among exchange inflows, with their wallets accounting for more of the largest inbound transactions.
“Furthermore, the stablecoin ratio remains at a low level, reflecting a slowdown in sidelined capital flowing into the market,” Sunny Mom added, referring to stablecoin trends.
“Without fresh liquidity, any attempt by whales to realize gains from their previous on-chain accumulation must rely on existing liquidity, making the price highly sensitive to selling pressure.”
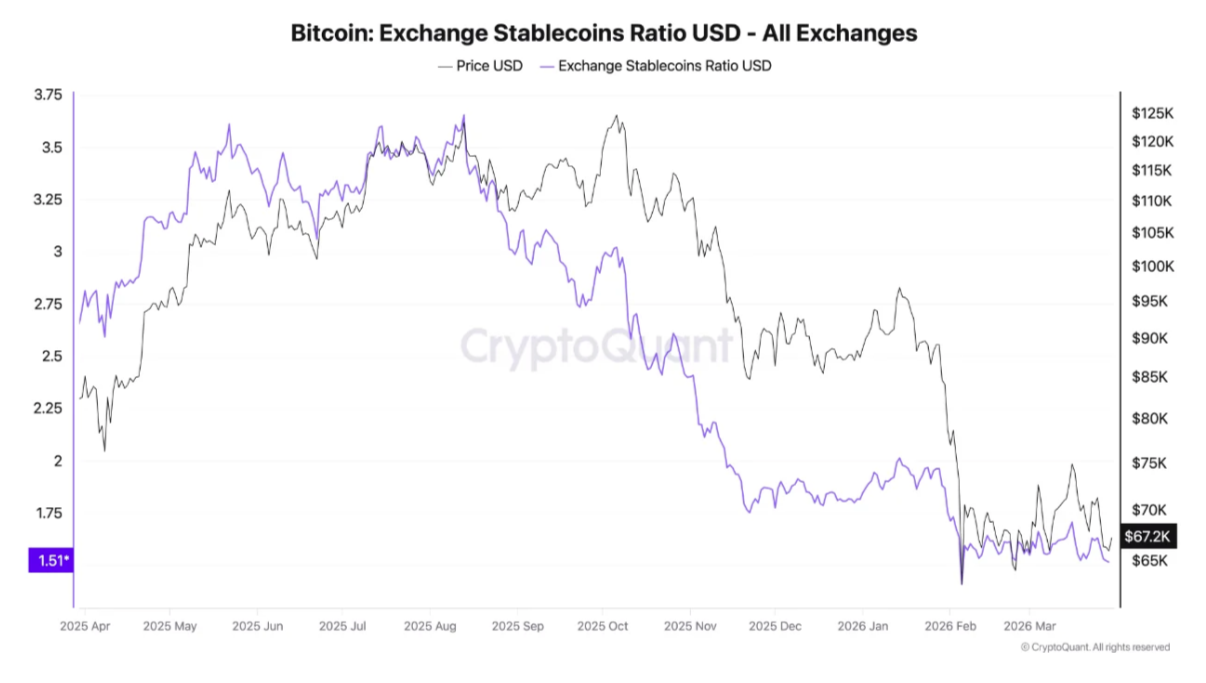
Bitcoin exchange stablecoin ratio (screenshot). Source: CryptoQuant
Newer holders sit on “massive supply overhang”
Offering a hint of optimism this week, onchain analytics platform Glassnode sees promise in overall demand tendencies at current prices.
**Related: **__Bitcoin value ‘off the chart’ as BTC price metric hits record lows in 2026
Between $60,000 and $70,000, it notes, new BTC buyers have their aggregate cost basis.
“BTC sits at the lower bound of the new buyers’ cost basis range ($60k–$70k),” it wrote in an X post on Monday.
“Supply accumulation in this range is notable, but the cluster is thinner than historical analogs that preceded a strong recovery.”
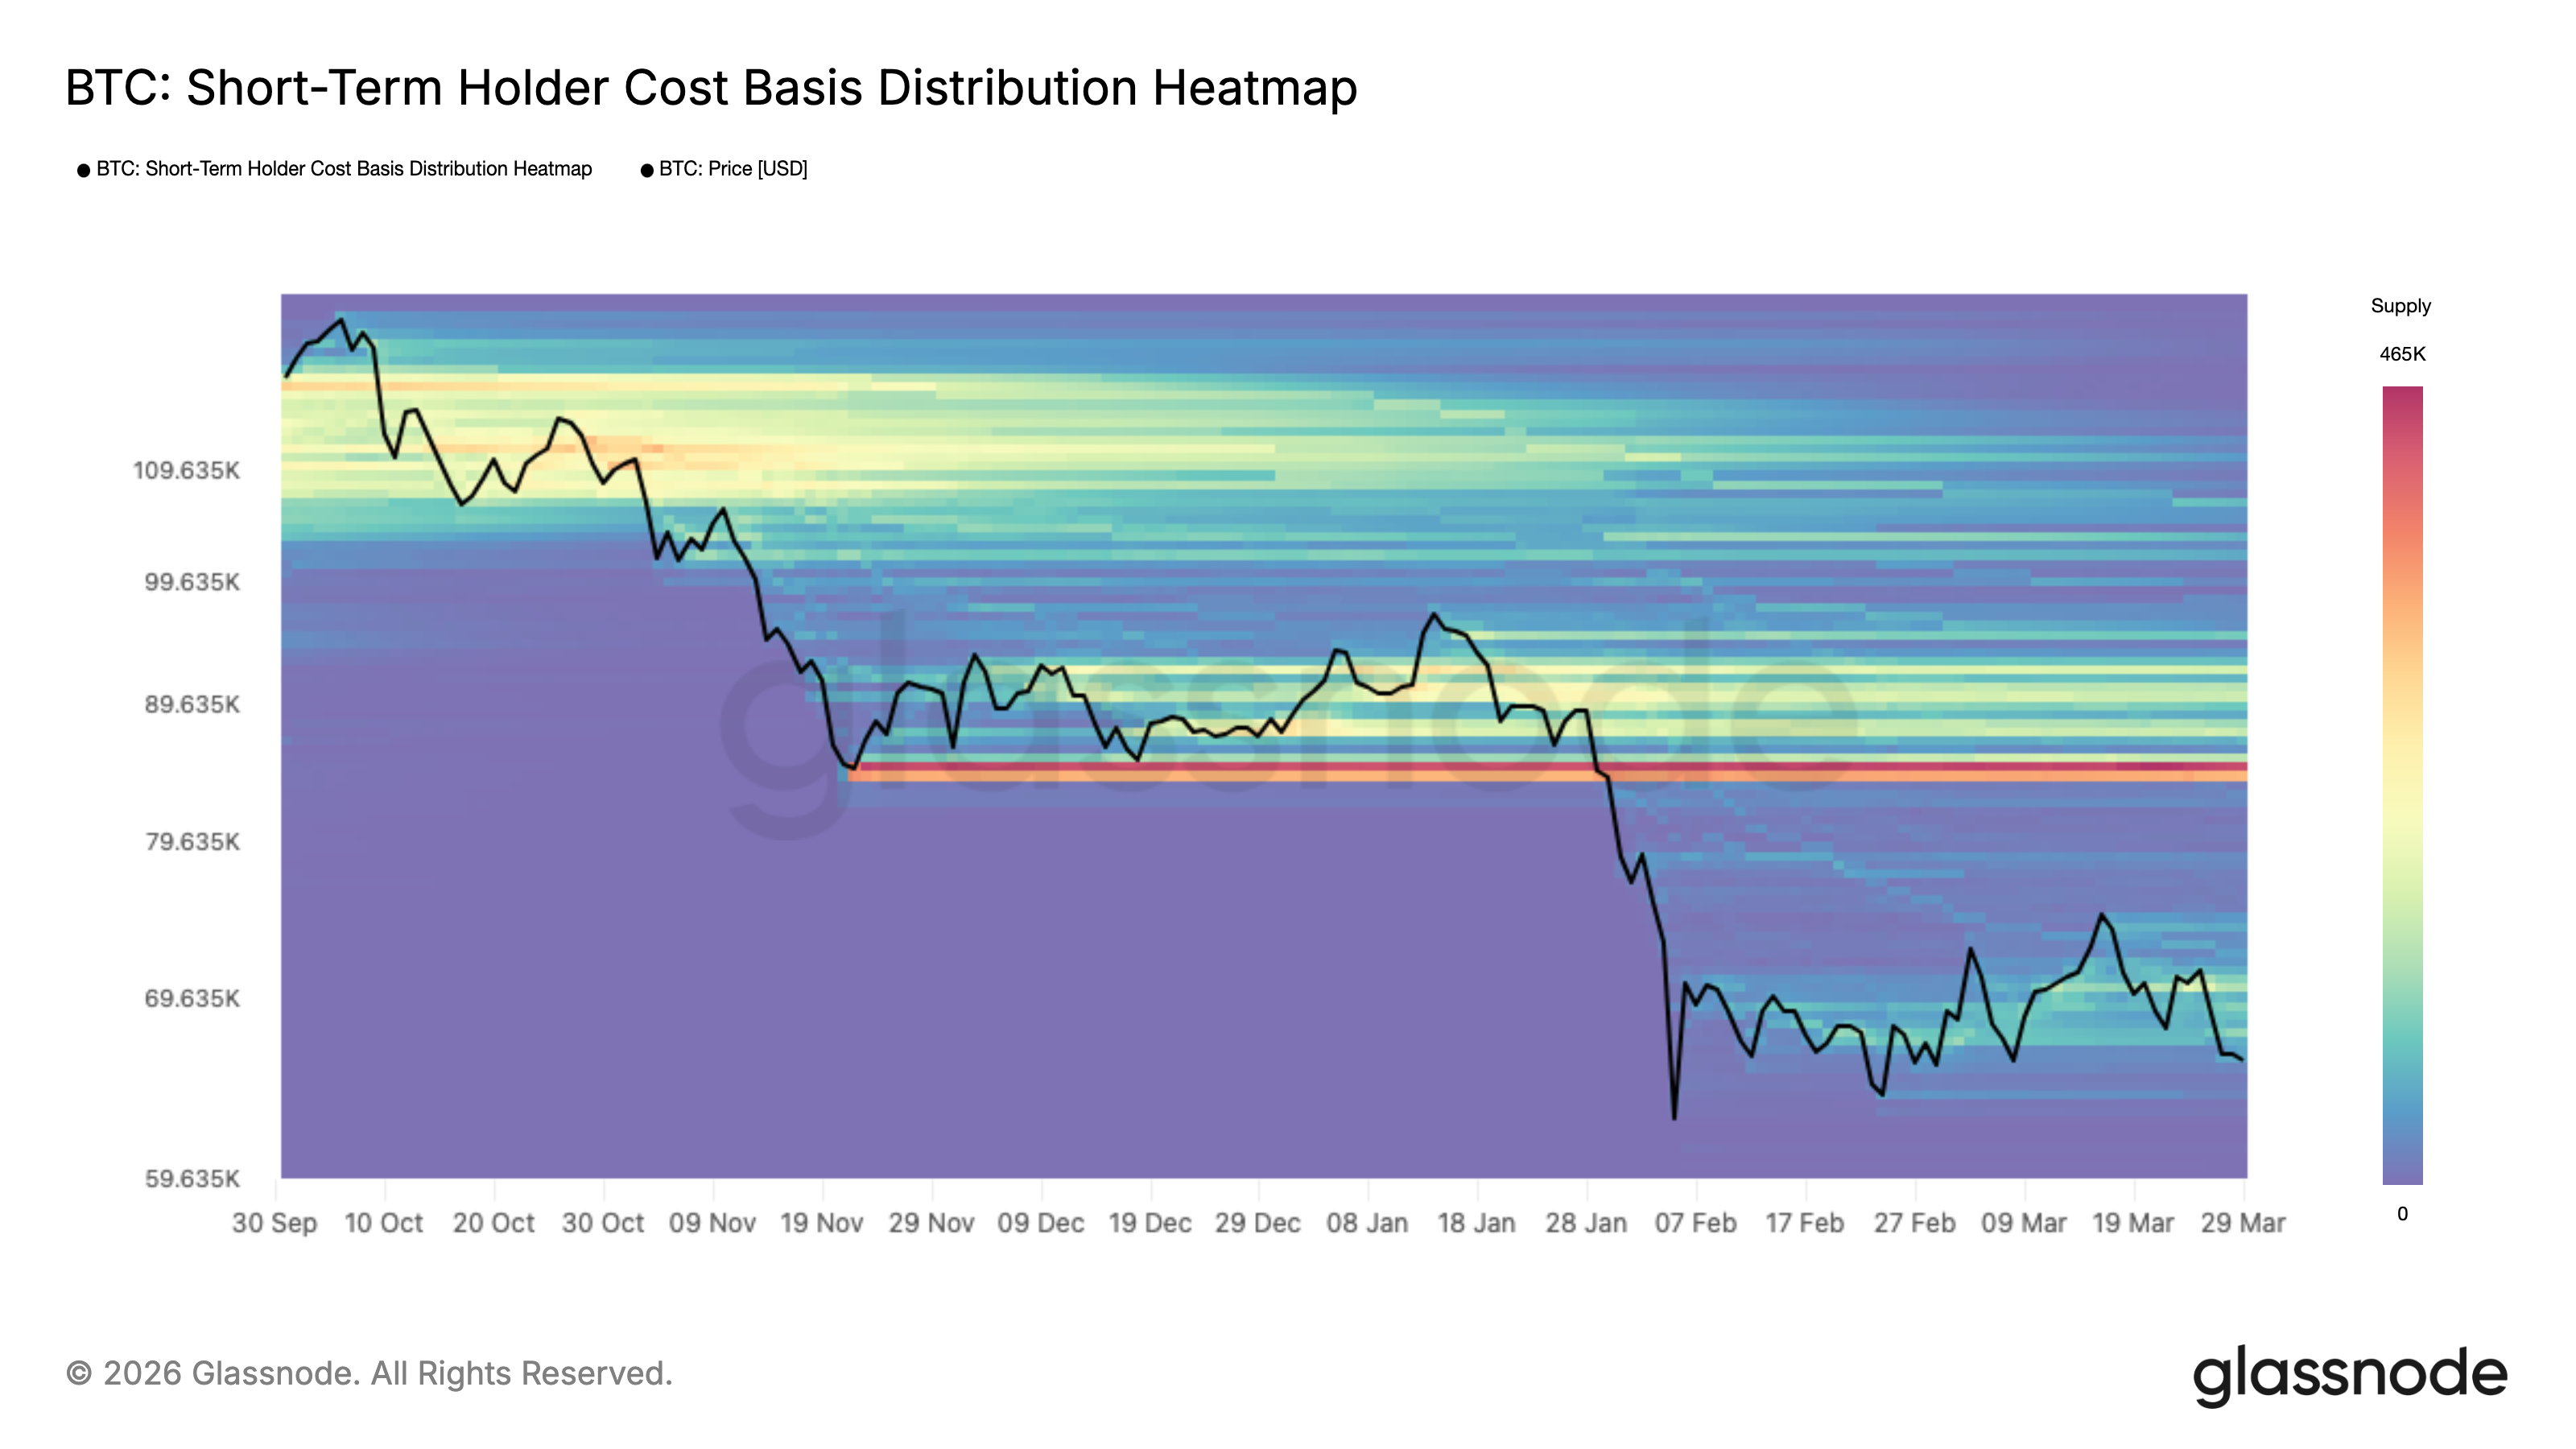
Bitcoin short-term holder cost basis distribution heatmap. Source: Glassnode
For a sustained rebound to begin, demand simply needs to ramp up — something not yet underway as traders stay nervous about geopolitical and macroeconomic shocks.
“The accumulation setup is constructive in form, not yet in magnitude,” Glassnode added.
Previously, Cointelegraph analyzed the various aggregate cost bases of Bitcoin investor cohorts, including that of short-term holders (STHs), the majority of whom are now underwater on their BTC holdings.
Last week, CryptoQuant calculated STH share of the overall supply at 5.7 million BTC, with 92% sitting on losses.
“That’s a massive supply overhang,” it warned.
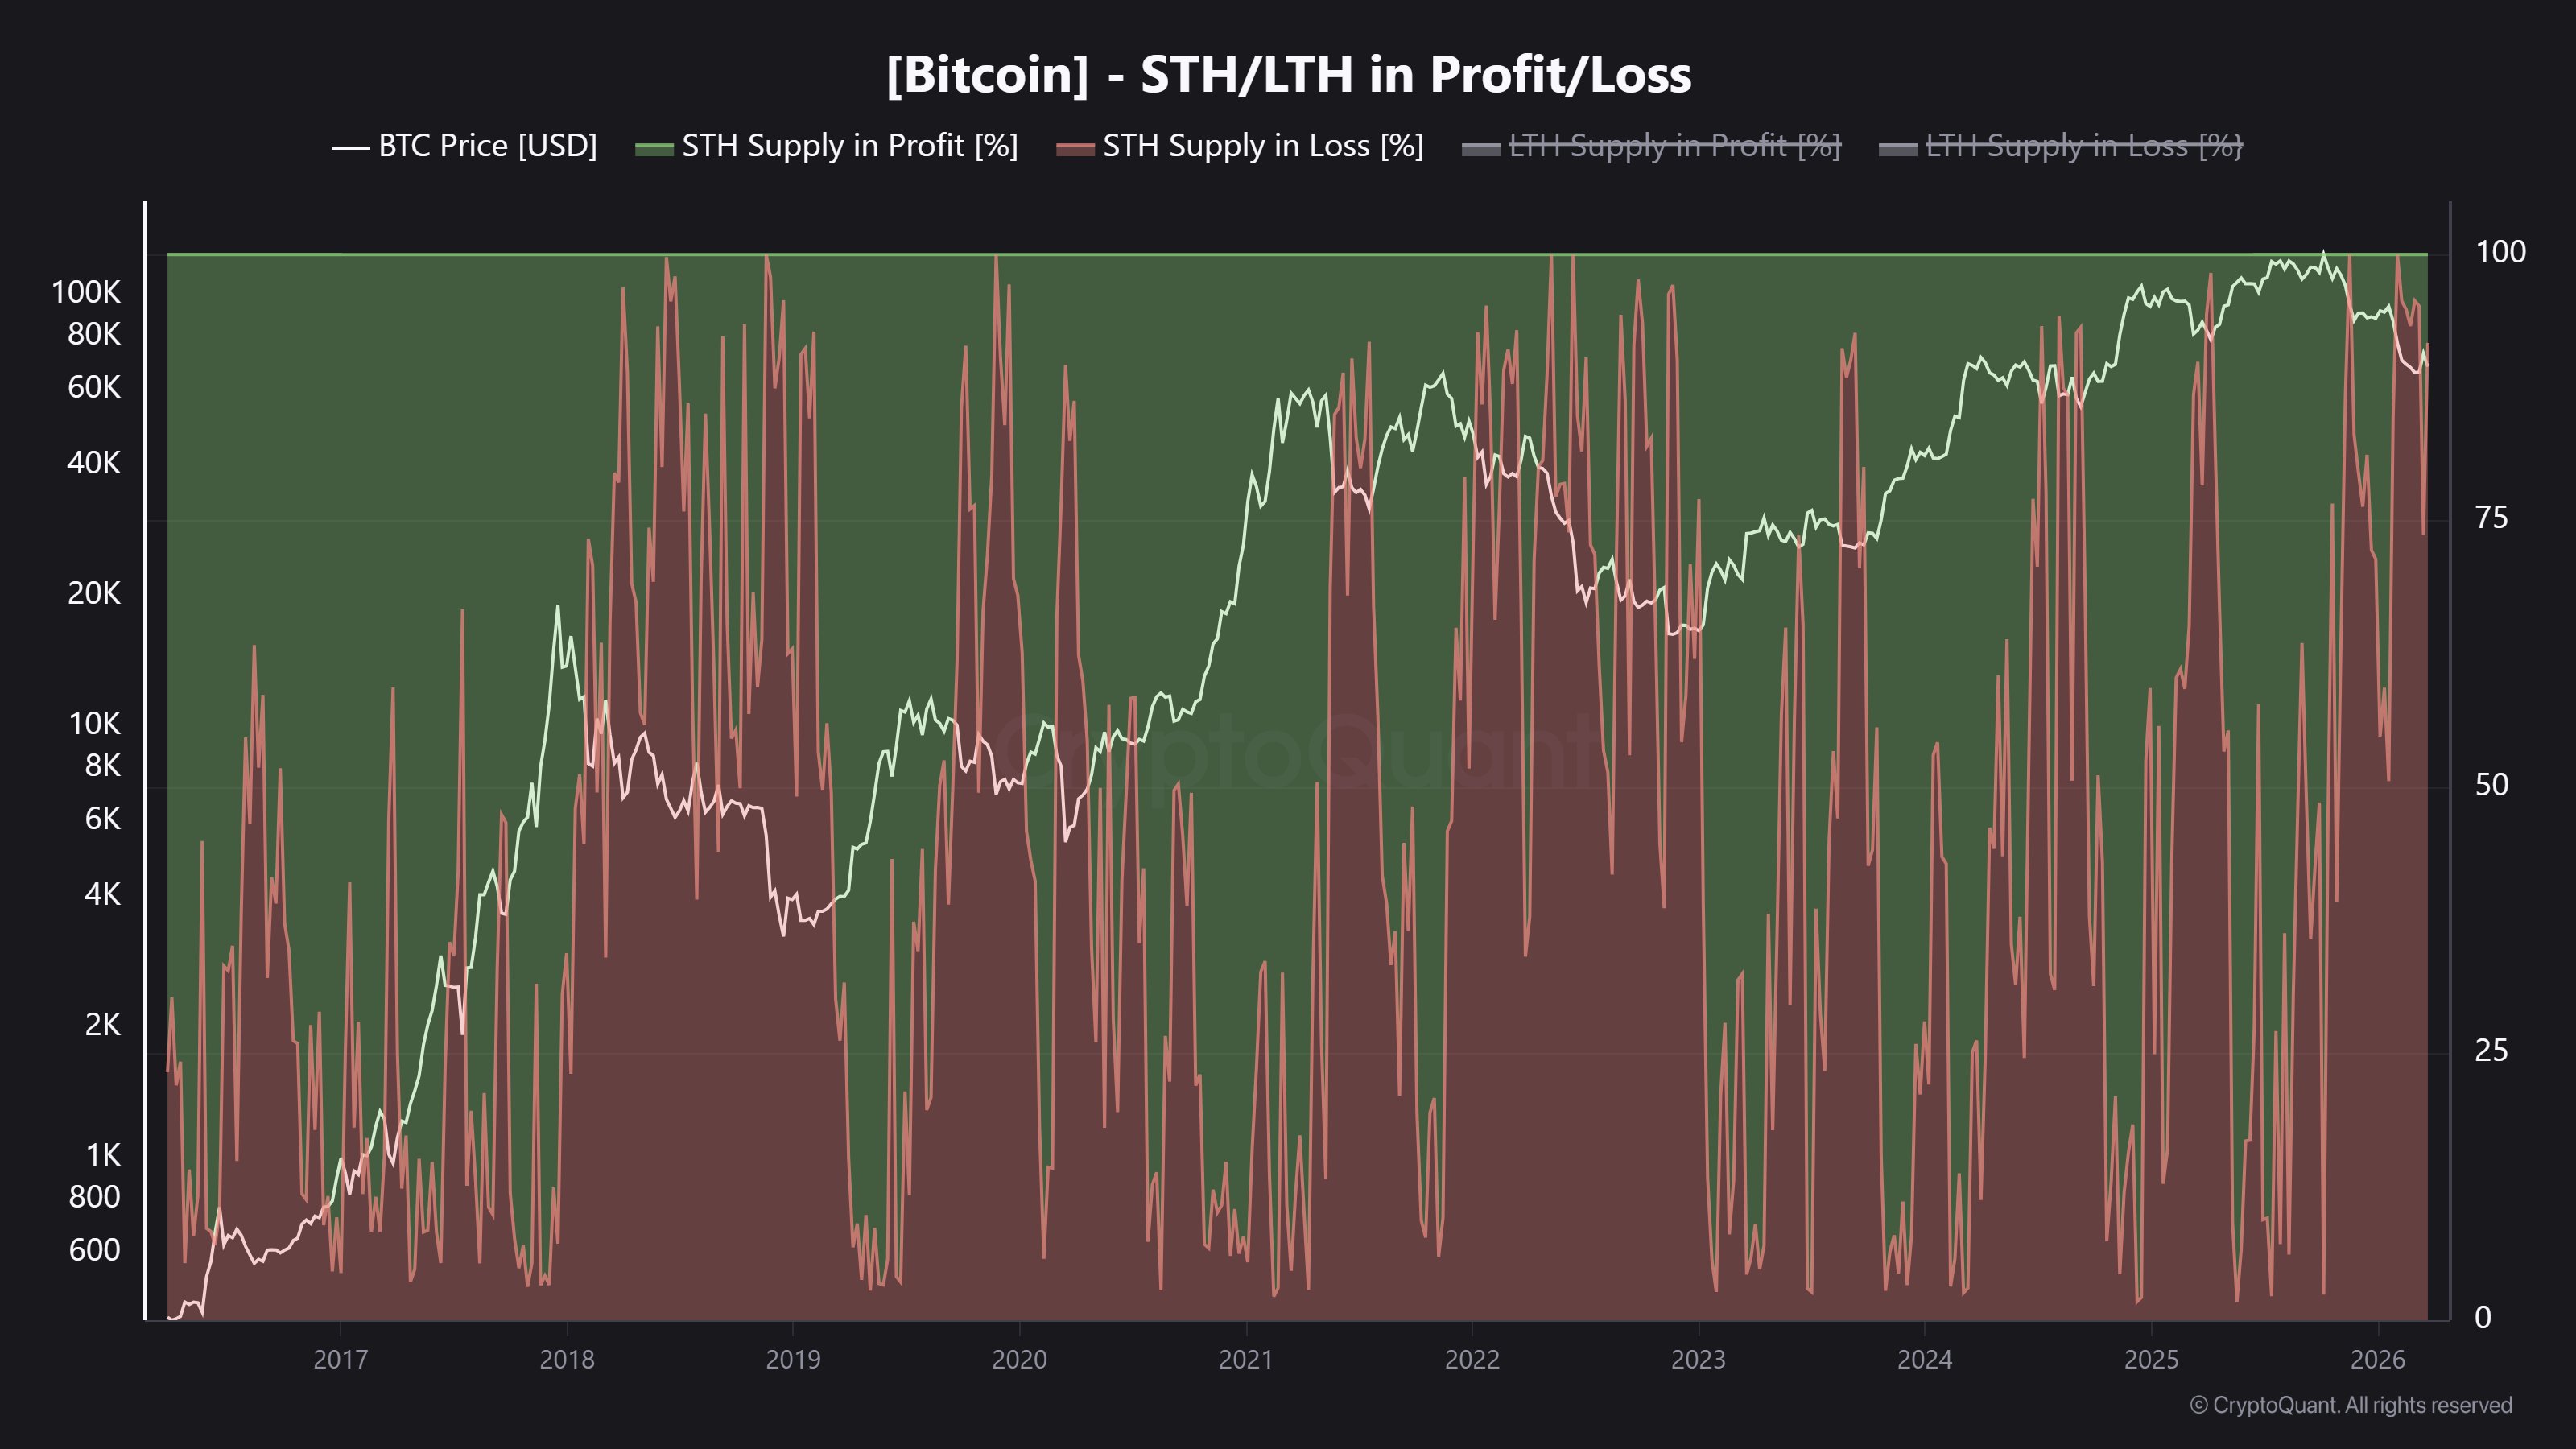
Bitcoin STH in profit/loss. Source: CryptoQuant/X
This article is produced in accordance with Cointelegraph’s Editorial Policy and is intended for informational purposes only. It does not constitute investment advice or recommendations. All investments and trades carry risk; readers are encouraged to conduct independent research before making any decisions. Cointelegraph makes no guarantees regarding the accuracy or completeness of the information presented, including forward-looking statements, and will not be liable for any loss or damage arising from reliance on this content.
- #Bitcoin
- #Bitcoin Price
- #Markets
- #Market Analysis
