Bitcoin enters the weekend with a broken short-term structure, increasing macro pressure, and a political factor sitting close to the center of the market’s risk map.
In the past two weeks, the technical setup has weakened step by step. The macro context continues to tighten as U.S. Treasury yields rise, while Middle Eastern risks spill over into oil prices, inflation expectations, and interest-sensitive assets.
On top of that is a familiar variable: public statements from President Donald Trump regarding Iran, continuously shifting sentiment in the stock, bond, oil, and crypto markets.
His previous remarks over the weekend about tariffs, Venezuela, or Greenland had similar impacts. Notably, most of his major announcements this year occurred when the market was closed, and the current context opens up the possibility for a new move.
In the price channel monitored since the launch of the Bitcoin spot ETF, BTC has completed the hardest part of a downward correction. The price has lost the range above $73,000, failing to convincingly reclaim the $71,500 mark, sliding below $68,000, and continuing to break through $66,900. This series of events pushed the market into lower price territory as Friday’s trading session came to a close.
In the current structure, the next support zone is around $61,700–$61,100. Here, $61,700 stands out as a crucial level that could be tested if macro pressure persists and no new signs of easing emerge from Washington.
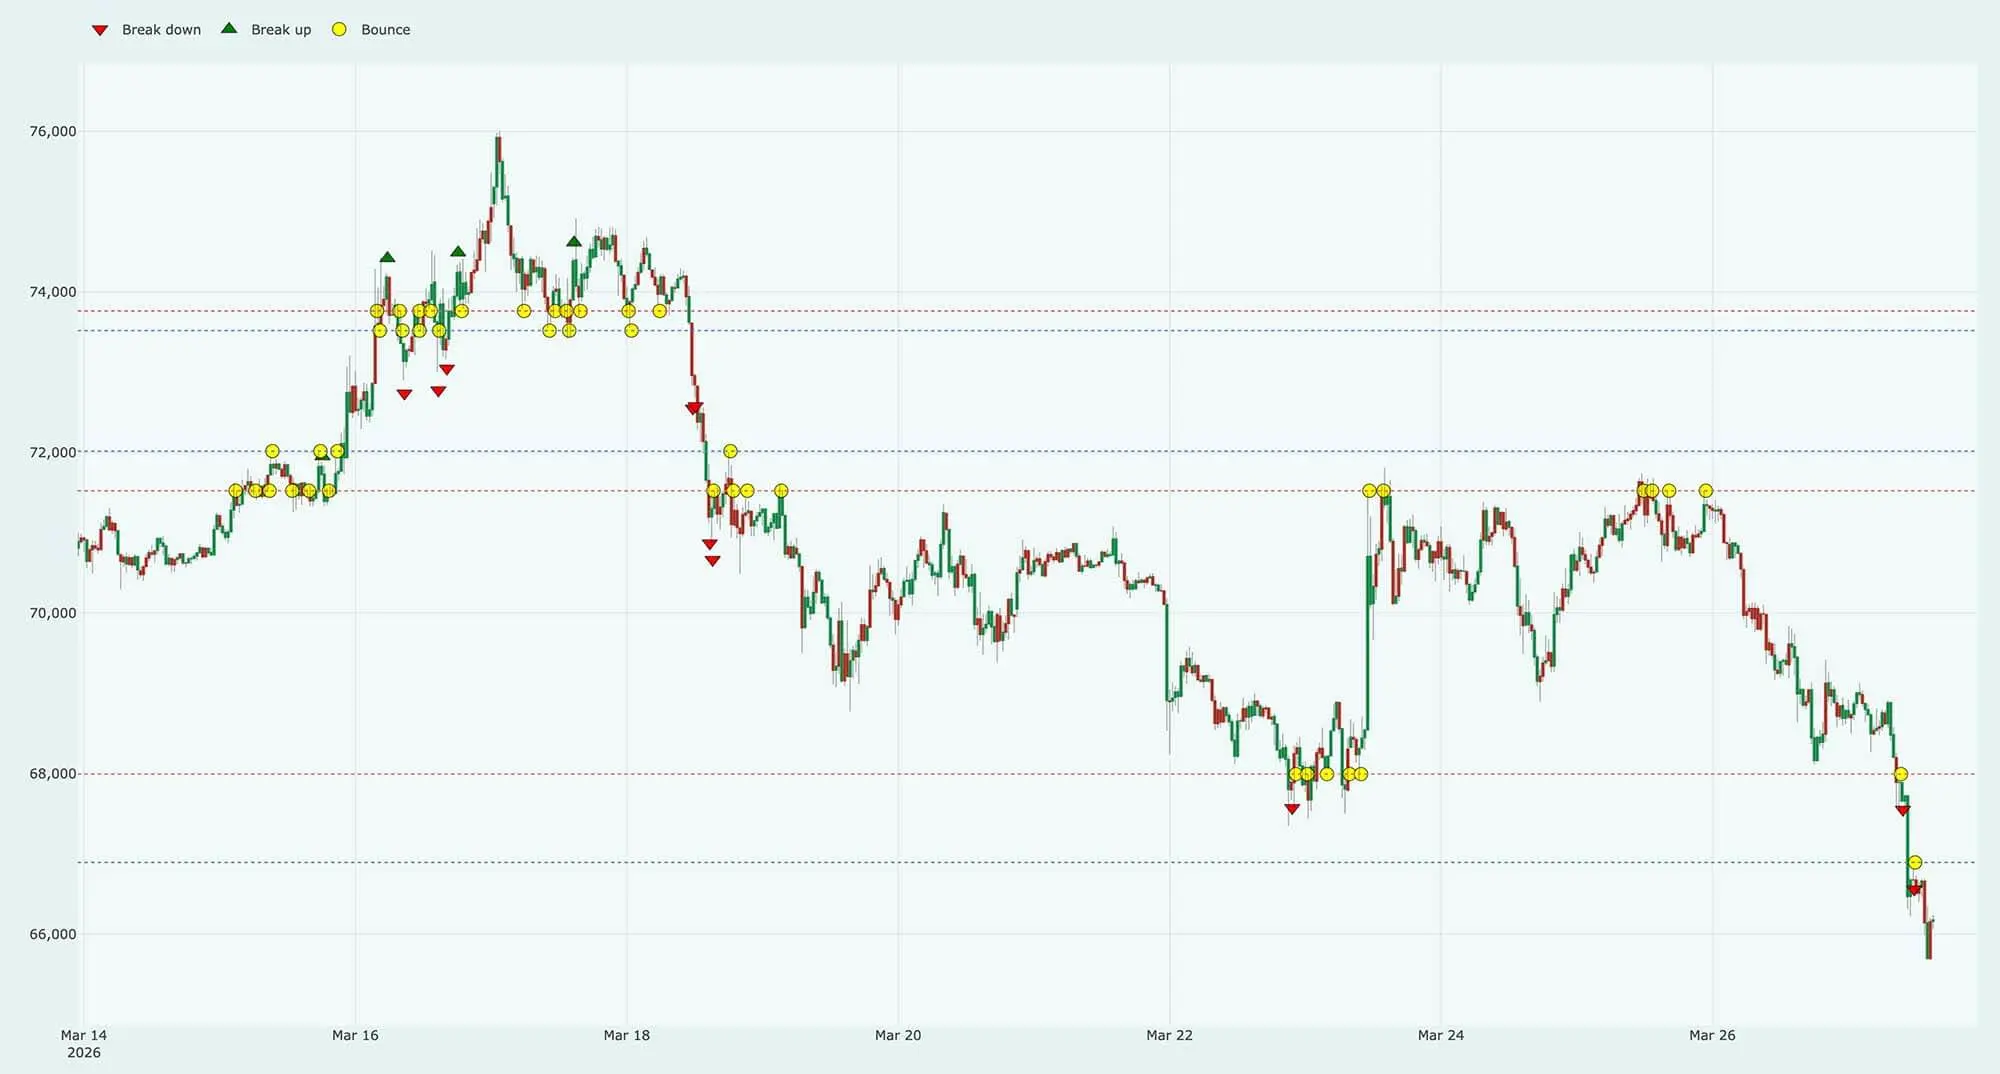 The Bitcoin price chart shows a sharp decline over the weekend to around $61,000 after several days of volatile trading.
Data from the price channel tool indicates that Bitcoin still respects the market structure. In 400 interactions with the channel’s boundaries, there were 304 rebounds, 44 breakouts to the upside, and 52 breakdowns. This shows that the market does not move randomly but moves methodically between price zones, making the current weakness carry clearer analytical significance.
The Bitcoin price chart shows a sharp decline over the weekend to around $61,000 after several days of volatile trading.
Data from the price channel tool indicates that Bitcoin still respects the market structure. In 400 interactions with the channel’s boundaries, there were 304 rebounds, 44 breakouts to the upside, and 52 breakdowns. This shows that the market does not move randomly but moves methodically between price zones, making the current weakness carry clearer analytical significance.
The market is shifting from this channel to another, with each failure to reclaim the old levels turning those areas into resistance. The clearest example is $71,500: once a key support in mid-March, it has become strong resistance after being broken on March 18.
Bitcoin has repeatedly returned to test this area around March 23 and March 25 but failed each time, thus making $71,500 a critical threshold for any recovery attempts. Below that, $68,000 becomes the next pivot point.
After temporarily returning to the price channel around March 22, the potential for stabilization was briefly opened but quickly narrowed on March 27 when BTC again lost the $68,000 mark, further breaking $66,900 and failing in the first retest from below.
Currently, the market structure has clearly formed:
- Nearest resistance: $66,900
- More important resistance: $68,000
- Structural recovery threshold: $71,500
On the downside, the $61,700–$61,100 area is the next support. When a channel is broken without reclaiming it, the lower channel becomes the natural target — and that is the state BTC is entering this weekend.
The macro factor further reinforces this downward pressure. In the March 18 meeting, the U.S. Federal Reserve maintained interest rates but emphasized that inflation remains high, while maintaining a cautious policy stance.
Crypto can still rise in this environment, but the pressure on the market structure will be greater as long-term yields increase and oil prices drive inflation risks.
This has been clearly reflected in the bond market. The yield on the 10-year U.S. Treasury bond hit its highest level since July, reaching 4.48% before easing slightly. More importantly than the specific number is the trend: yields are returning to high territory, while the market continues to price in geopolitical risk around energy and growth.
In this context, Trump’s remarks become a key variable for the weekend.
Earlier in the week, the market reacted positively when he signaled progress in negotiations with Iran: stocks rose, oil prices fell, and yields cooled. However, this effect did not last. By Friday, the market reversed as concerns returned, pushing oil prices higher and dragging down risk assets.
This pattern has become clear enough to be a factor to watch: Trump’s statements about Iran could create short-term volatility, especially when hinting at de-escalation or increased tensions.
For Bitcoin, this means:
- A diplomatic message could support a rally at the start of the week
- Conversely, a tough tone or lack of easing signals will keep the weakening structure under downward pressure
Therefore, the $61,700 mark needs to be closely monitored. The market doesn’t need a new shock to drop here — the short-term support zones have been broken.
More importantly, Bitcoin is no longer trading as if it is trying to recover, but is instead determining the next lower equilibrium zone.
The question is not whether BTC can rise, but whether the upward moves will be strong enough to reclaim the lost levels and turn them back into support.
The current thresholds are very clear:
- Reclaiming $66,900: reduces short-term downward pressure
- Breaking $68,000: opens the possibility for a technical rebound
- Conquering $71,500: significant structural reversal
Conversely, if BTC continues to be held below $66,900 and cannot reclaim $68,000, the $61,700 area will be the main support heading into the weekend, with $61,100 as a deeper bottom of the same price zone.
This development aligns with the characteristics of the current decline: weakening step by step, orderly, not panic.
Each time a level is lost — from $73,800 down to $71,500, then $68,000 and $66,900 — the market’s stabilization potential shrinks. Each failure to reclaim old levels increases the pressure downward toward lower regions.
As Friday’s session closes, Bitcoin is in a narrow but clear state: the short-term structure has broken, macro pressure remains high, and the risk of political events still hangs in the air.
The weekend map, therefore, is quite simple: reclaim $66,900 and $68,000 to open up a rebound; if not, $61,700 will be the next level the market targets.
