Dogecoin has a history of following patterns. Not always perfectly, but close enough that the repeats are hard to ignore. Bitcoinsensus’ laid out a macro chart that tracks DOGE’s cycles alongside Bitcoin’s, and the roadmap is pretty clear. The DOGE price is sitting at a spot that looks familiar. And if the pattern holds, the next move could be significant.
- The Macro Cycles That Keep Repeating
- The Current Cycle and Following Bitcoin’s Lead
- What Comes Next for DOGE
The Macro Cycles That Keep Repeating
So if you pull up the chart Bitcoinsensus shared, the pattern jumps out at you. Three clear cycles. Cycle 1 starts at the bottom, rips up to a peak, then corrects. Cycle 2 does the exact same thing. Cycle 3 is playing out. Each cycle has a similar shape. A long accumulation phase, a sharp breakout, a parabolic run, and then a deep correction.
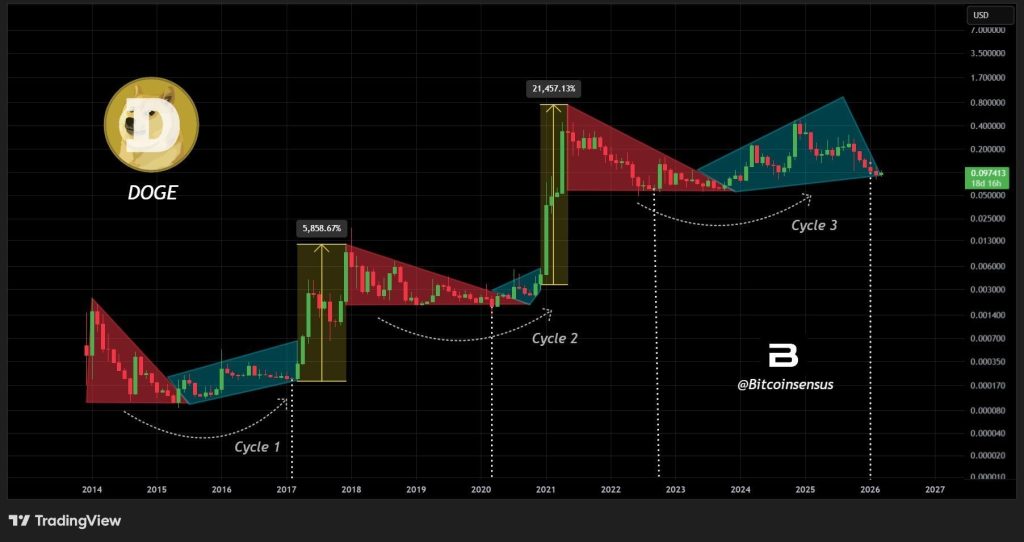
Source: X/@Bitcoinsensus
The numbers on the chart are staggering. Cycle 1 saw gains of over 5,800 percent. Cycle 2 was even bigger, with a 21,457 percent rally. That’s the kind of move that turns small bets into life-changing money. Cycle 3 already had its run, peaking near $0.70, and now it’s in that ugly correction phase. The DOGE price is sitting around $0.097 right now, deep in the red from those highs.
The Current Cycle and Following Bitcoin’s Lead
So after that big run-up, DOGE pulled back, which was expected and now it’s just kind of sitting there, grinding sideways. That’s actually pretty normal. Previous cycles show this same kind of pause before another leg up happens. It’s not quick, it takes time, but the pattern is familiar.
What’s interesting right now is that DOGE is hovering around $0.097, and that’s actually above where the last two cycles found their bottom. Cycle 1 bottomed around $0.000020, Cycle 2 around $0.00070.
Each time, the low was higher than the one before. That’s generally a good sign, it means buyers are stepping in earlier, at higher levels. And so far this cycle, we haven’t broken below those levels. It’s holding above $0.09. Does that guarantee anything? No. But it does tell you the structure is still there. Higher lows are basically how uptrends are built, slowly at first, then suddenly.
There’s also the Bitcoin connection. Bitcoinsensus has pointed out that DOGE tends to track alongside Bitcoin pretty closely, not in a perfect lockstep kind of way, but the big-picture rhythm is similar. Bitcoin has its well-known cycle of peaks, corrections, and new peaks, and DOGE tends to follow that same pattern, just with more extreme swings in both directions.
If Bitcoin moves into the next phase of its cycle, history indicates DOGE usually comes along for the ride. This cycle does feel a bit stretched out compared to previous ones, so either the consolidation is just taking longer, or the next move is being delayed. But either way, the chart is giving you a roadmap, just not a guarantee.
Is Ondo Finance (ONDO) the Strongest Real-World Asset Play Right Now? Data Shows Why Big Buyers Are Stepping In_**
What Comes Next for DOGE
The DOGE price is sitting in a zone that looks like the bottom of Cycle 2. In that cycle, the price bottomed, consolidated for a while, and then ripped higher. The same could happen here. But the chart also shows that timing varies. In Cycle 1, the bottom to peak took years. In Cycle 2, it was faster.
The DOGE price could continue consolidating near these levels. It could drift lower toward $0.05 or $0.03. Or it could start the next leg up. The macro chart doesn’t give exact timing. It gives a structure. It shows where we are in the cycle and where we’ve been.
For anyone holding DOGE, the macro picture is worth watching. The cycles have repeated twice. The third cycle is following a similar shape. The DOGE price is in the consolidation phase, the same phase that preceded the last two big runs.
No guarantees. But the roadmap is there. And if history is any guide, the next move could be the one everyone’s been waiting for. Not a prediction. Just a pattern. And patterns matter.
Disclaimer: The information on this page may come from third parties and does not represent the views or opinions of Gate. The content displayed on this page is for reference only and does not constitute any financial, investment, or legal advice. Gate does not guarantee the accuracy or completeness of the information and shall not be liable for any losses arising from the use of this information. Virtual asset investments carry high risks and are subject to significant price volatility. You may lose all of your invested principal. Please fully understand the relevant risks and make prudent decisions based on your own financial situation and risk tolerance. For details, please refer to
Disclaimer.
