The price of Cardano (ADA) has corrected about 7% from its recent peak, falling back to $0.258 and losing the 20-day exponential moving average (EMA 20)—a notable weakening signal as there has been no significant buying response.
History shows that the last time ADA broke through the EMA 20 on February 27, it led to a 13% correction. Currently, the head and shoulders structure formed since February is approaching completion, with the neckline lying about 9% lower than the current price. If this level is breached with a daily close, the pattern will trigger a target price decrease of about 20%.
Breaking the EMA reinforces the risk of completing the head and shoulders pattern
On the daily chart, ADA has broken through several support zones, with the loss of the EMA 20 at $0.266 being the most significant technical signal. This is a trend indicator sensitive to recent price fluctuations, so being breached often implies a short-term reversal.
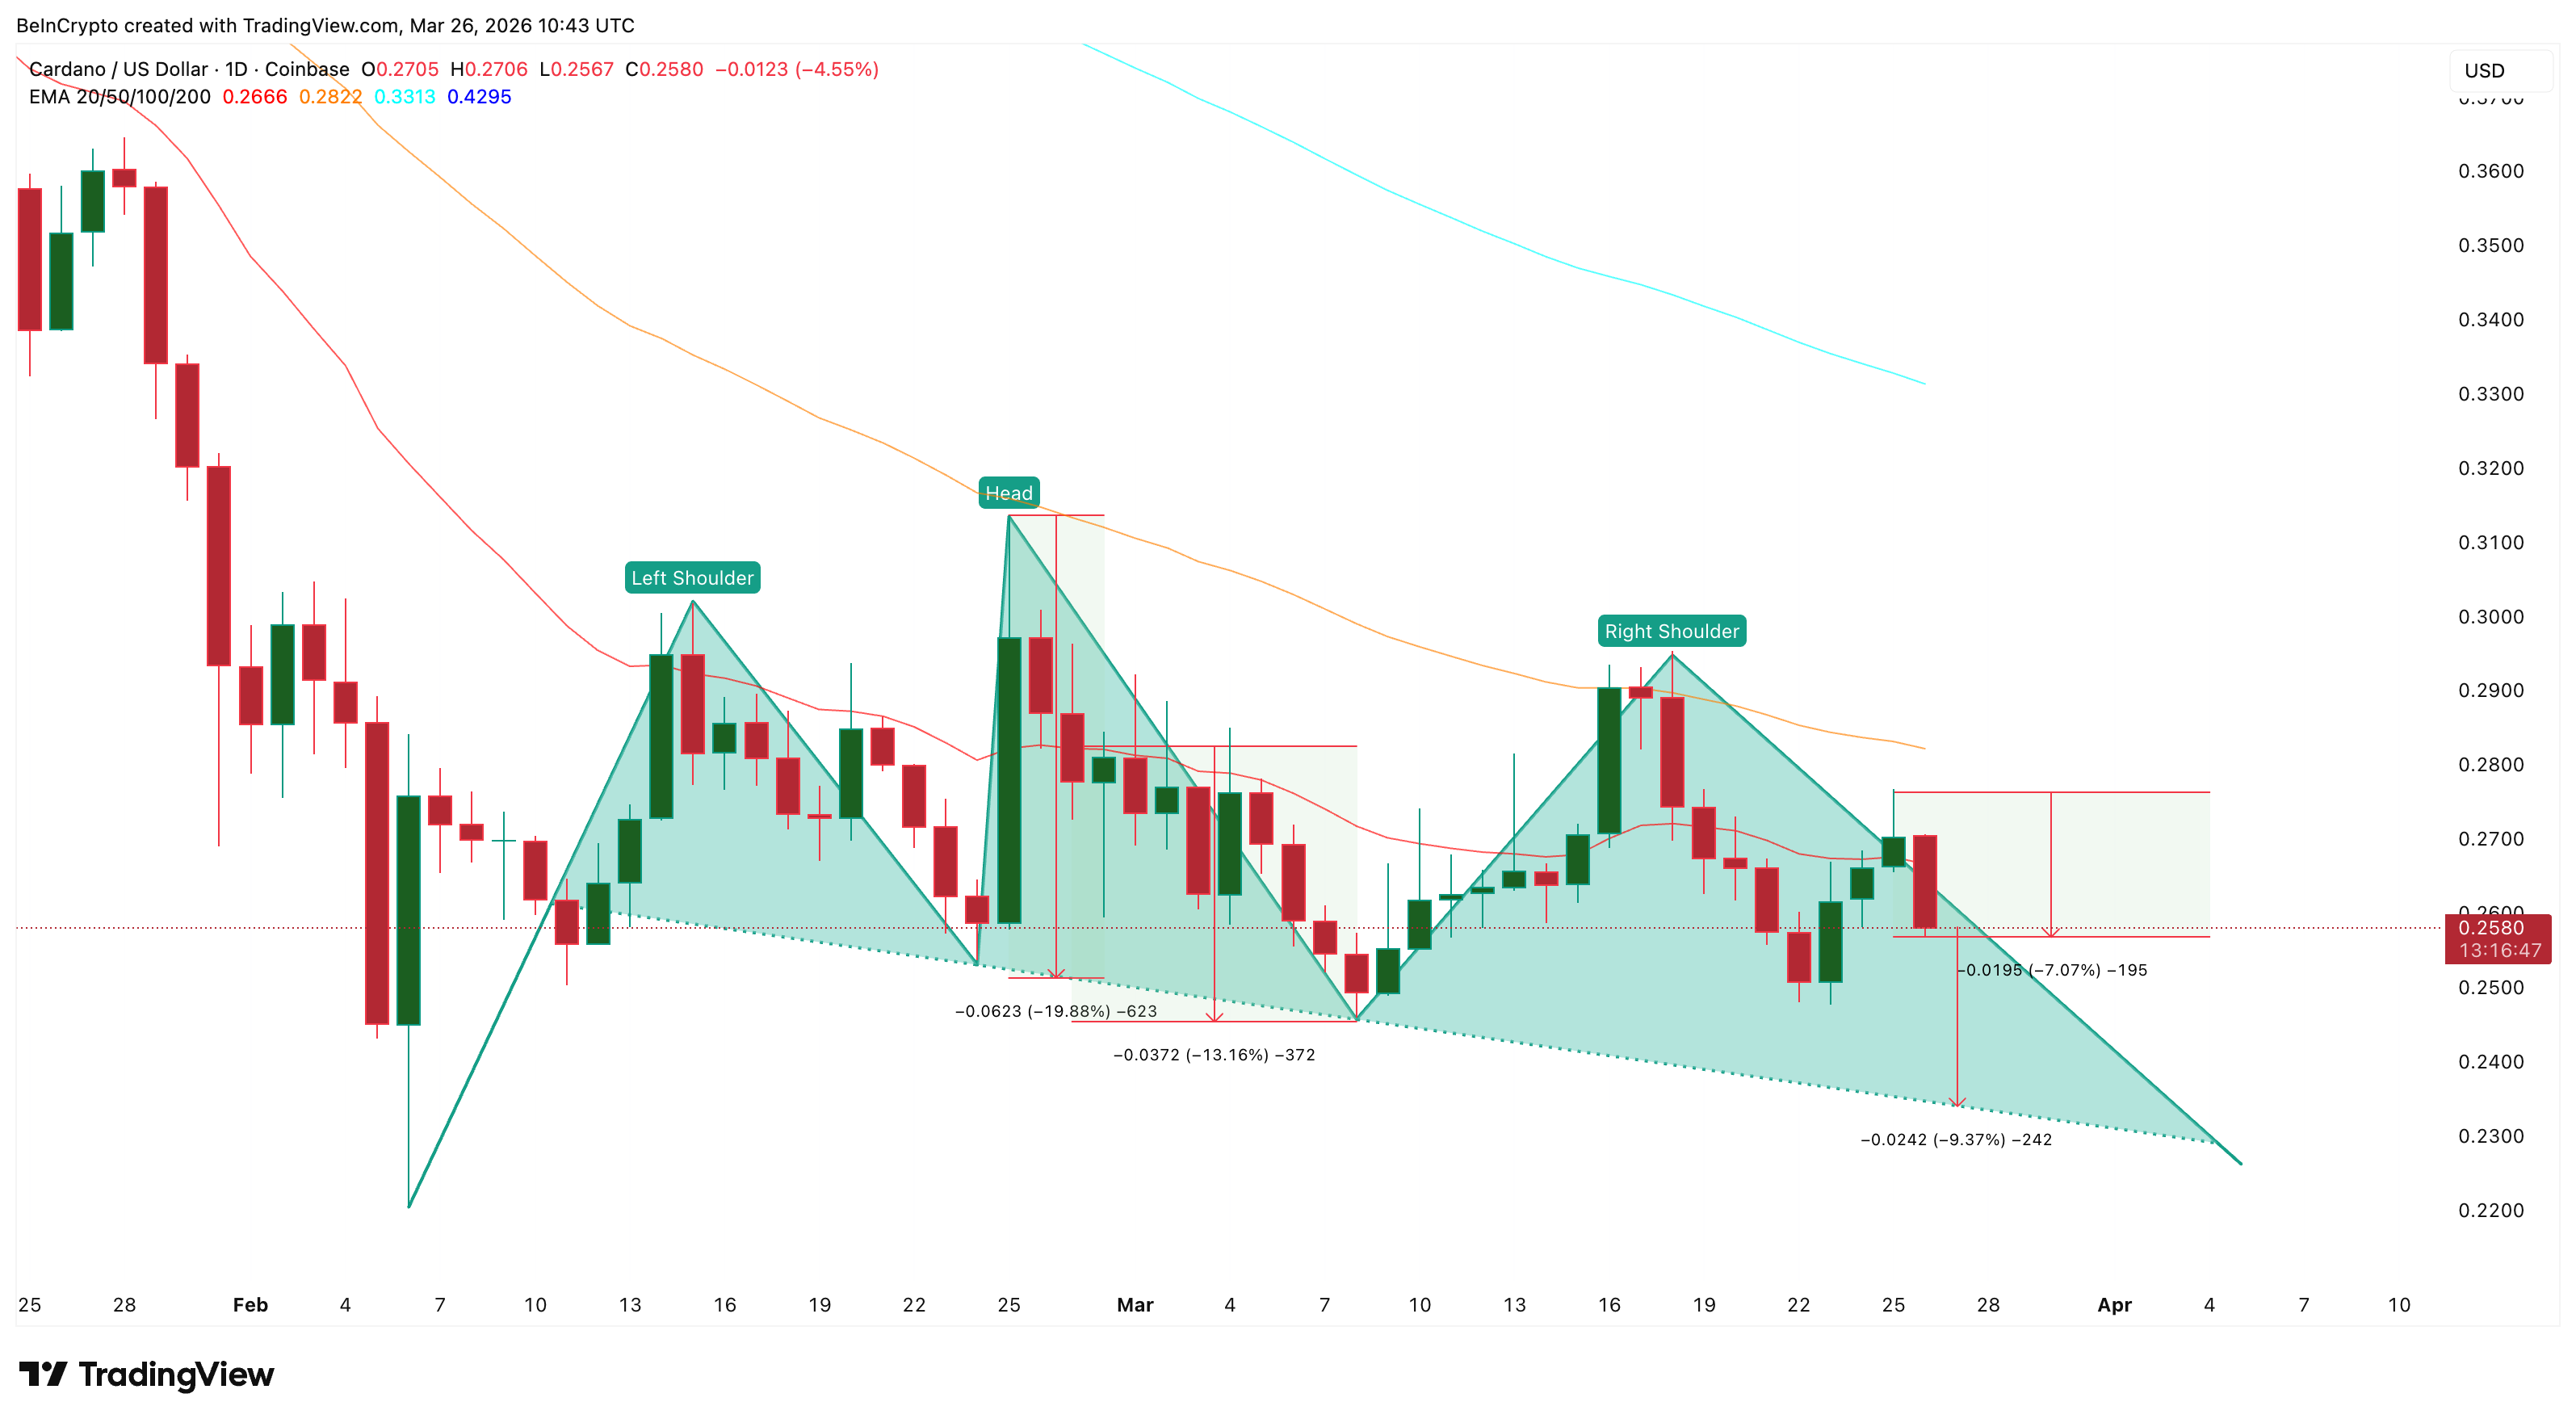 EMA and head and shoulders pattern | Source: TradingViewThe current decline from the right shoulder peak still has about 9% room before reaching the neckline. Once this level is broken, the head and shoulders pattern will complete with a target measuring towards a deeper decline, reflecting increasing selling pressure.
However, some money flow indicators suggest that the market has not completely lost balance.
Buying pressure increases but lacks confirmation from large money flow
The Money Flow Index (MFI)—which measures money flow based on price and volume—currently stands at 60.72. During the period from February 25 to March 25, MFI has been trending upward while the price has consistently made lower highs, forming a bullish divergence. This indicates that bottom-fishing buying pressure is quietly absorbing selling pressure.
In contrast, the Chaikin Money Flow (CMF)—representing institutional money flow—remains at -0.05, below the neutral threshold. Over the same period, CMF has declined from a positive to a negative range, reflecting that large capital has not yet participated in supporting the market.
The only positive signal is that CMF has begun to recover since March 22. If this indicator crosses back above the 0 level while MFI maintains an upward trend, the market will achieve consensus between retail investors and large money flow—an important factor for a reversal.
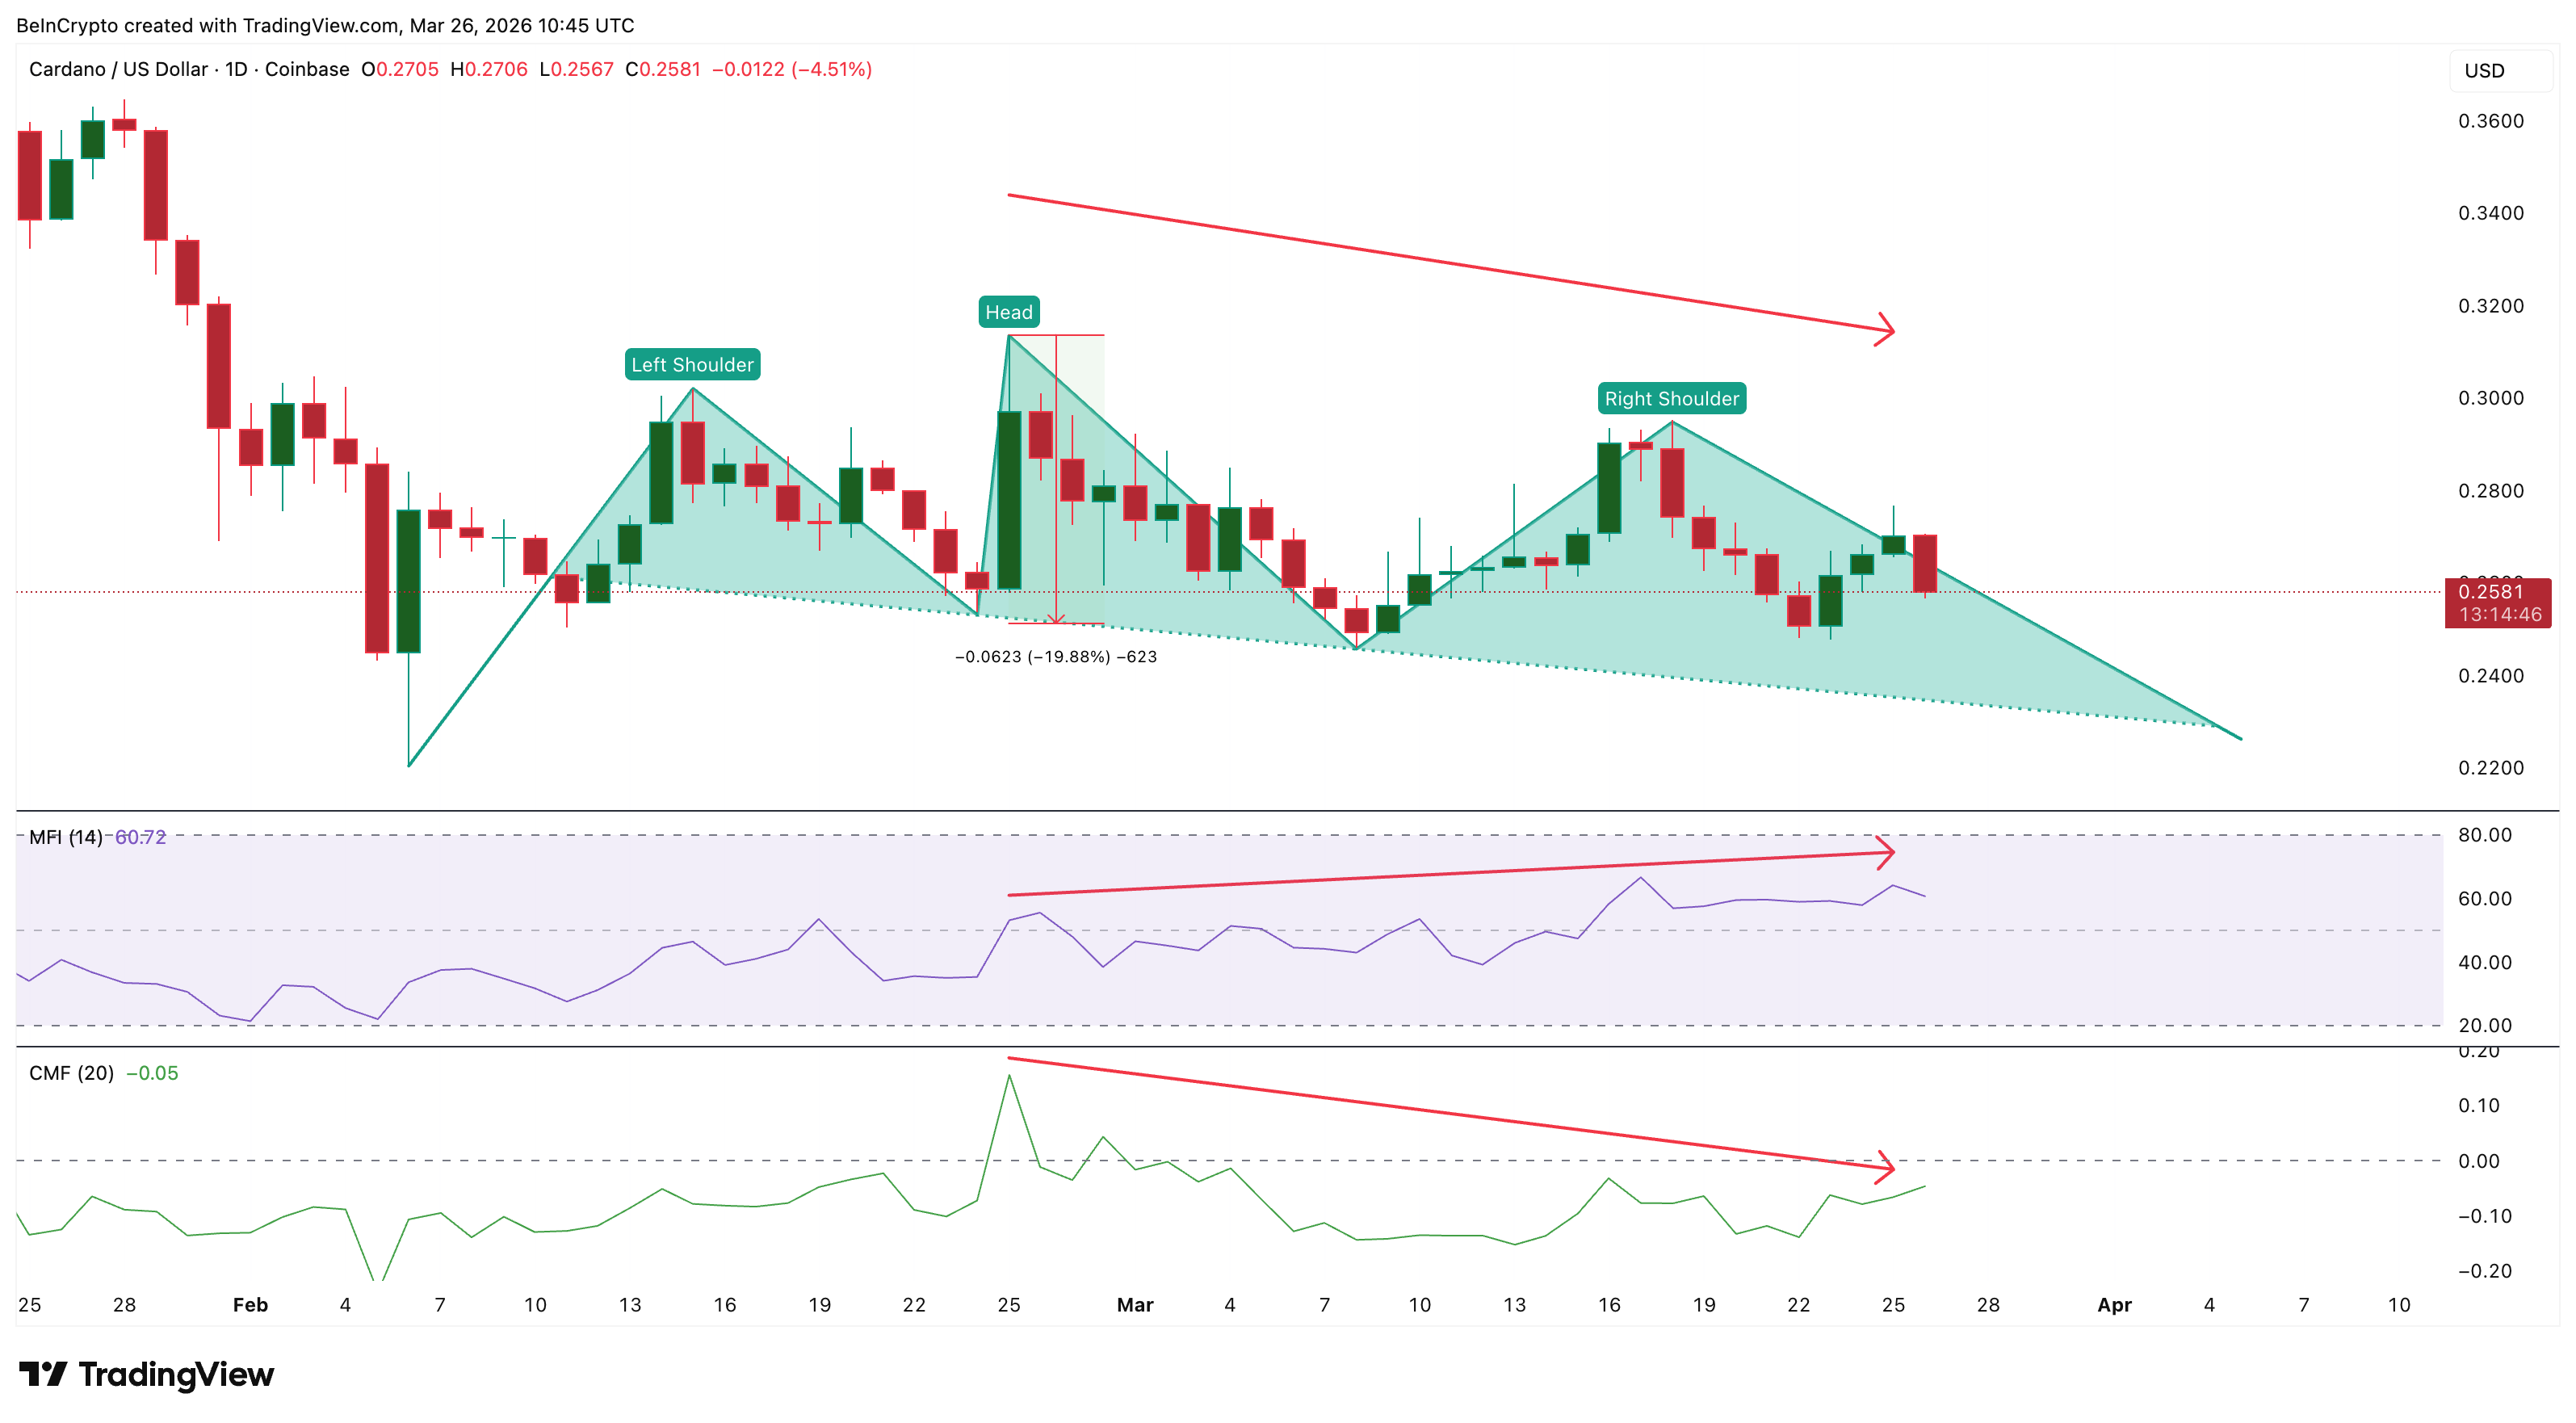
In the current context, without confirmation from CMF, individual bottom-fishing buying pressure may not be sufficient to prevent a breakout scenario.
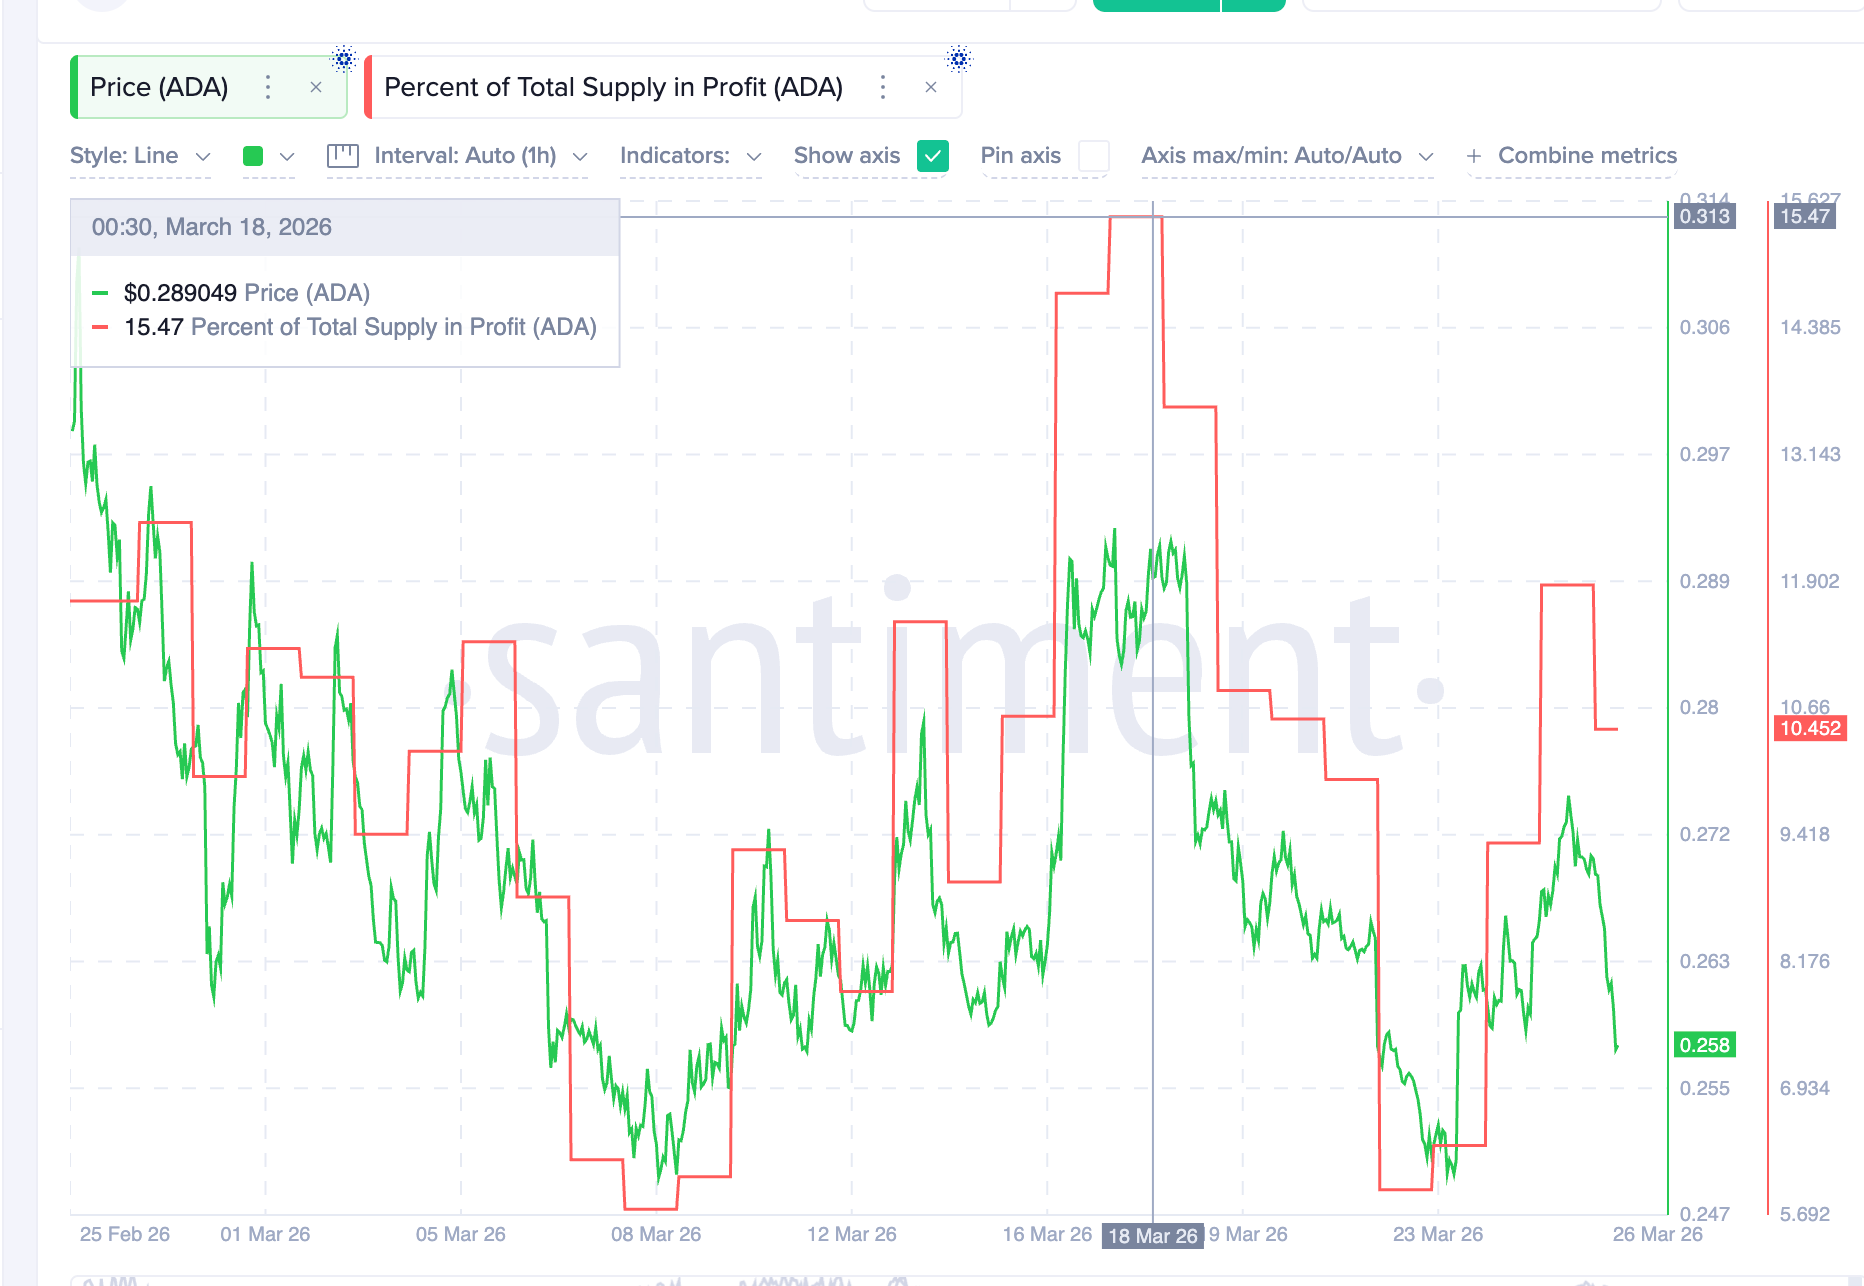
Profit-taking pressure remains, ADA needs to regain important levels
On-chain data from Santiment shows that the percentage of ADA supply in profit has decreased from 15.47% to around 10.45%. However, this figure is still significantly higher than the recent profit bottom (around 5.7%–5.9%), implying that selling pressure still has room to grow.
Notably, many investors who participated in recent corrections are still holding unrealized profits. If the price continues to weaken towards the neckline, these profits could be erased, triggering breakeven selling and increasing downward pressure.
 Supply for profit | Source: SantimentTo improve the technical structure, ADA needs to quickly regain the $0.269 level (Fibonacci 0.382). A breakout above $0.295 will invalidate the right shoulder pattern and re-establish an upward trend. However, this scenario currently lacks foundation as large money flow has not returned.
Conversely, the $0.253 level plays a crucial support role. A daily close below this level could open up a decline to $0.241, and further down to $0.227—the confirmation threshold for breaking the neckline. In a more negative scenario, if institutional capital continues to withdraw, a deeper target around $0.185 could very well be tested.
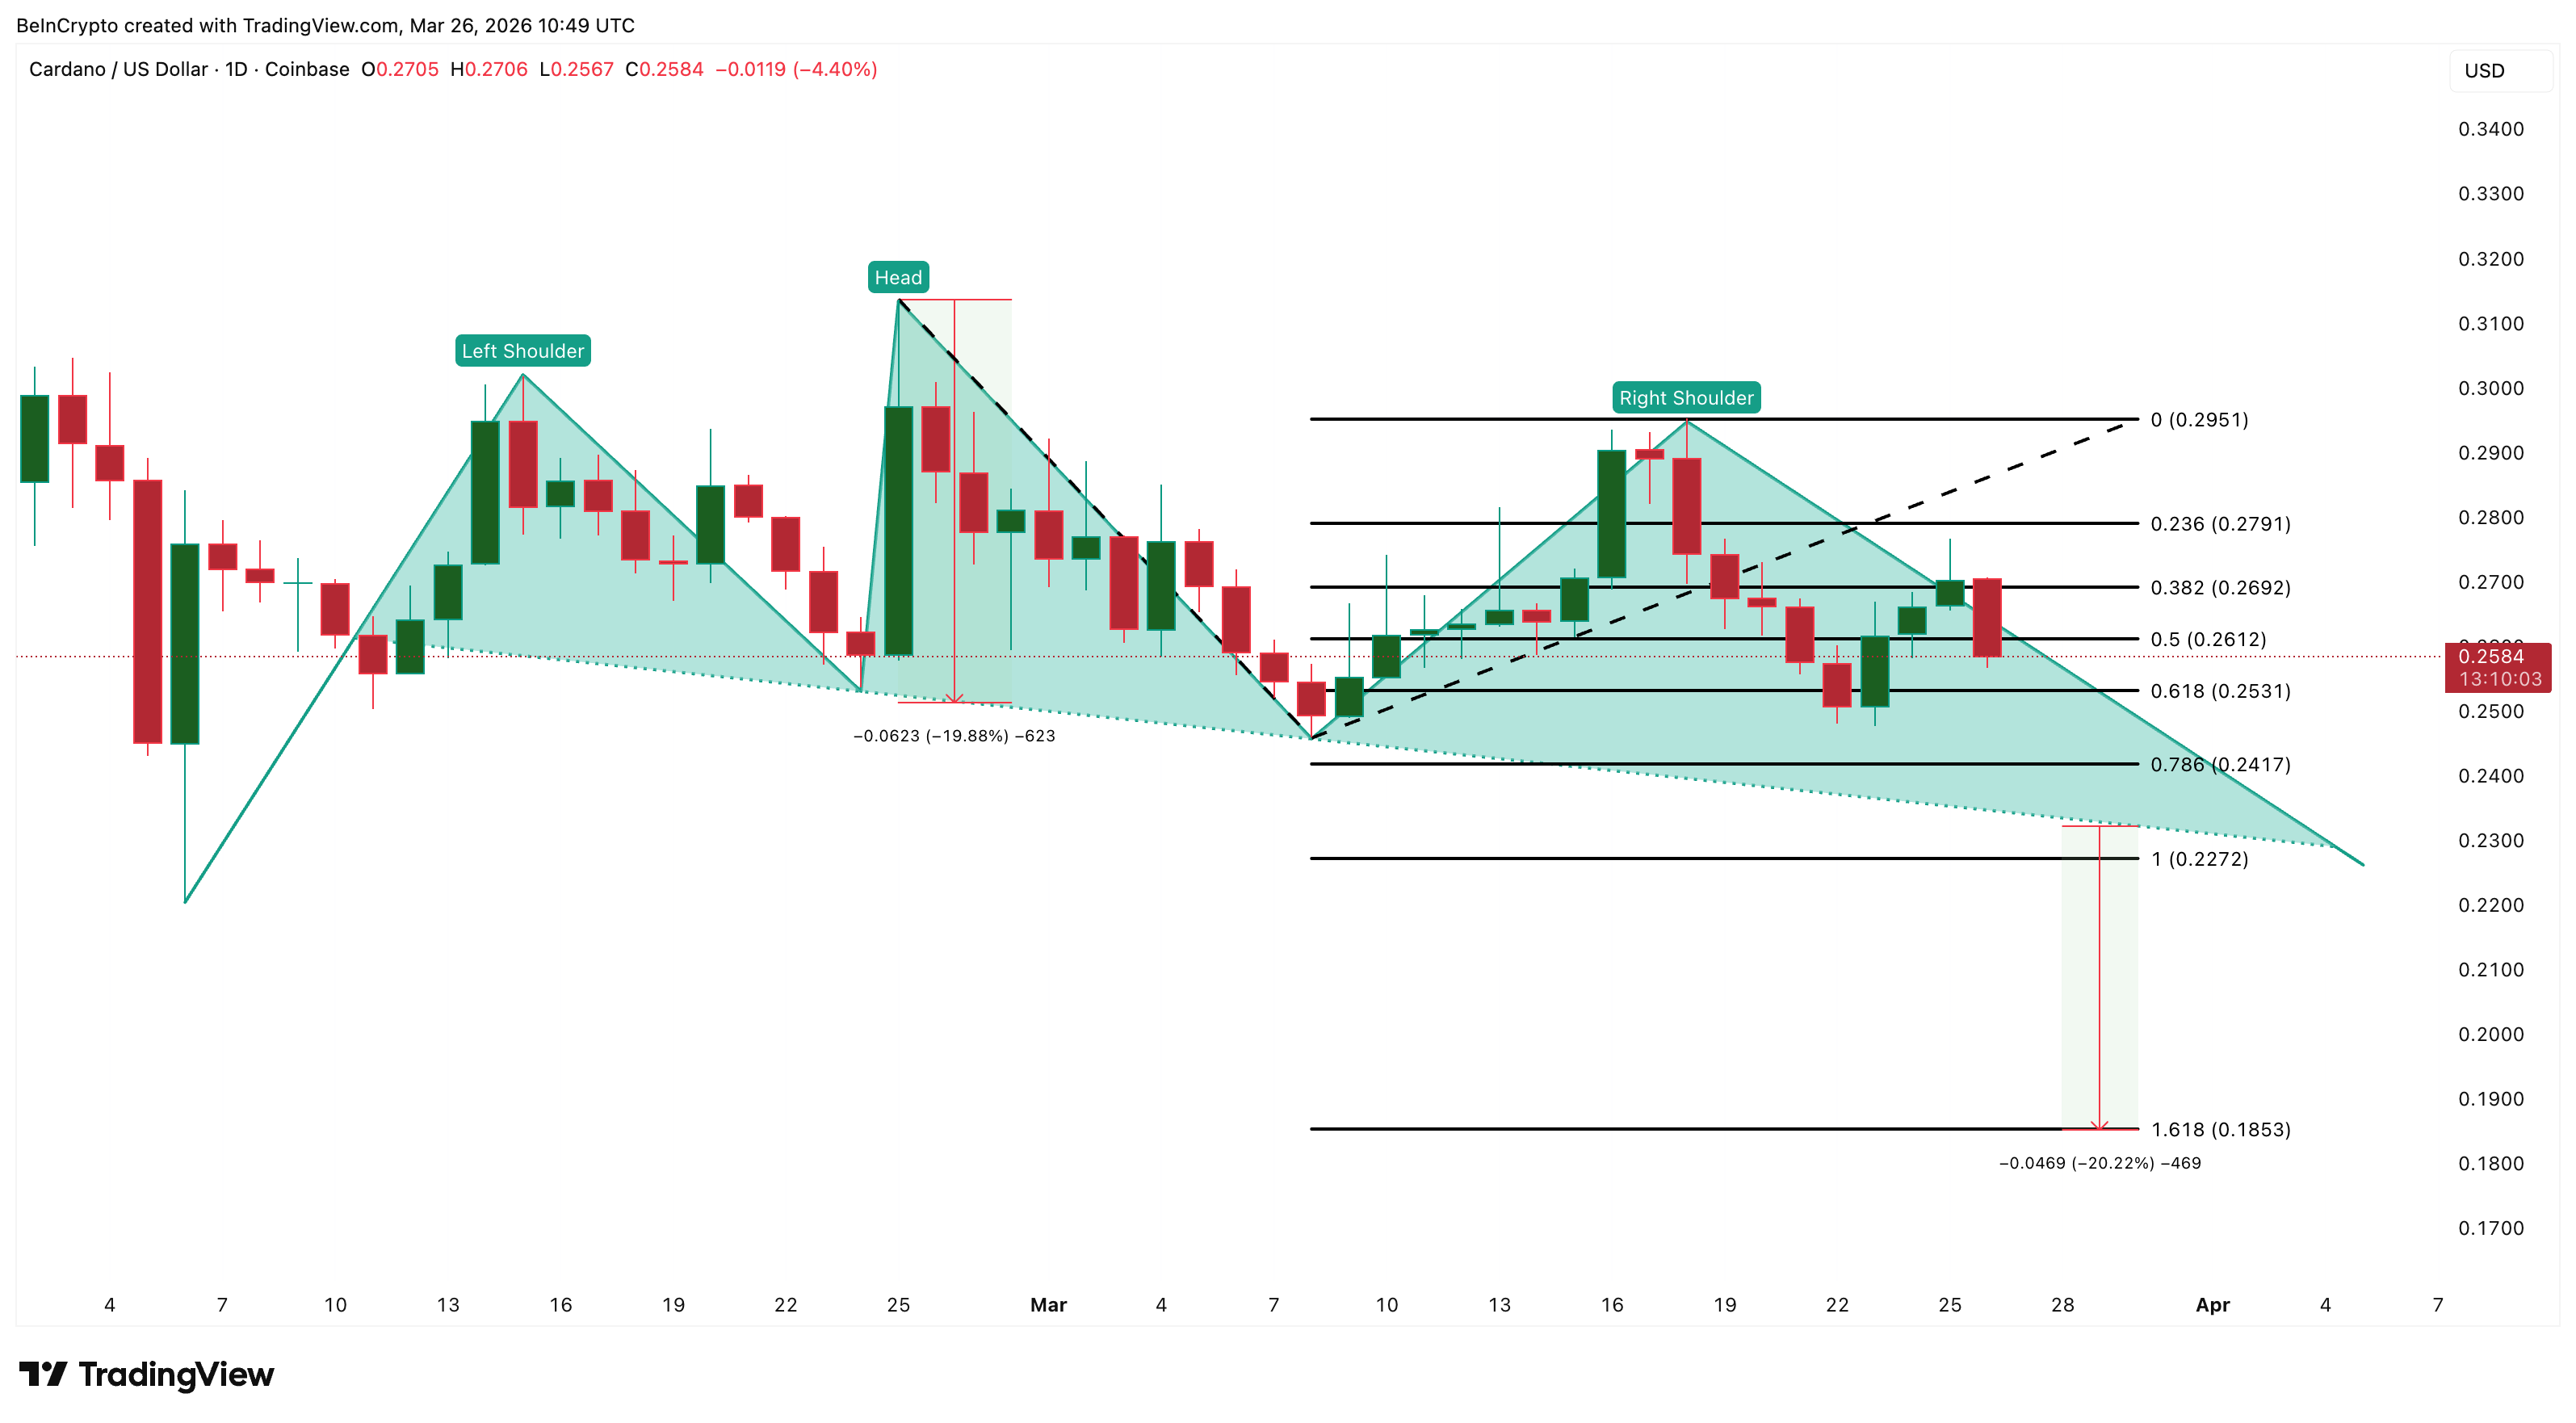 Cardano price analysis | Source: TradingViewIn summary, ADA stands at a decisive point: holding above $0.269 to delay a deeper decline scenario or losing $0.253 and triggering a significant correction according to the head and shoulders pattern.
Mr. Giáo
Disclaimer: The information on this page may come from third parties and does not represent the views or opinions of Gate. The content displayed on this page is for reference only and does not constitute any financial, investment, or legal advice. Gate does not guarantee the accuracy or completeness of the information and shall not be liable for any losses arising from the use of this information. Virtual asset investments carry high risks and are subject to significant price volatility. You may lose all of your invested principal. Please fully understand the relevant risks and make prudent decisions based on your own financial situation and risk tolerance. For details, please refer to
Disclaimer.
