Pi Network (PI) is currently trading around $0.1883, maintaining a consolidation near the 23.6% Fibonacci retracement level after failing to sustain an upward momentum above $0.29. Two technical signals converging indicate that the “quiet” phase has ended — but in a bearish direction for the bulls.
Realized volatility has reactivated after a seven-month compression cycle, while the correlation between PI and Bitcoin has turned negative. This combination shapes a short-term bearish structure, with key technical levels to watch.
Seven-Month Quiet Period and Volatility Breakout Signals
Data shows that in August 2025, Pi Coin’s volatility exceeded 150%, before steadily declining along with the price, reaching a low of around 52% in early February. This prolonged compression phase reflects weakening momentum rather than sustainable stability.
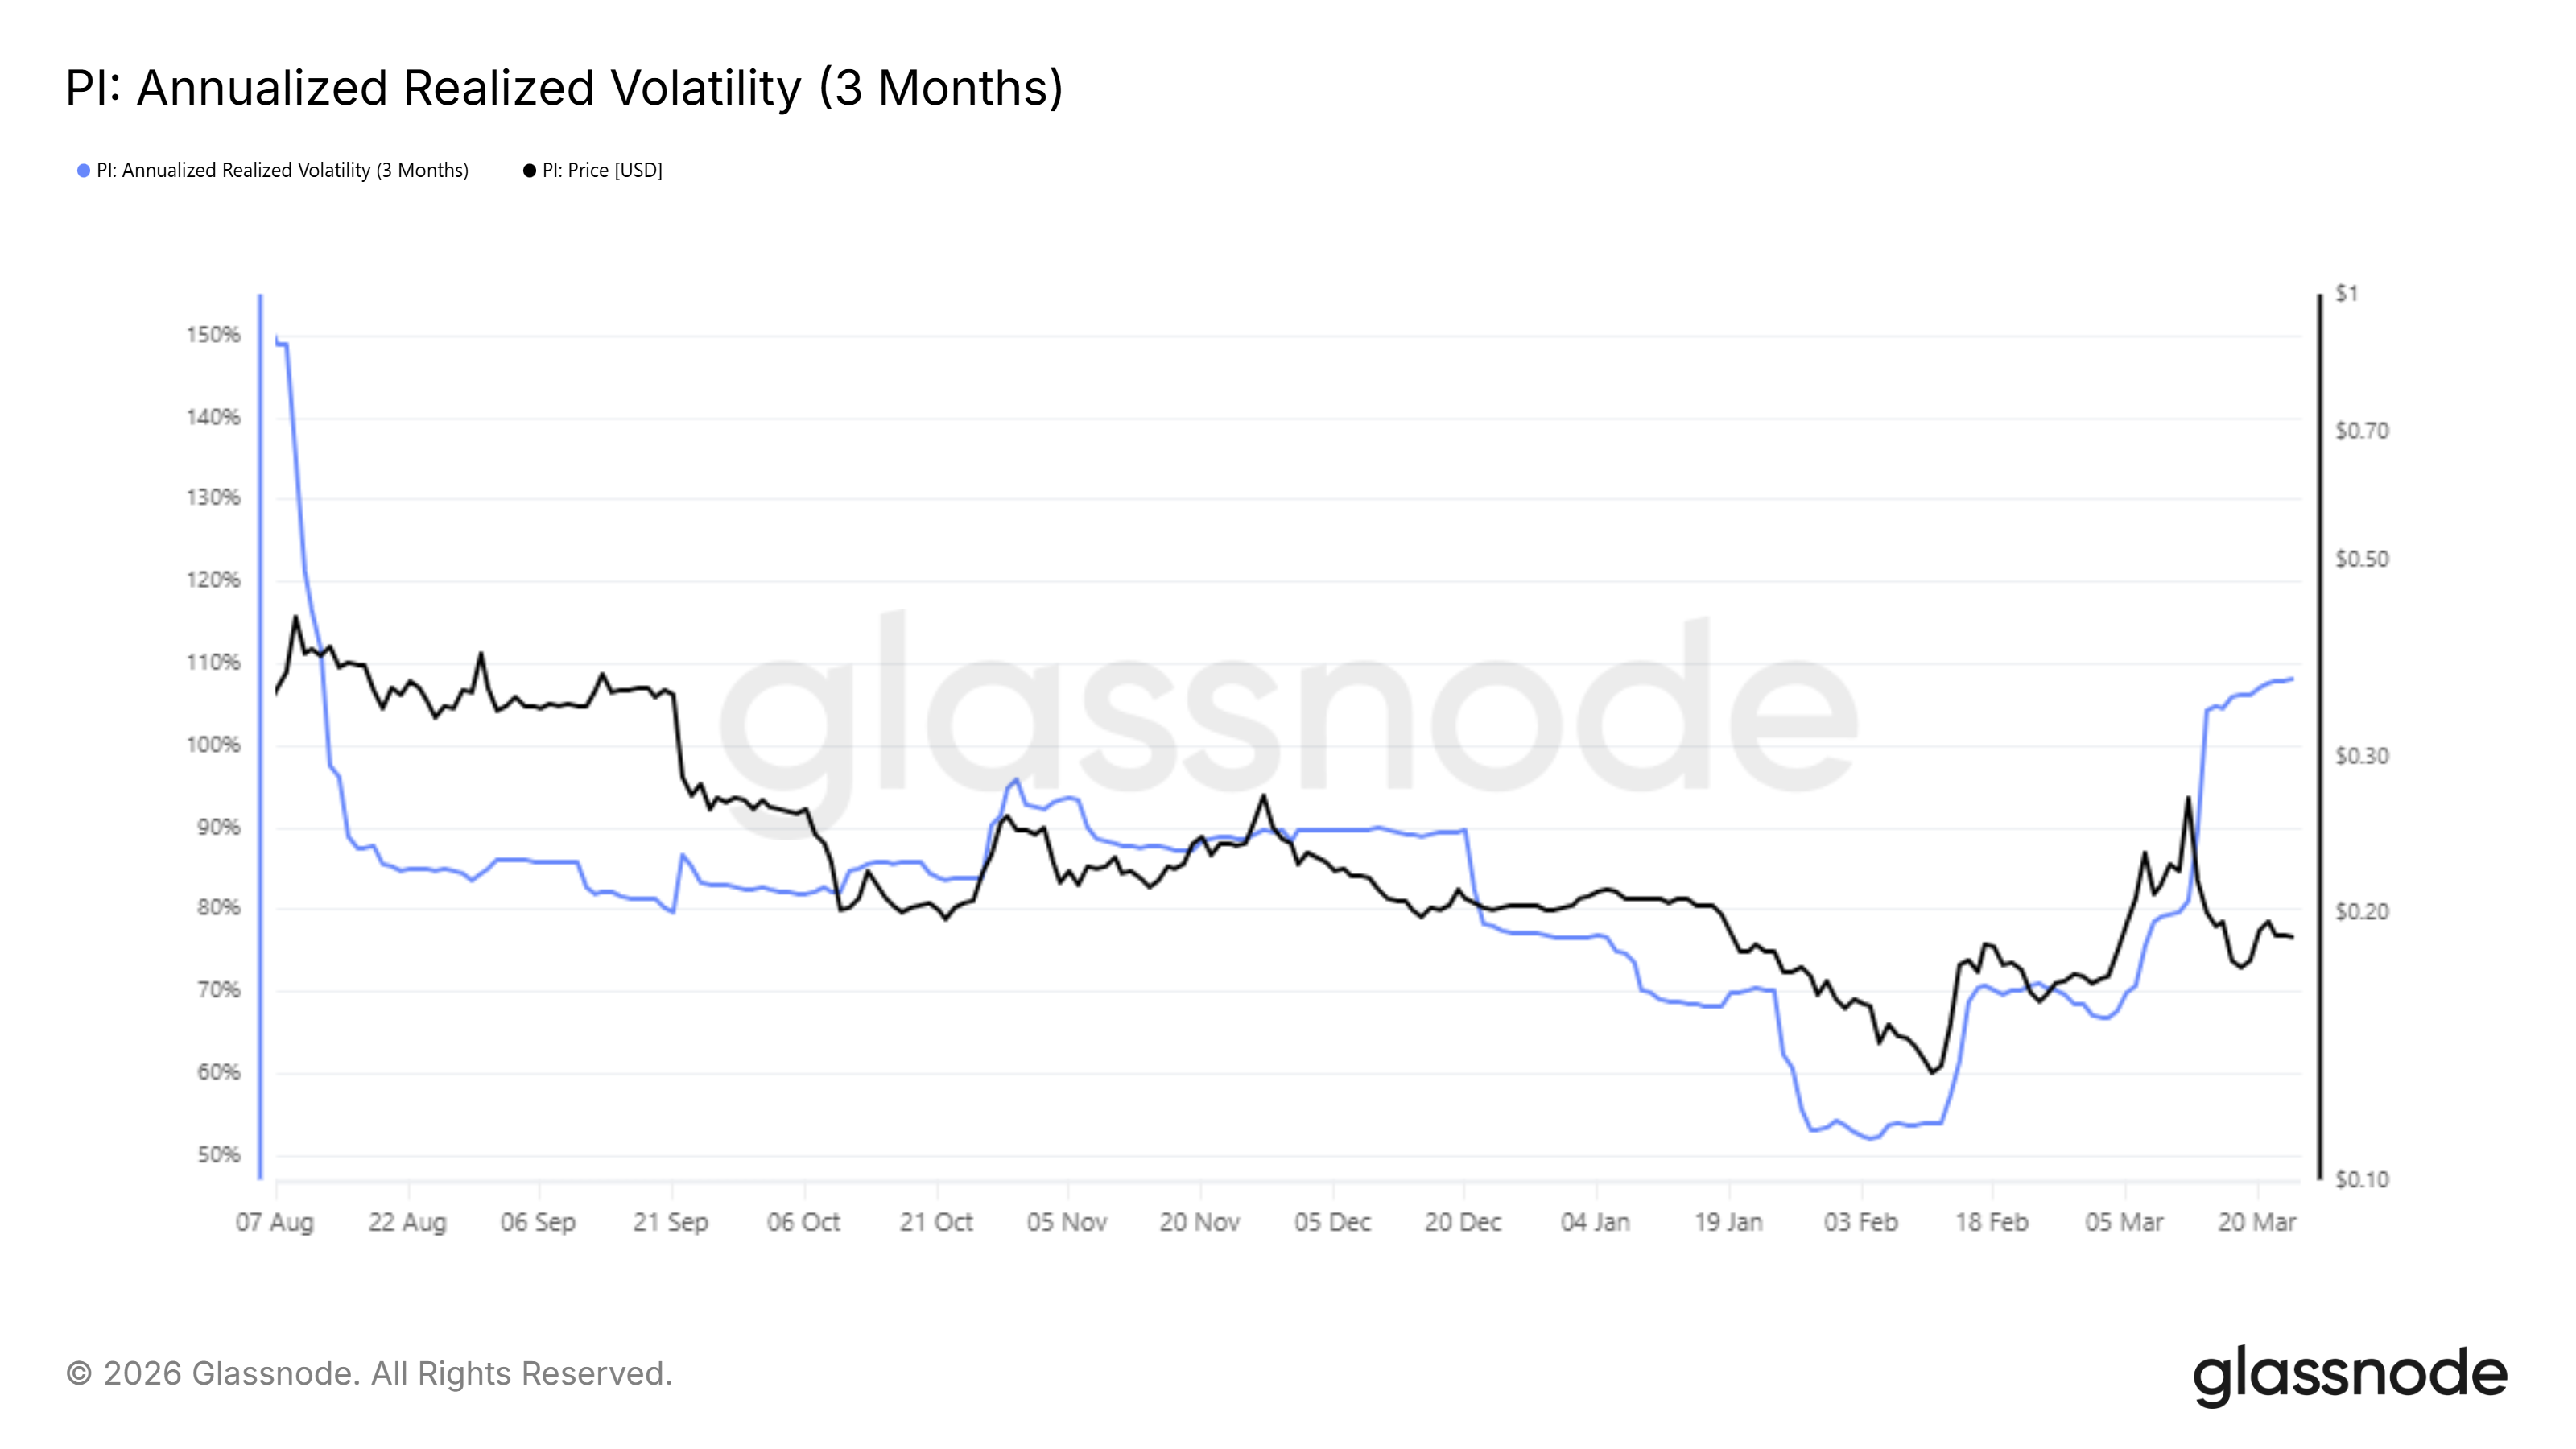 Annual Realized Volatility of Pi Coin | Source: GlassnodeMoving into March, a clear trend reversal occurred. The price rebounded to $0.29, and volatility returned above 100%, reaching approximately 108%. Historically, extended volatility expansions following long compression periods often precede strong directional moves.
Negative Correlation with Bitcoin Weakens Recovery Momentum
For most of February, the correlation coefficient between PI and Bitcoin remained near 1.0, indicating strong synchronization. However, this index has now fallen to -0.30, reflecting an increasingly inverse relationship.
This is significant: even if Bitcoin leads the market upward, PI can still move counter to the overall trend. Losing support from the leading asset has considerably weakened the typical recovery catalysts seen in altcoins.
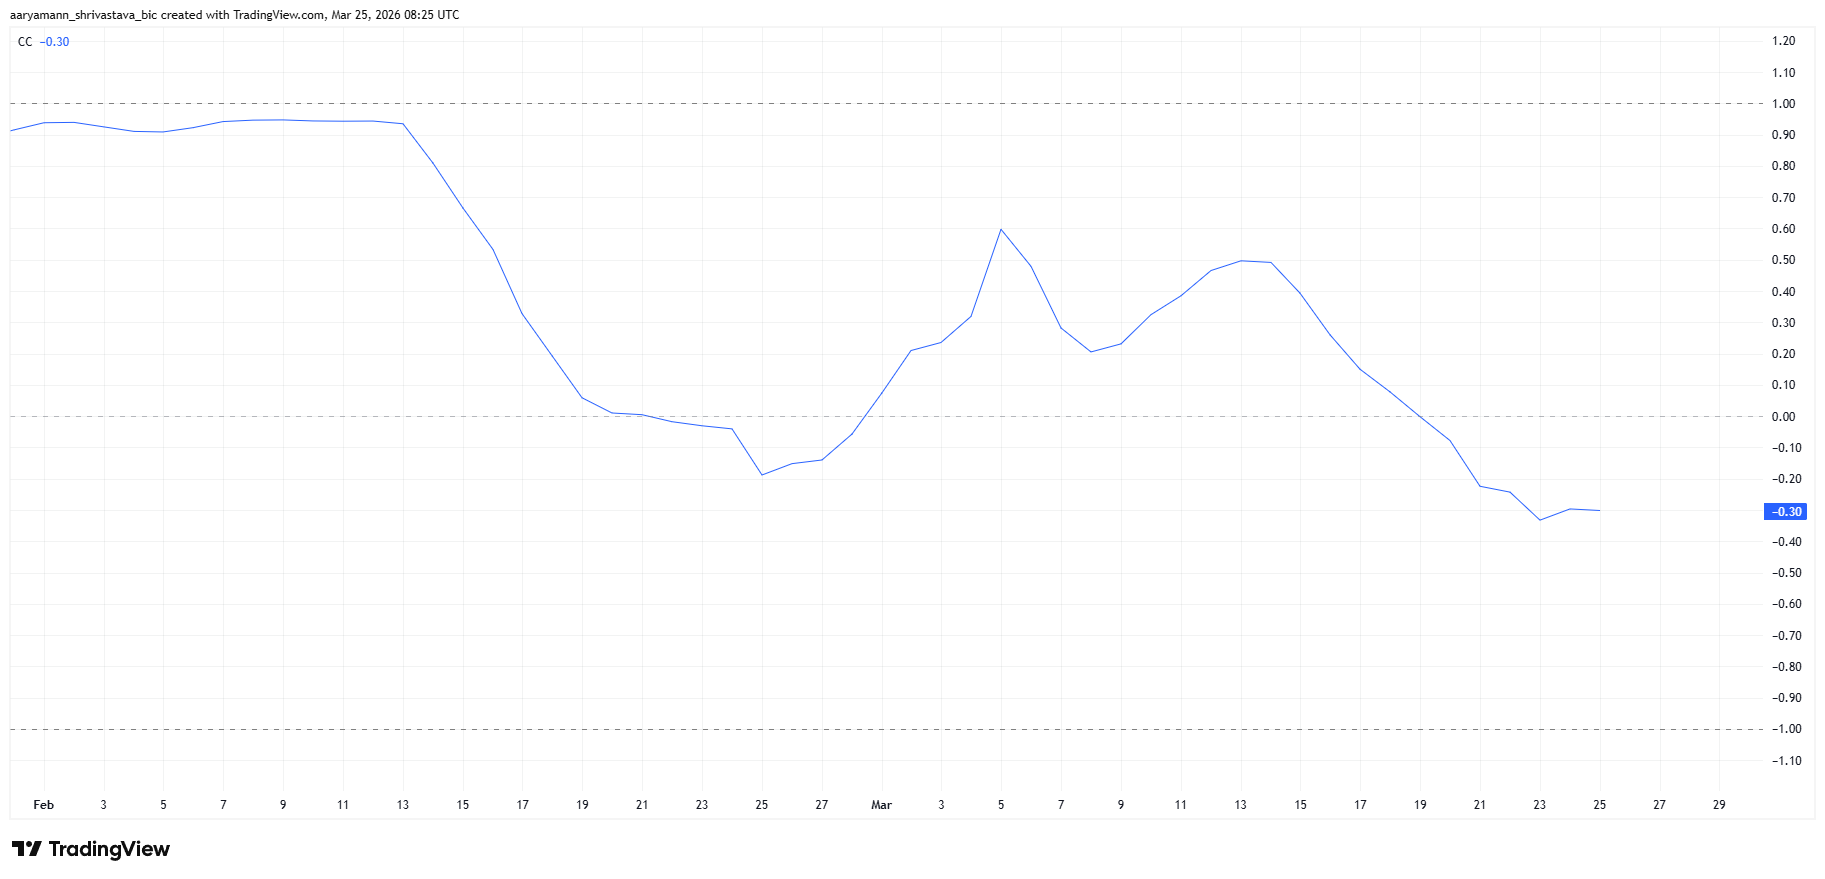 Pi Coin and Bitcoin Correlation | Source: TradingViewTo reverse this situation, PI needs to restore a positive correlation, ideally above 0.50, to re-establish its link with Bitcoin’s upward momentum.
Downside Break Risks Still Predominant
On the daily chart, PI’s price is below the 23.6% Fibonacci level at $0.1894. The Fibonacci range is drawn from the February low of $0.1555 to the March 13 high of $0.2990. Notably, the 20-day EMA at $0.1930 is trending downward, acting as a short-term resistance.
The current price structure also shows a double top pattern, with a potential downside target of about 33%, heading toward the historical low of $0.1300. Even without forming a new low, downward pressure remains.
The neckline of the pattern is around $0.1555, with a measured target near $0.1527 — aligning with the Fibonacci support zone. When the price is simultaneously held below both the Fibonacci 23.6% level and the declining EMA, the bearish scenario continues to be favored.
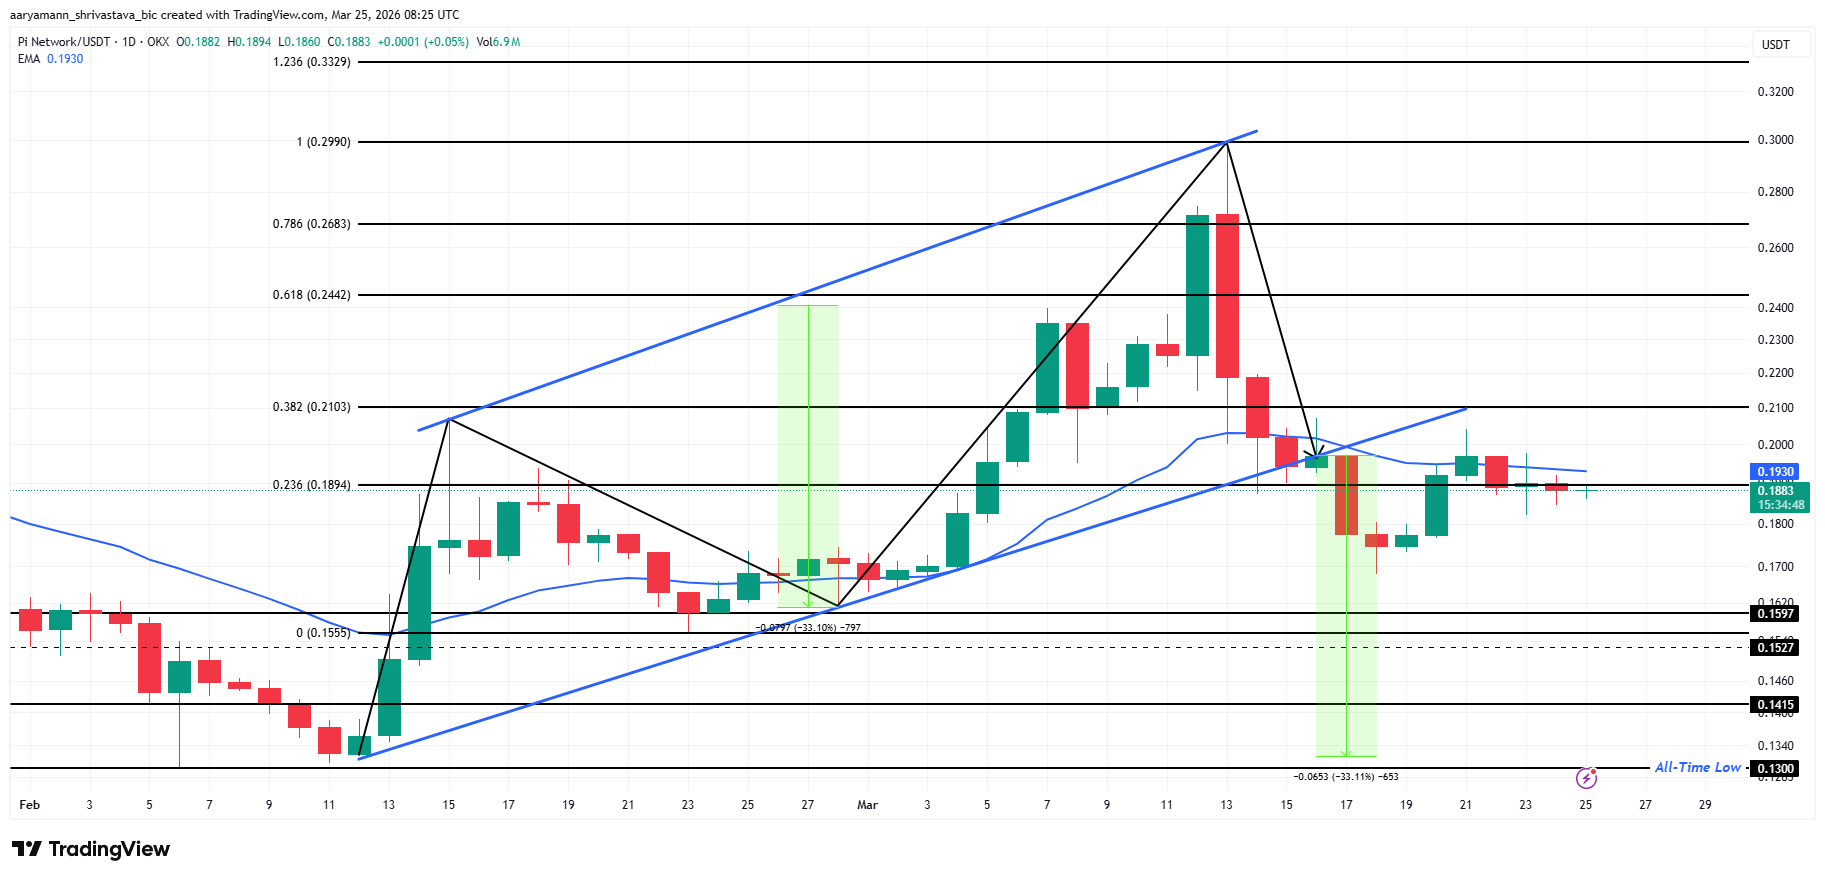 Pi Coin Price Analysis | Source: TradingViewIf the daily close is below $0.1894, it would confirm the failed recovery, opening room for a decline toward $0.1597, then $0.1527. Below that, the $0.1300 zone acts as the final support.
Conversely, the bearish scenario will be invalidated if PI closes above the 38.2% Fibonacci level at $0.2103. In that case, the next resistance zone is around $0.2442. A breakout accompanied by a return to positive correlation with Bitcoin could shift the market structure from negative to neutral.
Disclaimer: The information on this page may come from third parties and does not represent the views or opinions of Gate. The content displayed on this page is for reference only and does not constitute any financial, investment, or legal advice. Gate does not guarantee the accuracy or completeness of the information and shall not be liable for any losses arising from the use of this information. Virtual asset investments carry high risks and are subject to significant price volatility. You may lose all of your invested principal. Please fully understand the relevant risks and make prudent decisions based on your own financial situation and risk tolerance. For details, please refer to
Disclaimer.
