Pump.fun (PUMP) is currently trading around $0.0019, attempting to recover after a sharp 18% decline that brought the price to a low of $0.0016. However, on-chain signals and weakening momentum indicators suggest that the journey back to the $0.0020 zone still faces many obstacles.
The recovery momentum now heavily depends on the behavior of a specific group of holders — but current signals only maintain expectations and are not enough to confirm a trend reversal.
Long-term PUMP Holders Still Selling
Data from Glassnode shows that from February 18, 2026, to March 25, 2026, the net position change of HODLers has remained negative, with no signs of accumulation. The outflow volume ranged from -2 billion PUMP to -14 billion PUMP daily, with major sell-offs concentrated at the end of February and mid-March.
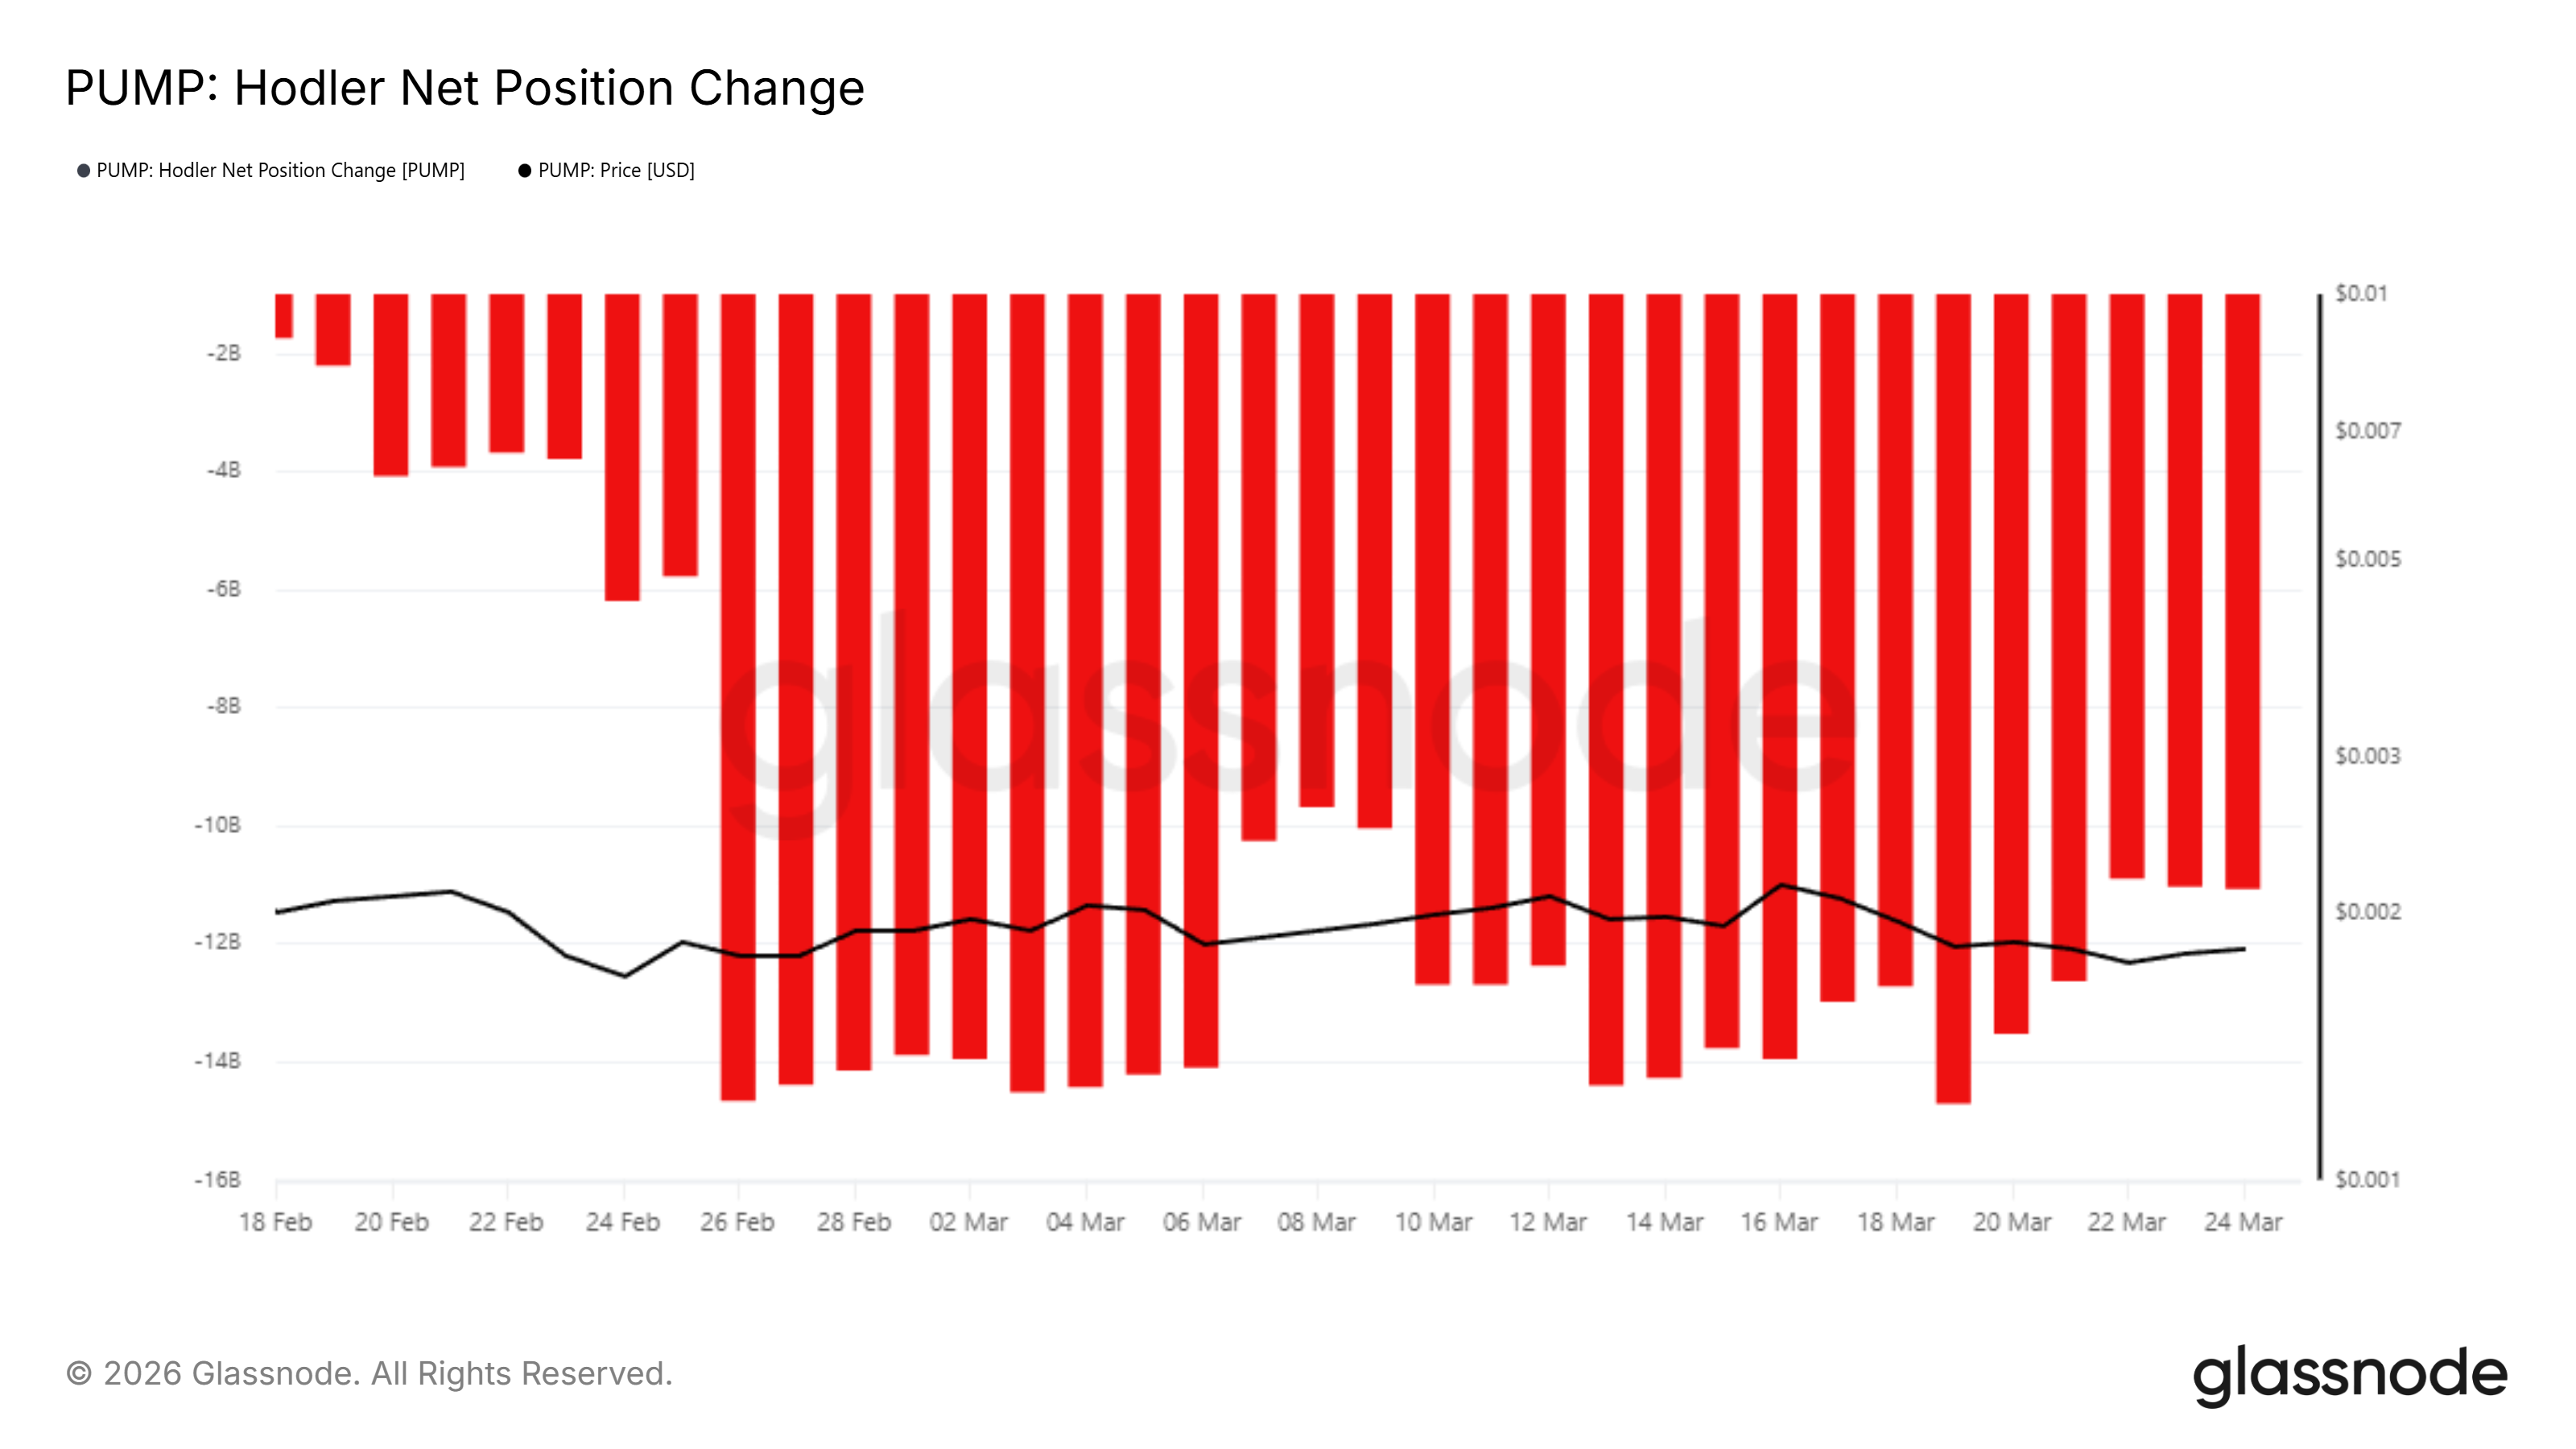 Change in PUMP holder net position | Source: TradingView Notably, despite increasing selling pressure, the price has mostly been “pinned” around the $0.0020 level, implying that supply is absorbing nearly all market demand. In this context, the behavior of long-term holders — a group that typically reflects core confidence — indicates they do not see the current price level as attractive for accumulation.
Buying and Selling Pressure of PUMP
The Money Flow Index (MFI) further supports a cautious outlook. After reaching an oversold zone near 10 on February 11, the MFI rebounded strongly and repeatedly exceeded 75 in early March, aligning with short-term price increases.
However, by March 25, the MFI dropped to 49.93 — a neutral zone. More importantly, this indicator is showing a clear downward trend from March’s peak without significant rebounds.
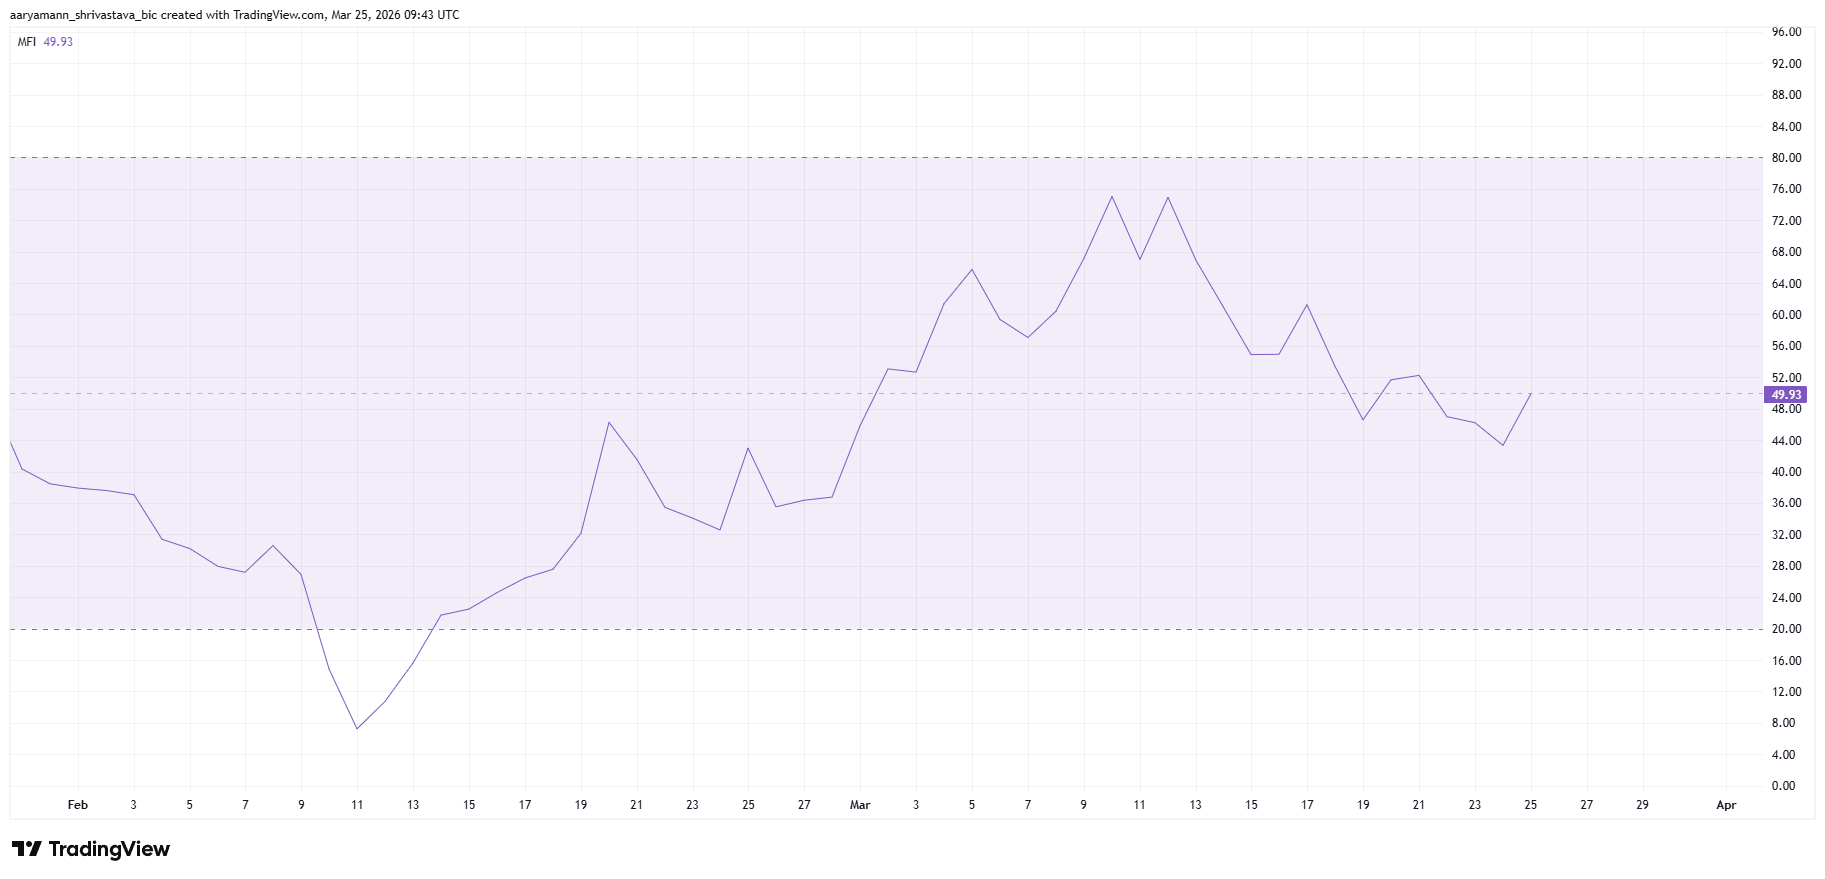 PUMP’s MFI | Source: TradingView The combination of a neutral MFI and continuous selling from long-term holders suggests that buying pressure exists but is not strong enough to dominate. The market is in a fragile balance, lacking catalysts for a breakout.
Slowdown in New PUMP Addresses Growth — A Key Variable
One of the few positive factors is the growth in new addresses. Data shows that the number of PUMP-holding addresses (non-zero balance) steadily increased from late February to March 20, rising from about 117,000 to 118,200 addresses.
However, this growth momentum is waning. The pace of new address creation peaked between March 11–17, then declined sharply toward the end of the observation period. Meanwhile, the overall trend line of total addresses is beginning to curve downward, indicating signs of stagnation.
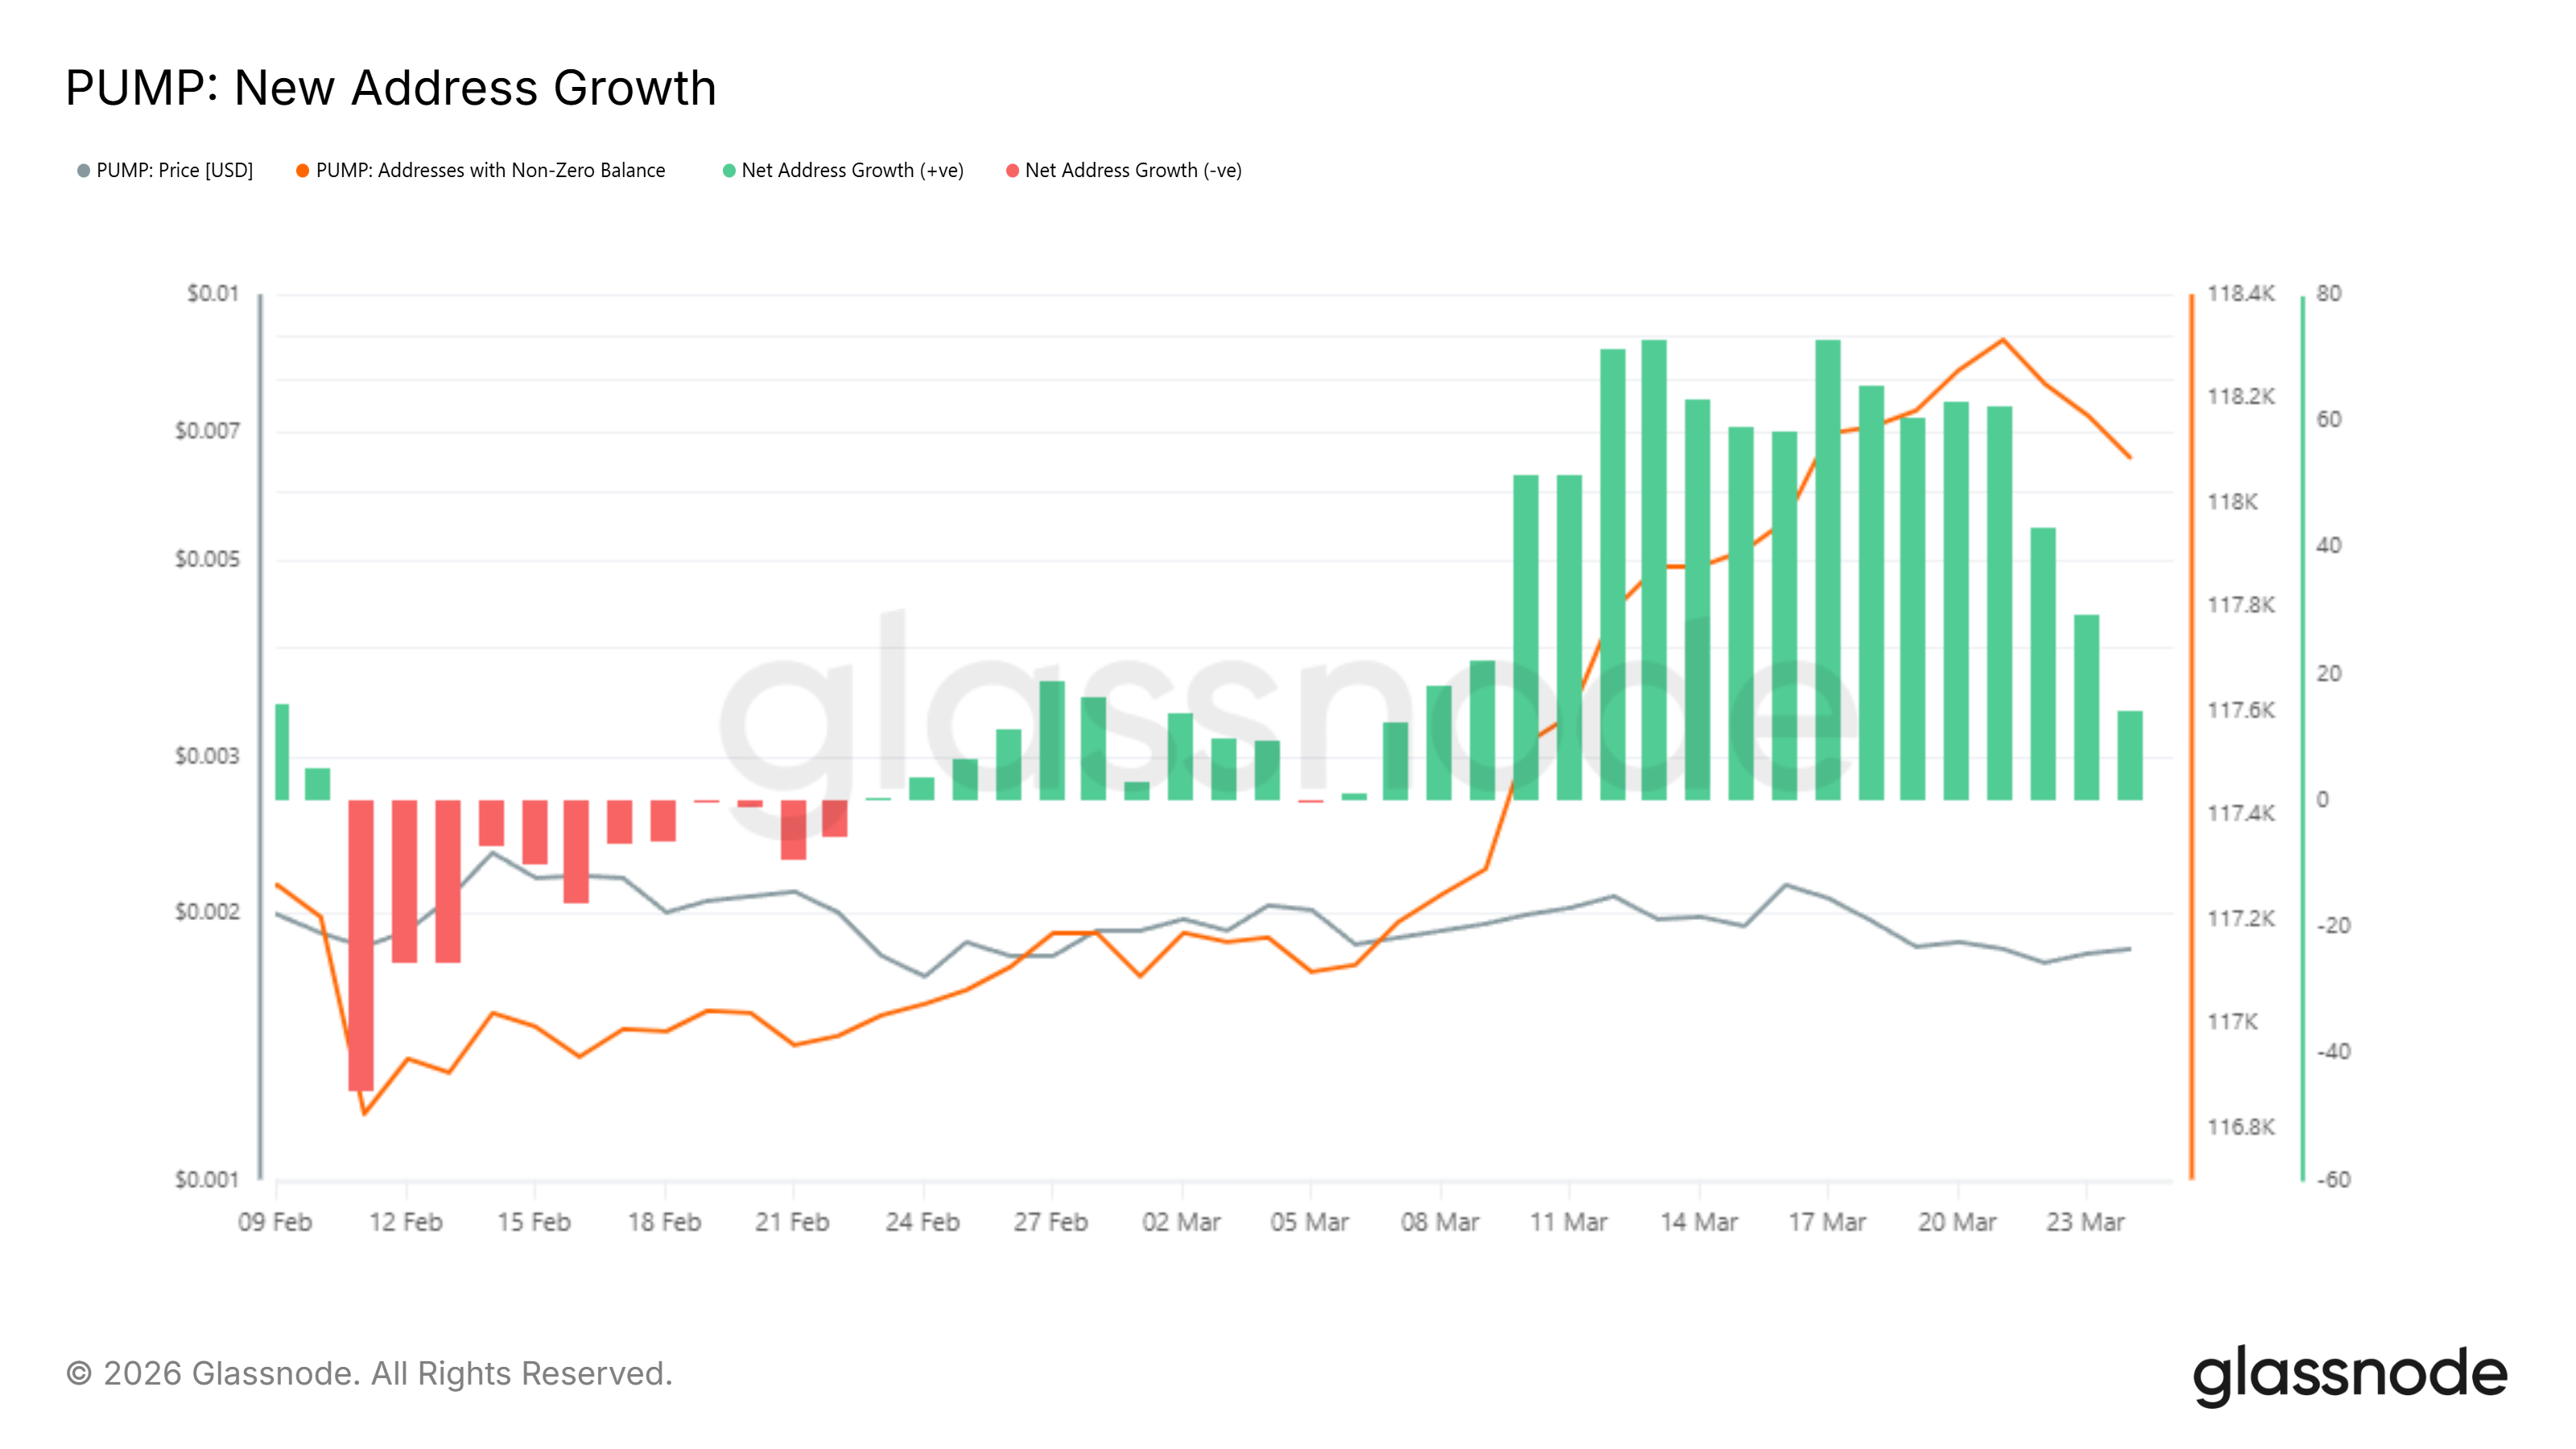 New PUMP addresses | Source: TradingView As fresh capital flow is crucial for maintaining upward momentum, the weakening growth in addresses poses a risk that the support signals could soon disappear if not improved.
PUMP Price Could Face Pressure Without New Demand
On the daily timeframe, PUMP remains below the 20-day EMA (around $0.0019) and has yet to break above the 23.6% Fibonacci level at $0.0018 — derived from the low of $0.0016 to the high of $0.0022.
Despite a technical rebound after the 18.18% drop, the price structure shows no clear improvement. The EMA continues downward, acting as dynamic resistance and limiting recovery efforts.
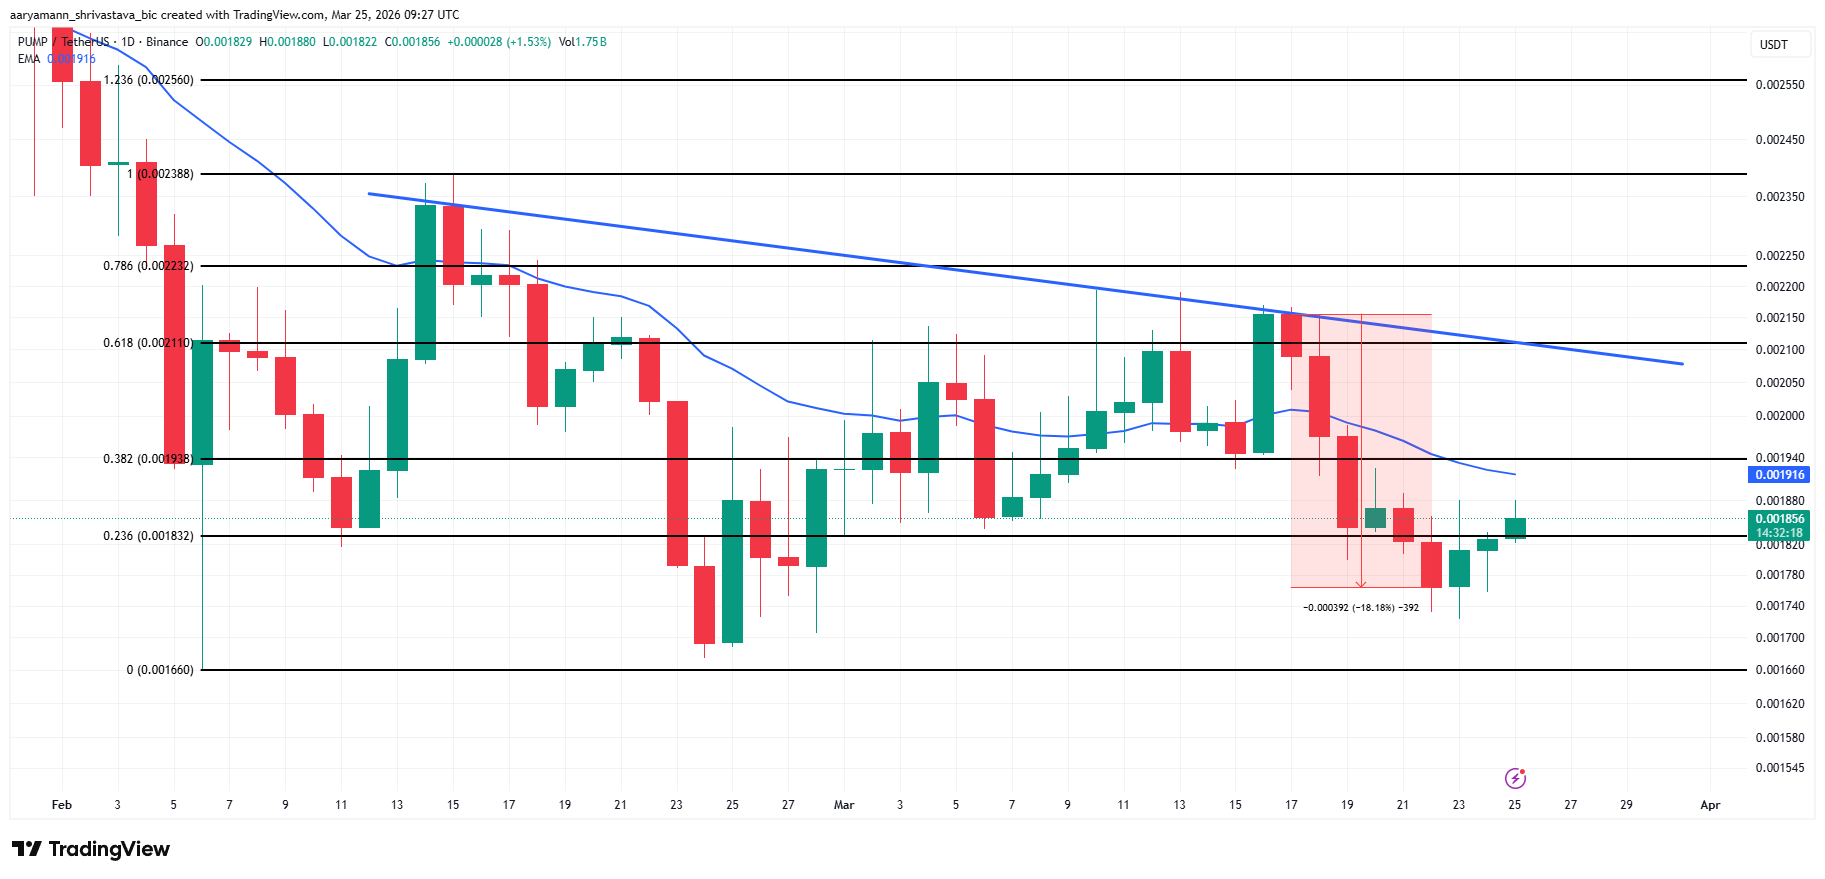 PUMP price analysis | Source: TradingView Given the current conditions — including outflows from holders, weakening MFI, and slowing address growth — the likelihood of a sustainable breakout above $0.0019 (Fibonacci 38.2%) remains limited. The $0.0018 zone continues to serve as near support, with $0.0017 being a critical bottom threshold.
If the price closes below $0.0018, a retest of the lows becomes more probable.
Conversely, to confirm a bullish trend, PUMP needs to close above $0.0021 (Fibonacci 61.8%). That would set the next targets at $0.0022 and then the extended zone at $0.0025. However, for this scenario to materialize, new capital — reflected in address growth — must rebound strongly, which has not yet occurred.
Disclaimer: The information on this page may come from third parties and does not represent the views or opinions of Gate. The content displayed on this page is for reference only and does not constitute any financial, investment, or legal advice. Gate does not guarantee the accuracy or completeness of the information and shall not be liable for any losses arising from the use of this information. Virtual asset investments carry high risks and are subject to significant price volatility. You may lose all of your invested principal. Please fully understand the relevant risks and make prudent decisions based on your own financial situation and risk tolerance. For details, please refer to
Disclaimer.
