
Pi Network (PI) is currently trading around $0.1883, consolidating near the 23.6% Fibonacci retracement level. Two corroborating technical signals are appearing simultaneously: the annualized realized volatility has rebounded to about 108% after seven months of compression; and the correlation coefficient between PI and Bitcoin has dropped to -0.30, indicating that when the market follows Bitcoin higher, PI may actually move lower against the trend.
End of 7-Month Volatility Compression: The Expansion Signal Reveals a Historical Pattern
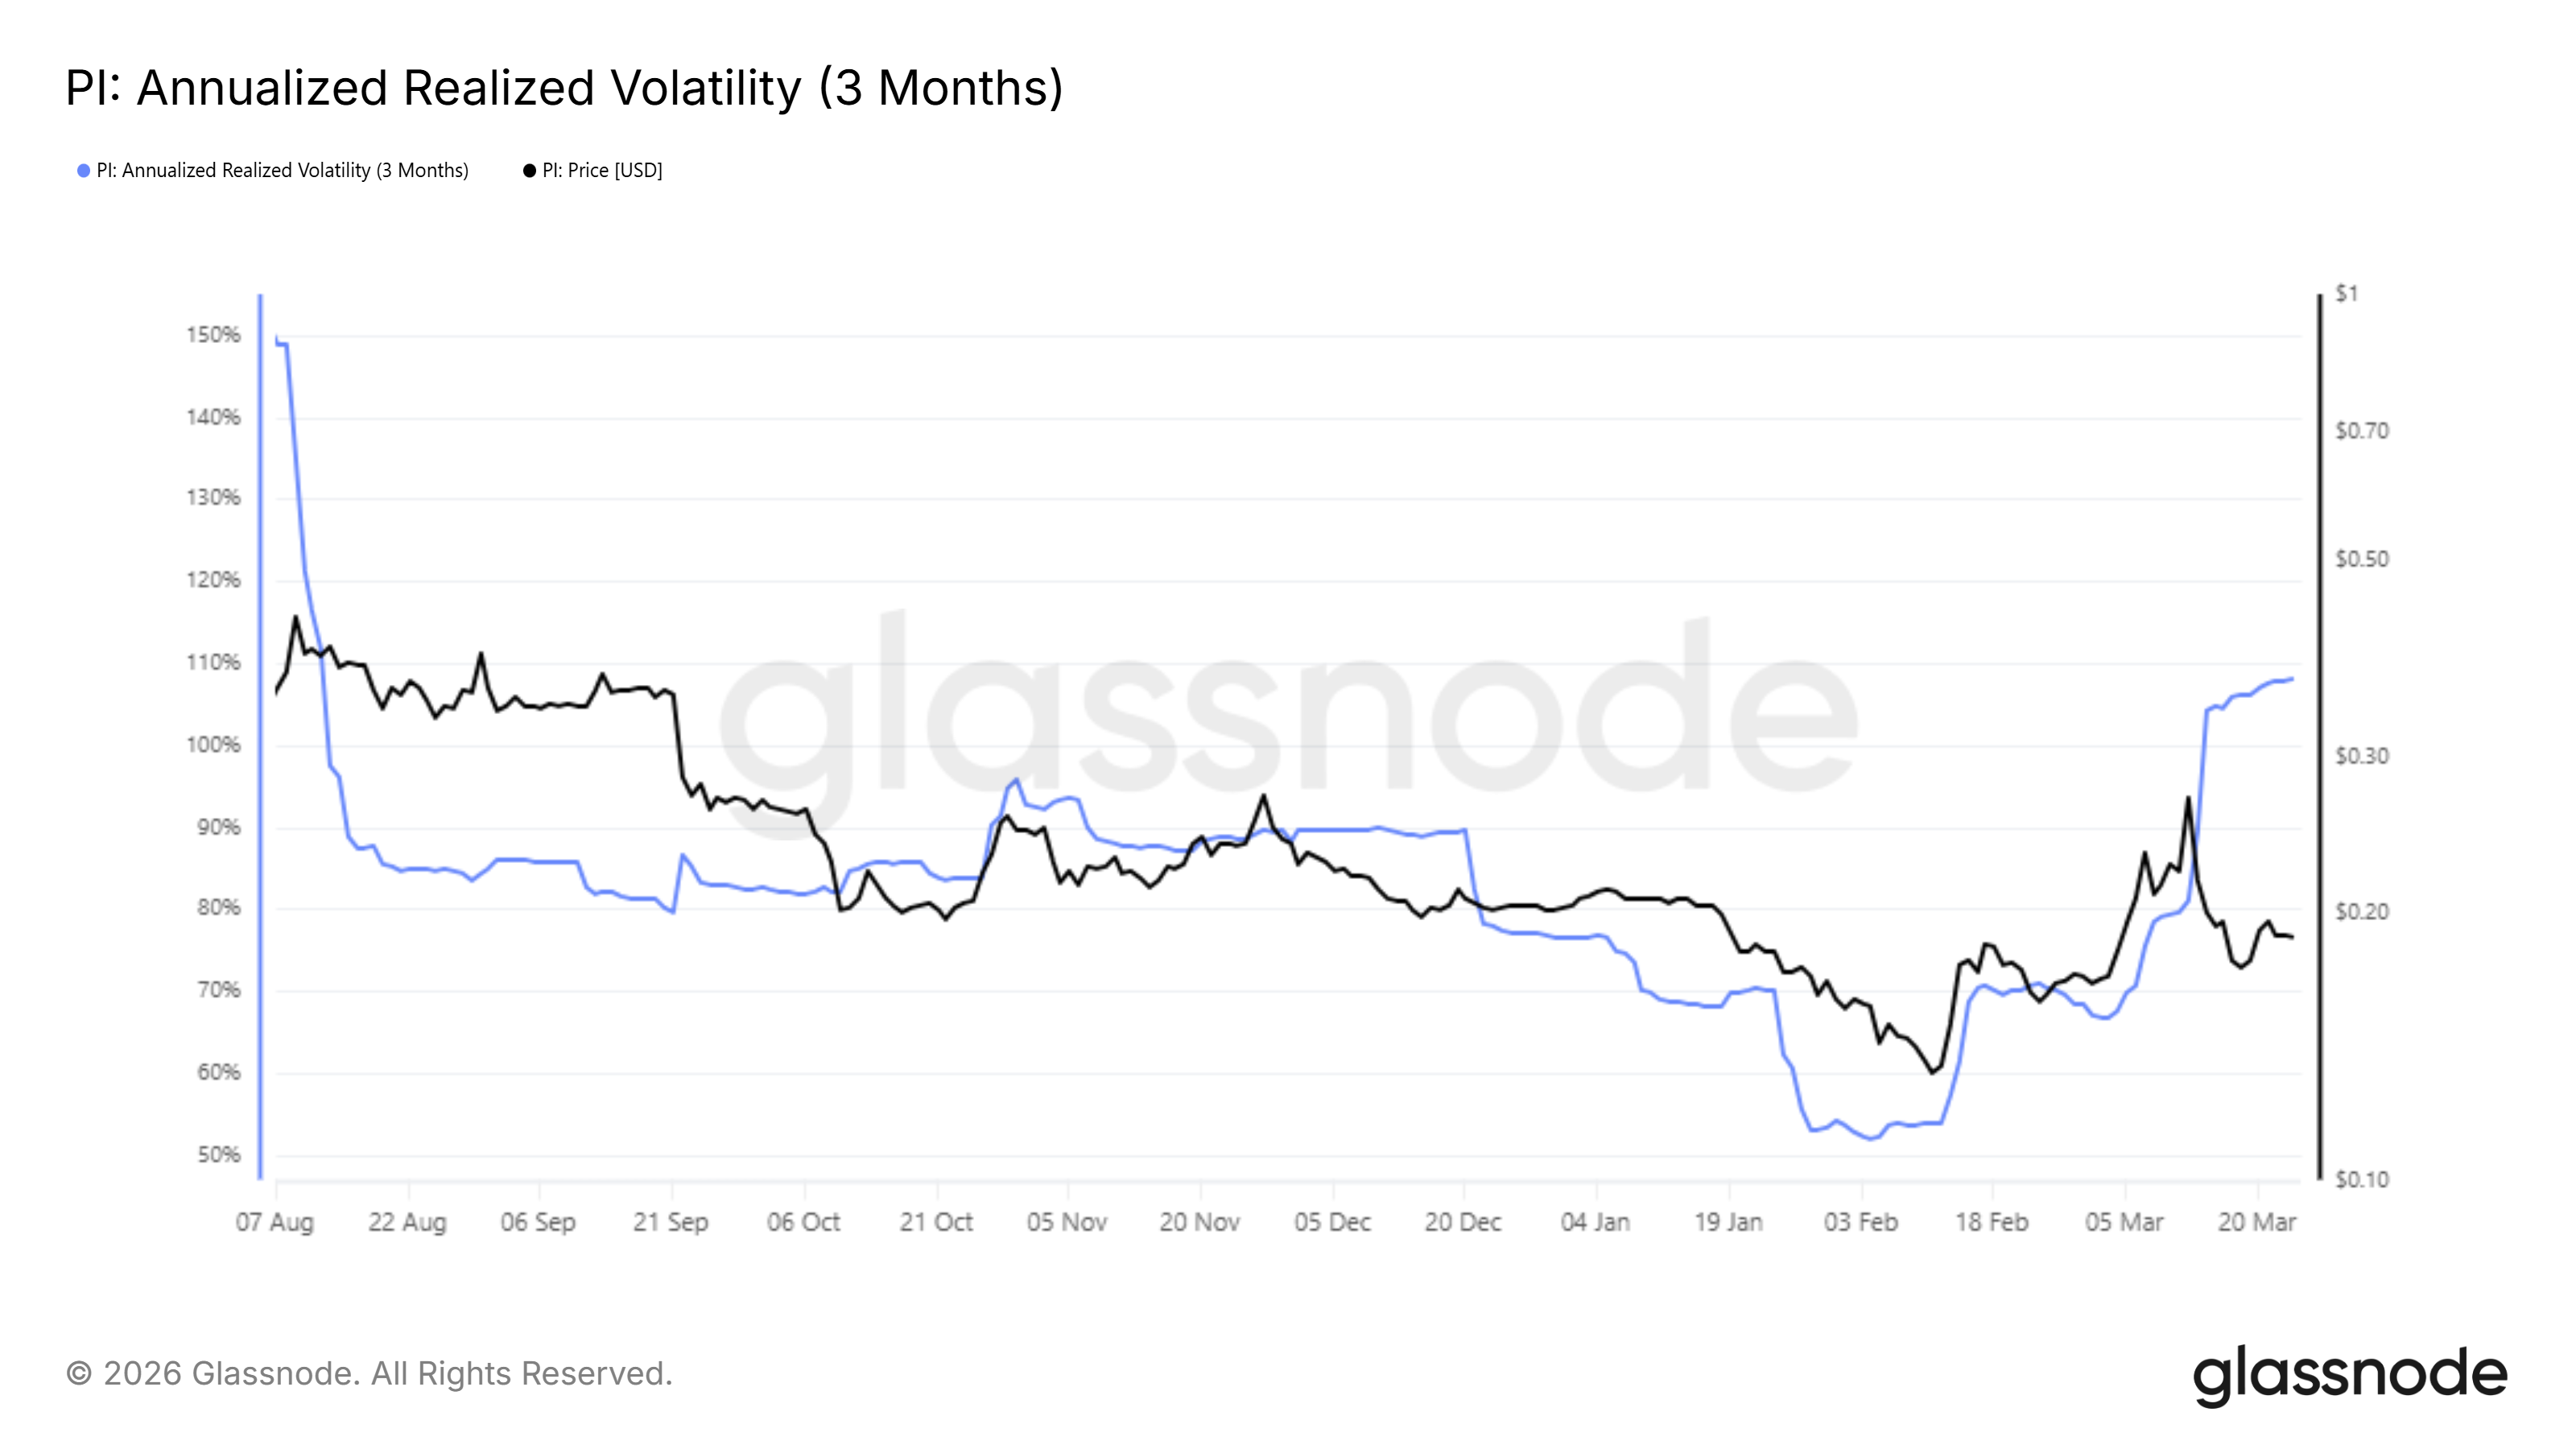 (Source: Glassnode)
According to Glassnode data, the annualized realized volatility of Pi surged above 150% in August 2025, then narrowed in sync with the price, bottoming out at around 52% in early February this year—this was a seven-month compression cycle, indicating market weakness rather than stability.
In March, the trend sharply reversed: PI’s price soared to $0.29, and volatility again broke above 100%, reaching about 108%. Historically, volatility expansion following long-term compression often signals a significant directional move. Notably, PI has failed to hold the $0.29 high and has already pulled back, with technicals pointing to increased downward pressure.
Bitcoin’s Negative Correlation: PI Losing Its Most Reliable Market Catalyst for Upside
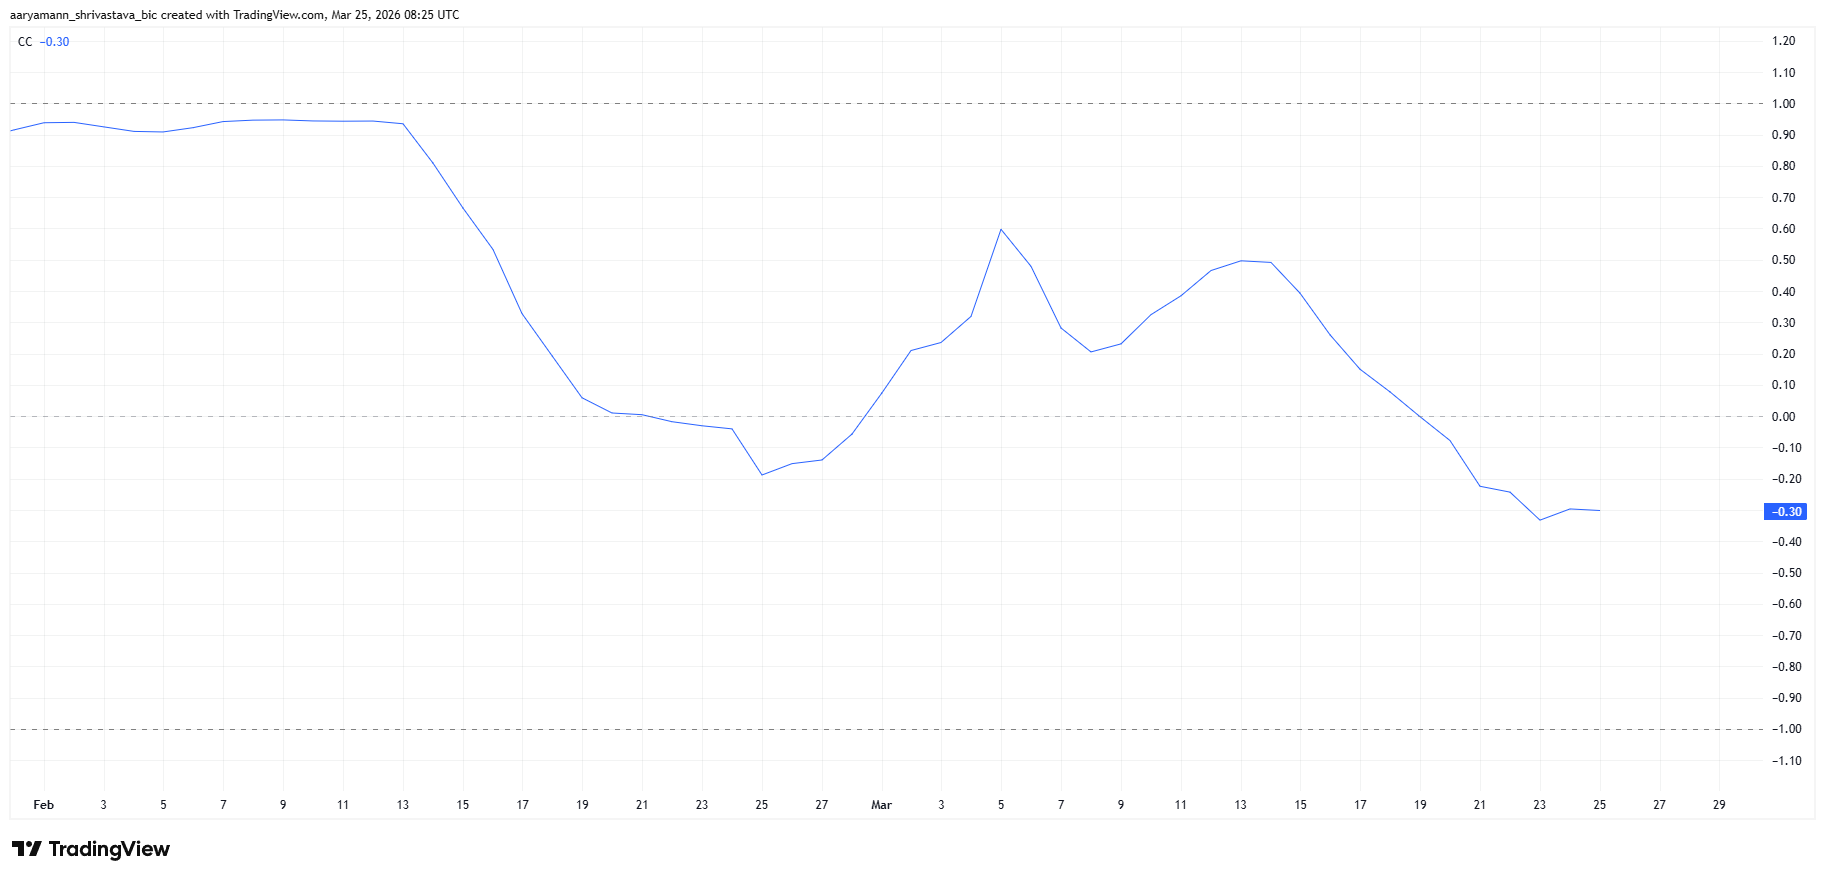 (Source: TradingView)
The correlation coefficient between PI and Bitcoin was close to 1.0 for most of February this year. Recently, it has fallen to -0.30, indicating that their movements are now more often in opposite directions.
The practical implication is: if Bitcoin’s rise drives the overall altcoin market higher, PI’s current trend is diverging from the broader market and cannot benefit from it. Analysts note that only when PI’s correlation with Bitcoin reverts above 0.50 can Bitcoin’s strength provide substantial support for PI.
Current Key Technical Levels for Pi
Fibonacci Grid: Extends from the February low of $0.1555 to the March 13 high of $0.2990
Current Resistance: $0.1894 (23.6% Fibonacci), $0.1930 (20-day EMA, downward sloping), $0.2103 (38.2% Fibonacci)
Downside Support: $0.1597, then $0.1527 (Fibonacci support and double top neckline)
Last Line of Defense: $0.1300 (historical low)
Technical Outlook: Double Top Pattern with 33% Downside Target and Bullish Reversal Conditions
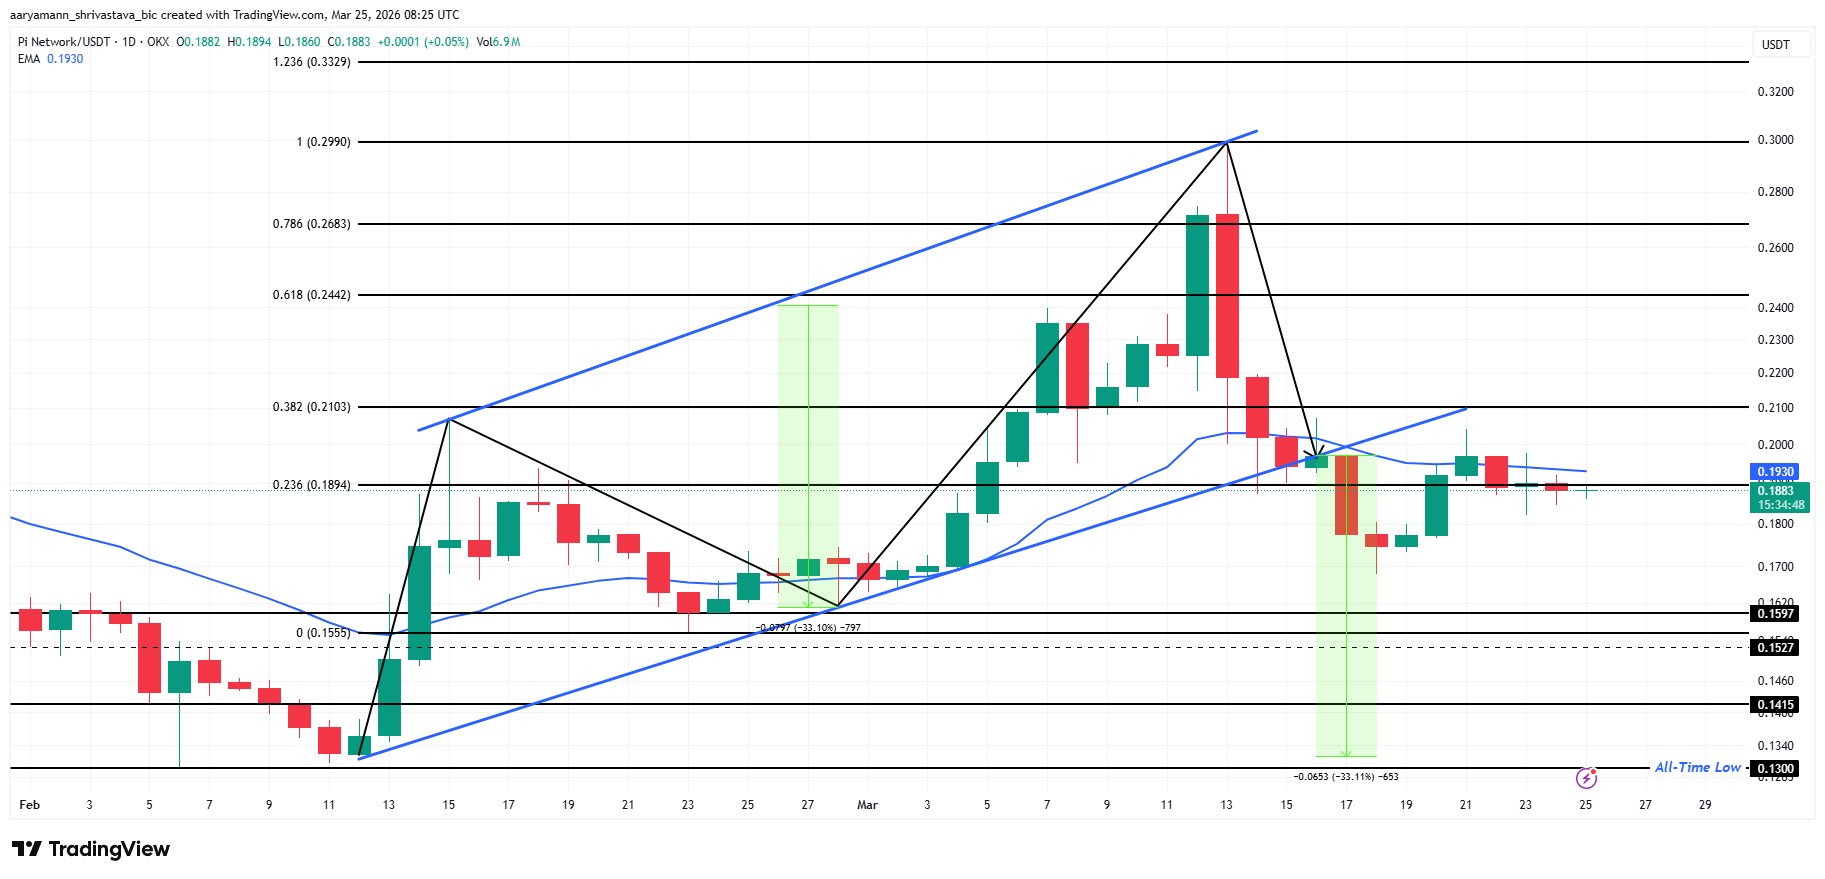 (Source: TradingView)
The daily chart shows a double top pattern. If confirmed, the target decline is approximately 33%, with the minimum target around $0.1300. The neckline of the double top is near $0.1555, and combined with Fibonacci analysis, the main support below is at $0.1527.
Bearish Trigger: If the daily close drops below $0.1894 (23.6% Fibonacci), it indicates the recent rebound failed, and the price may fall further to $0.1597, then to $0.1527.
Bullish Reversal Conditions: If the daily close stays above $0.2103 (38.2% Fibonacci), the upward target shifts to $0.2442; additionally, if PI-BTC correlation turns positive, the overall structure can shift from bearish to neutral.
Frequently Asked Questions
Q: What does the end of Pi’s 7-month volatility compression mean?
Pi’s annualized realized volatility compressed from over 150% in August 2025 to about 52% in February this year. This seven-month compression indicates market lull. The volatility rebounded to about 108% in March, marking the end of the compression cycle. Historically, such expansions often precede significant directional moves.
Q: Why might Bitcoin’s rise actually drag down Pi?
Currently, PI’s correlation with Bitcoin is -0.30, meaning their movements are inversely related. Analysts say that only when the correlation exceeds 0.50 can Bitcoin’s strength substantively support PI’s price.
Q: What are the key support and resistance levels for Pi?
Bearish scenario: a daily close below $0.1894 confirms failed rebound, with potential declines to $0.1597, $0.1527, and ultimately $0.1300.
Bullish scenario: a daily close above $0.2103 and a positive PI-BTC correlation could target $0.2442 higher.
Disclaimer: The information on this page may come from third parties and does not represent the views or opinions of Gate. The content displayed on this page is for reference only and does not constitute any financial, investment, or legal advice. Gate does not guarantee the accuracy or completeness of the information and shall not be liable for any losses arising from the use of this information. Virtual asset investments carry high risks and are subject to significant price volatility. You may lose all of your invested principal. Please fully understand the relevant risks and make prudent decisions based on your own financial situation and risk tolerance. For details, please refer to
Disclaimer.
