Bitcoin traded at $67,618 on March 9, 2026, with a market capitalization of $1.35 trillion and 24 hour trading volume of $44.47 billion. Price action remained contained within a $65,726 to $68,354 intraday range as technical indicators across multiple timeframes continued to signal a broadly neutral market structure.
Bitcoin Chart Outlook
On the daily chart, bitcoin remains locked in a consolidation pattern following the earlier decline from higher levels. Price activity continues to rotate inside the $65,726.94 to $68,354.48 range, reflecting a market that has not yet chosen a clear direction.
The broader structure suggests stabilization rather than trend acceleration, with the overall technical summary registering neutral. In practical terms, the market is pausing, digesting prior volatility, and refusing to give analysts the dramatic breakout everyone keeps refreshing their charts for.
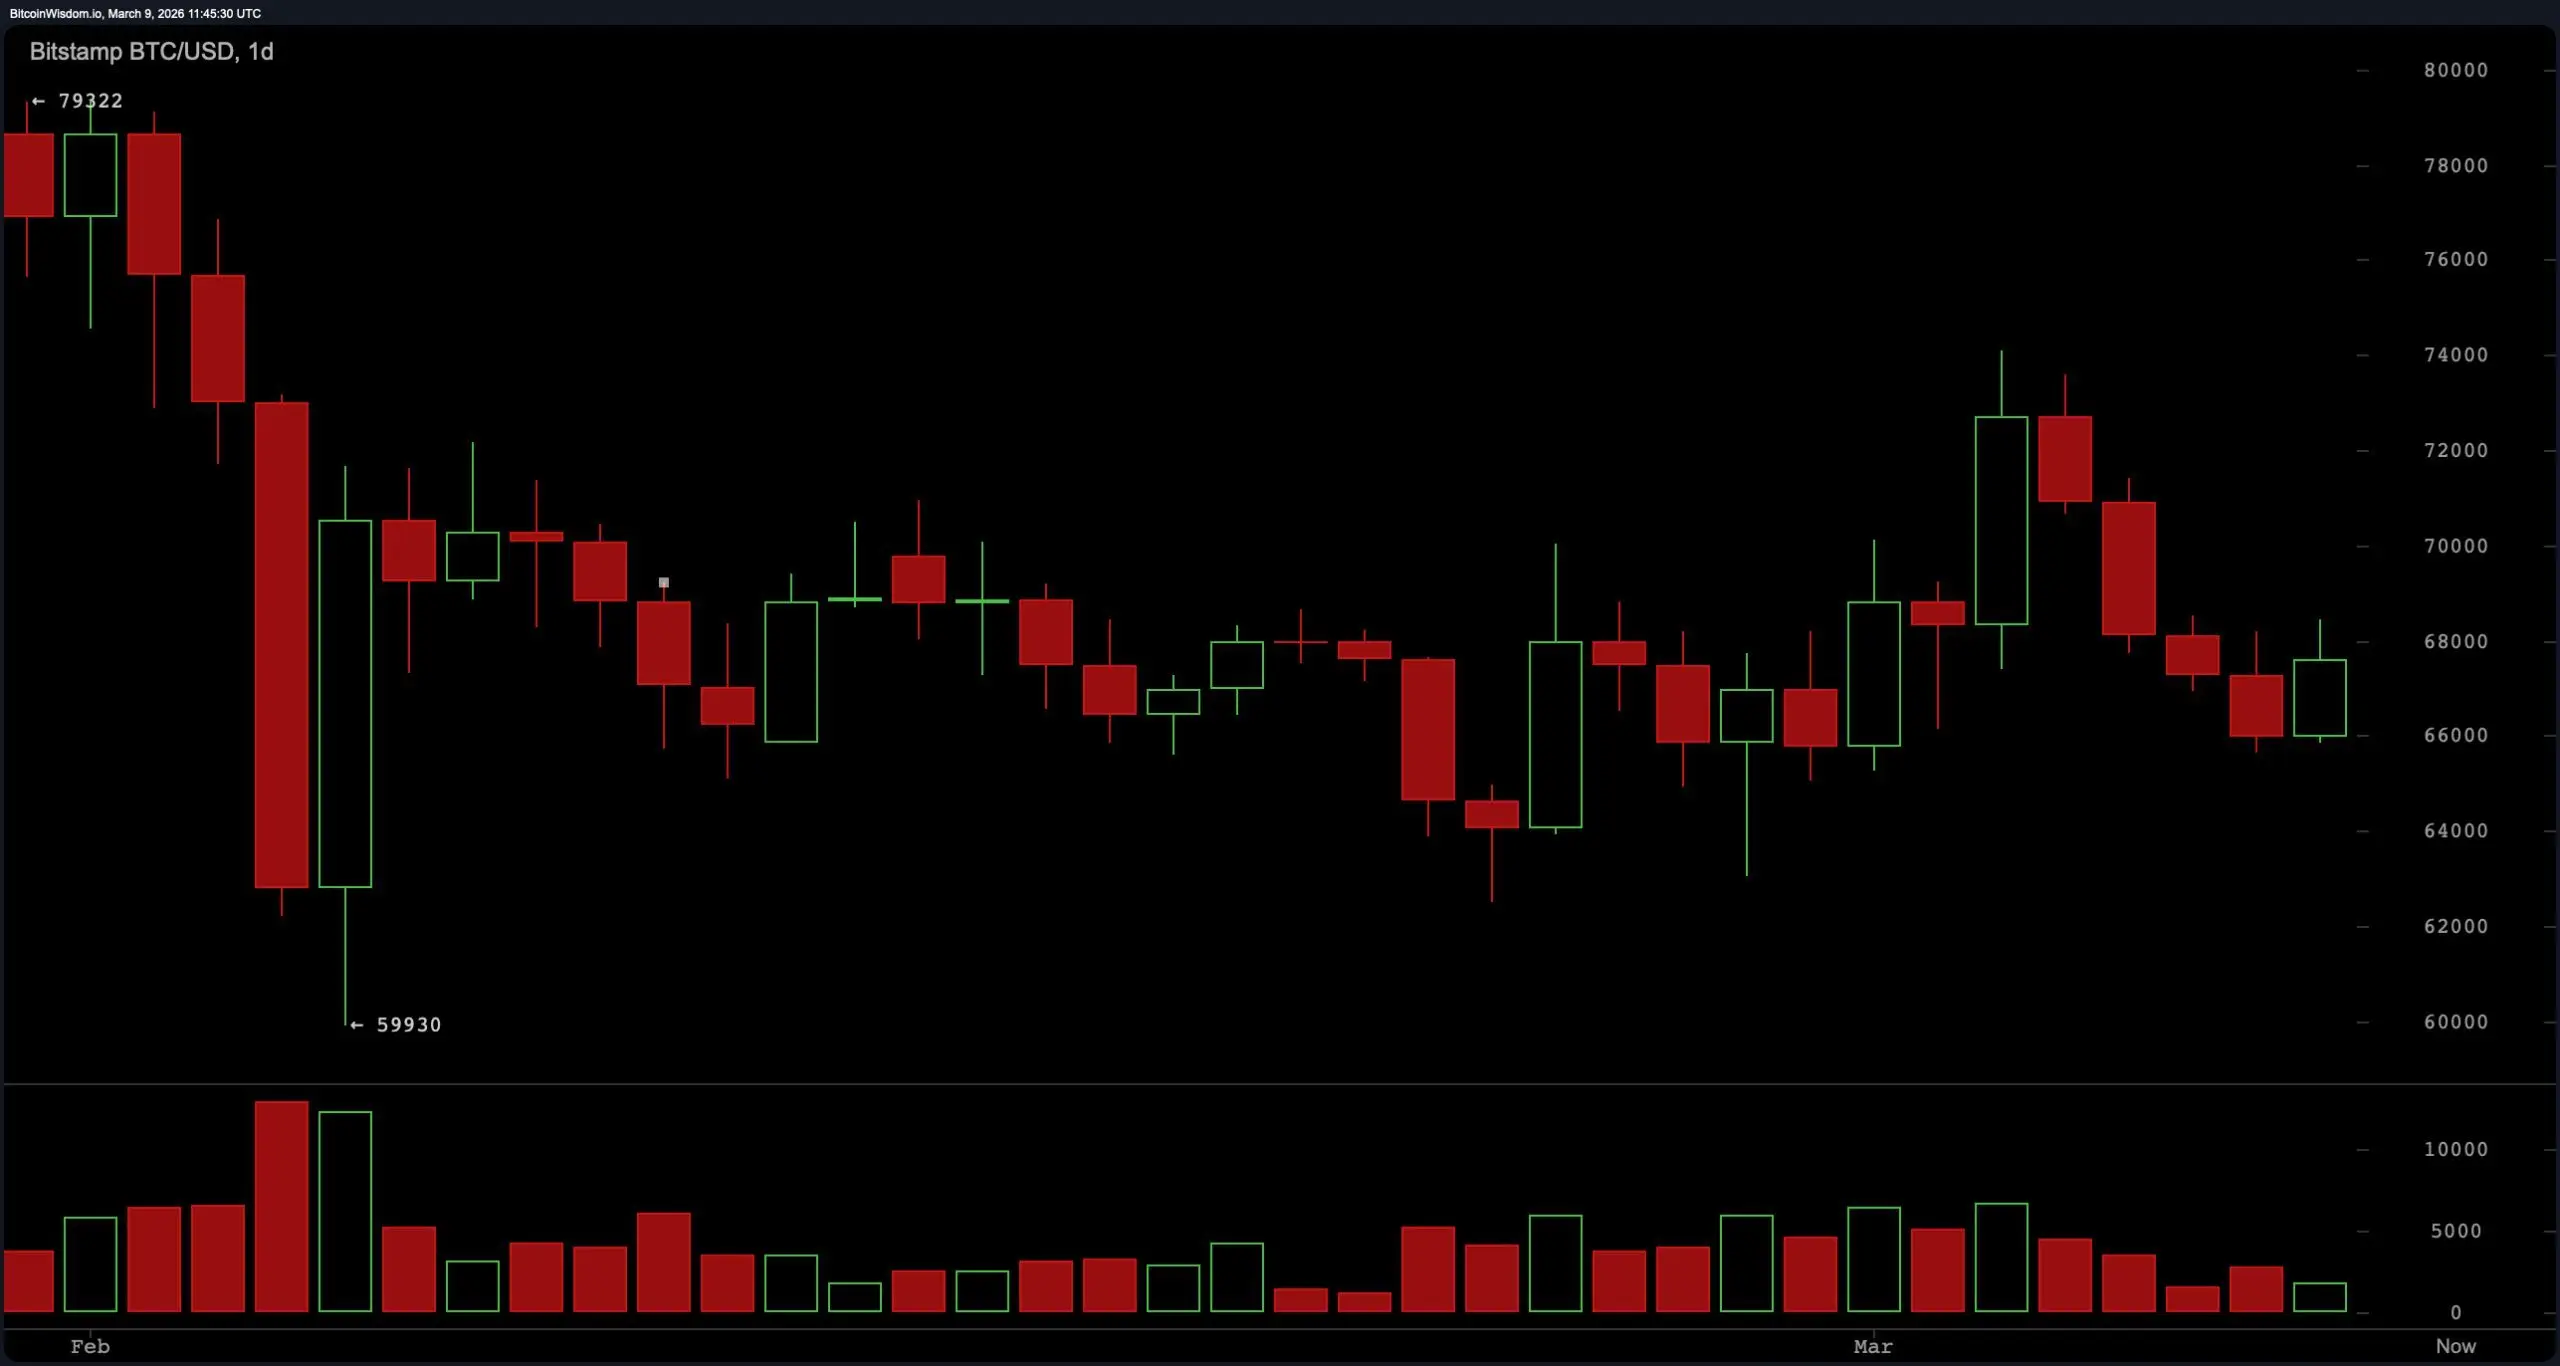 BTC/USD 1-day chart via Bitstamp on March 9, 2026.
The four-hour chart reinforces that consolidation narrative. Price action remains clustered near current levels with no decisive directional breakout, reflecting a market that continues to balance short-term pressure against attempts at recovery. Movements within this timeframe show bitcoin repeatedly testing nearby levels but failing to establish sustained momentum in either direction. The result is a classic sideways structure where volatility exists but directional conviction remains limited.
BTC/USD 1-day chart via Bitstamp on March 9, 2026.
The four-hour chart reinforces that consolidation narrative. Price action remains clustered near current levels with no decisive directional breakout, reflecting a market that continues to balance short-term pressure against attempts at recovery. Movements within this timeframe show bitcoin repeatedly testing nearby levels but failing to establish sustained momentum in either direction. The result is a classic sideways structure where volatility exists but directional conviction remains limited.
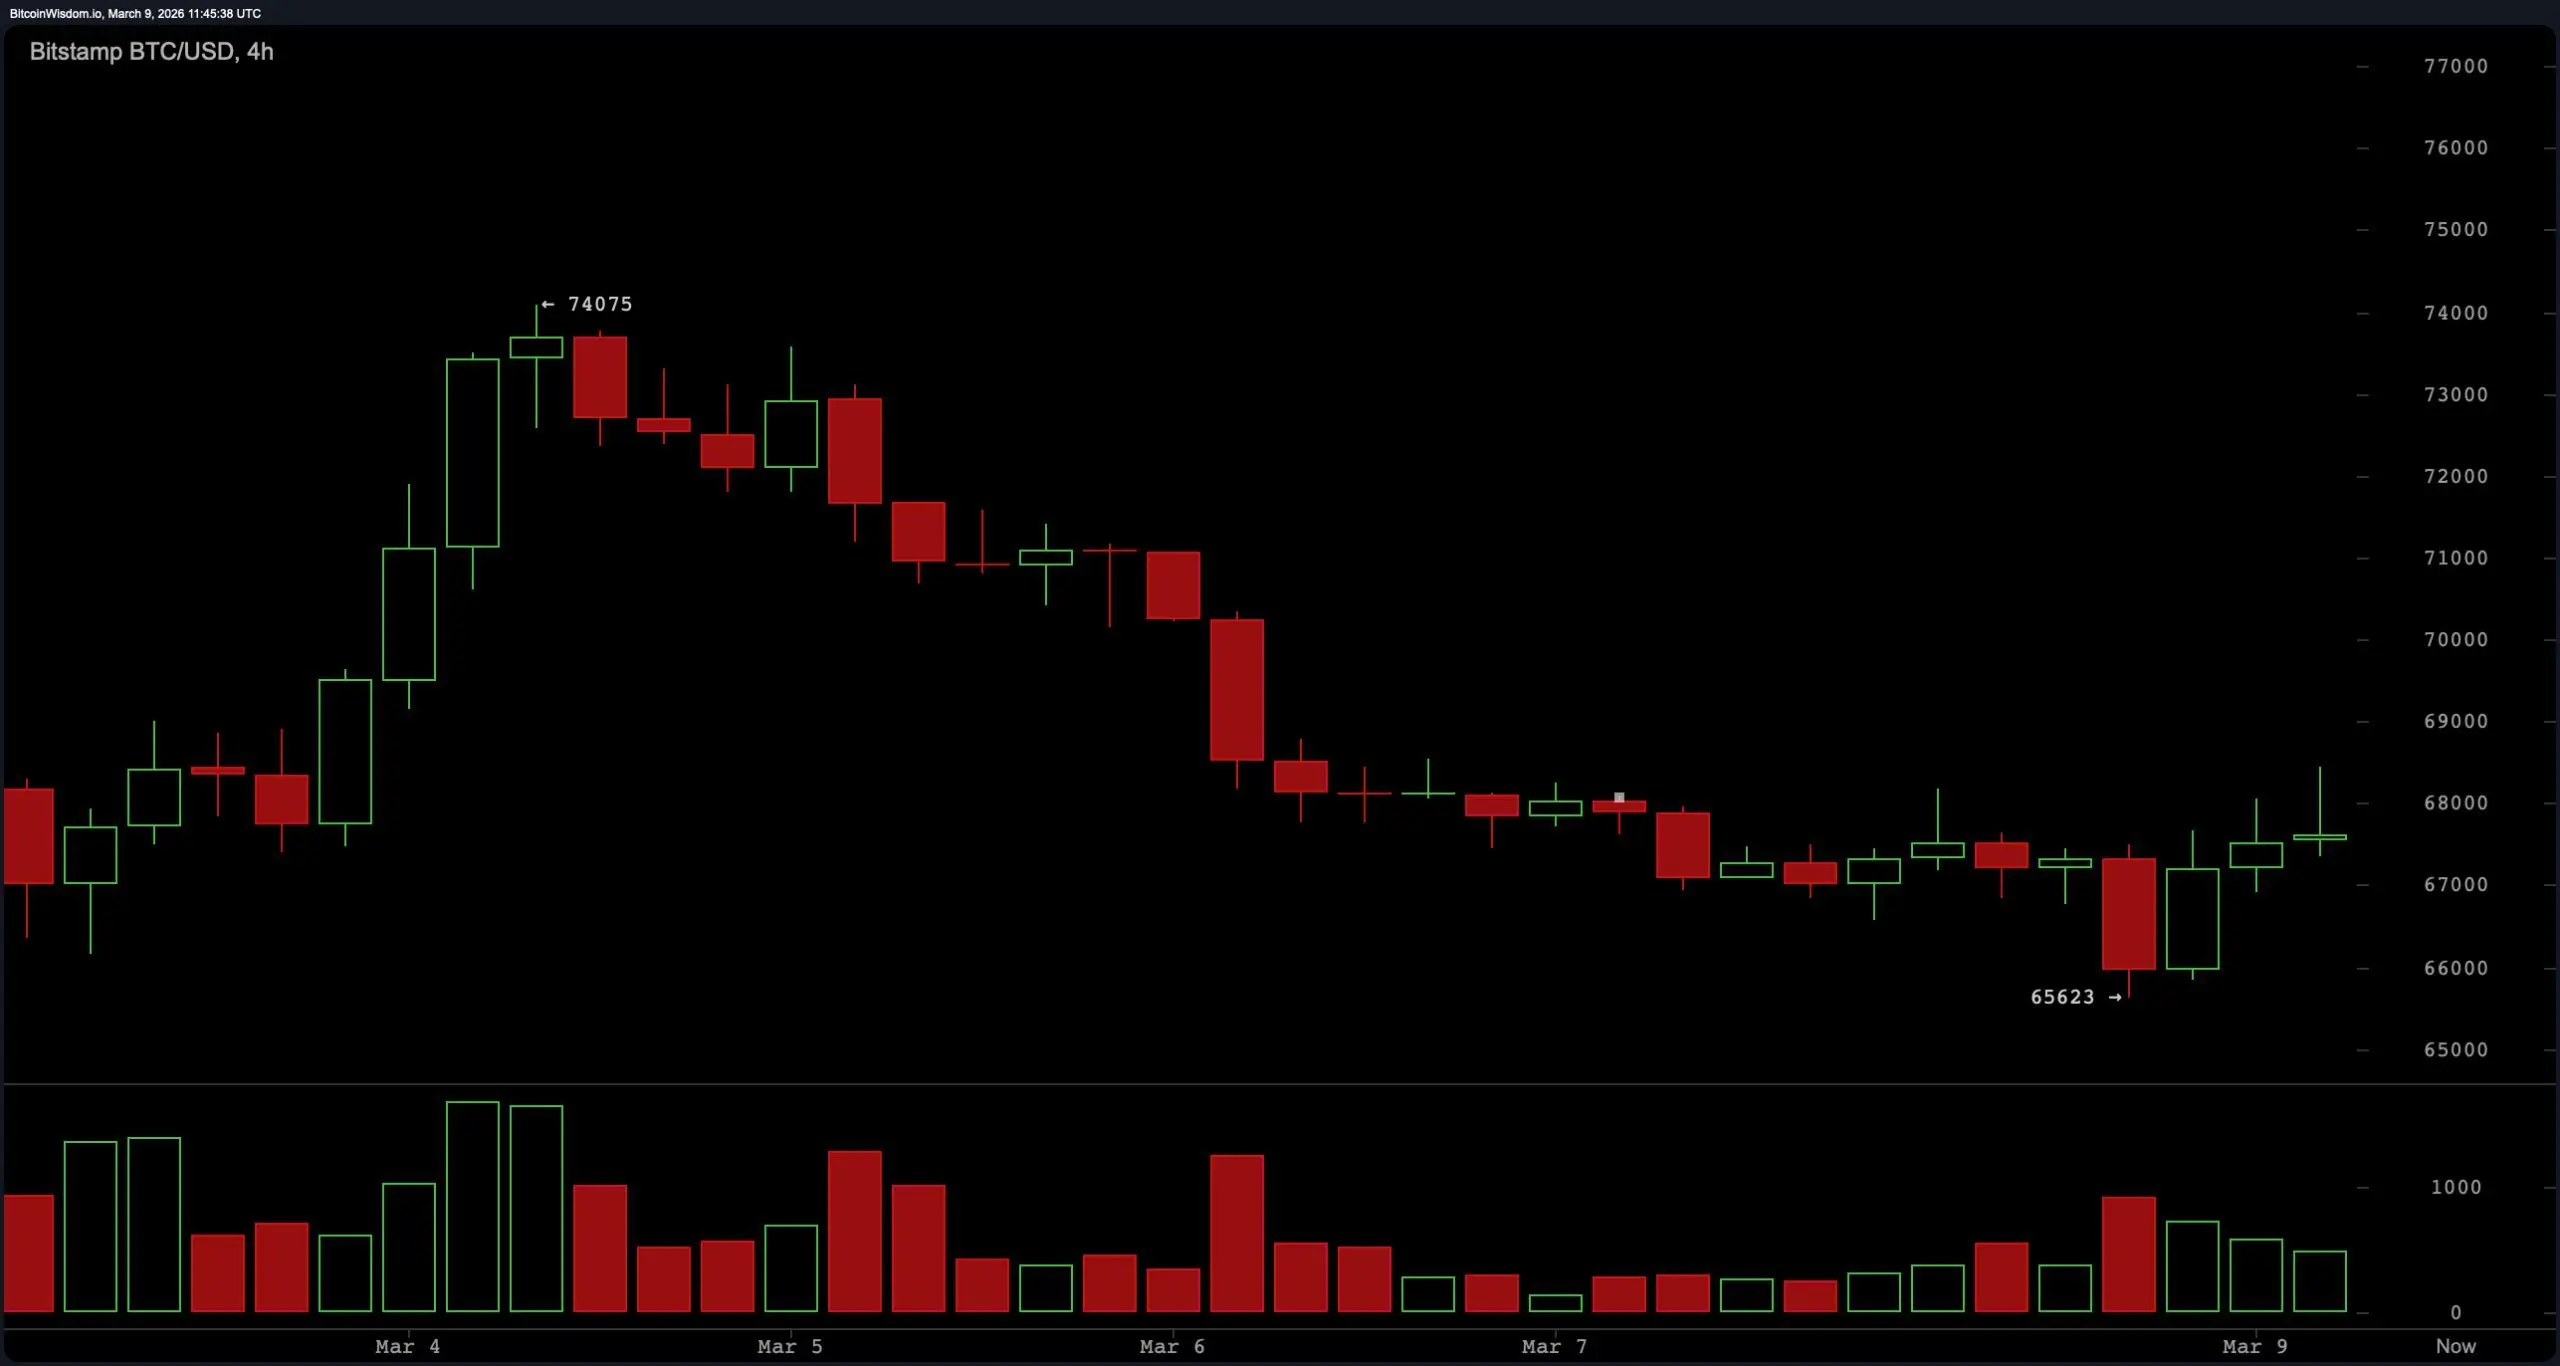 BTC/USD 4-hour chart via Bitstamp on March 9, 2026.
On the one-hour bitcoin chart, trading tightens further. Price activity is confined to narrow movements around Bitstamp’s reference price of $67,248, with minor fluctuations occurring inside the broader 24-hour range. Short-term volatility remains modest, and the chart structure reflects a market cycling between small upward pushes and equally small pullbacks. For traders watching microstructure, the action resembles consolidation rather than expansion, meaning the next directional move will likely require a stronger catalyst than the market currently has.
BTC/USD 4-hour chart via Bitstamp on March 9, 2026.
On the one-hour bitcoin chart, trading tightens further. Price activity is confined to narrow movements around Bitstamp’s reference price of $67,248, with minor fluctuations occurring inside the broader 24-hour range. Short-term volatility remains modest, and the chart structure reflects a market cycling between small upward pushes and equally small pullbacks. For traders watching microstructure, the action resembles consolidation rather than expansion, meaning the next directional move will likely require a stronger catalyst than the market currently has.
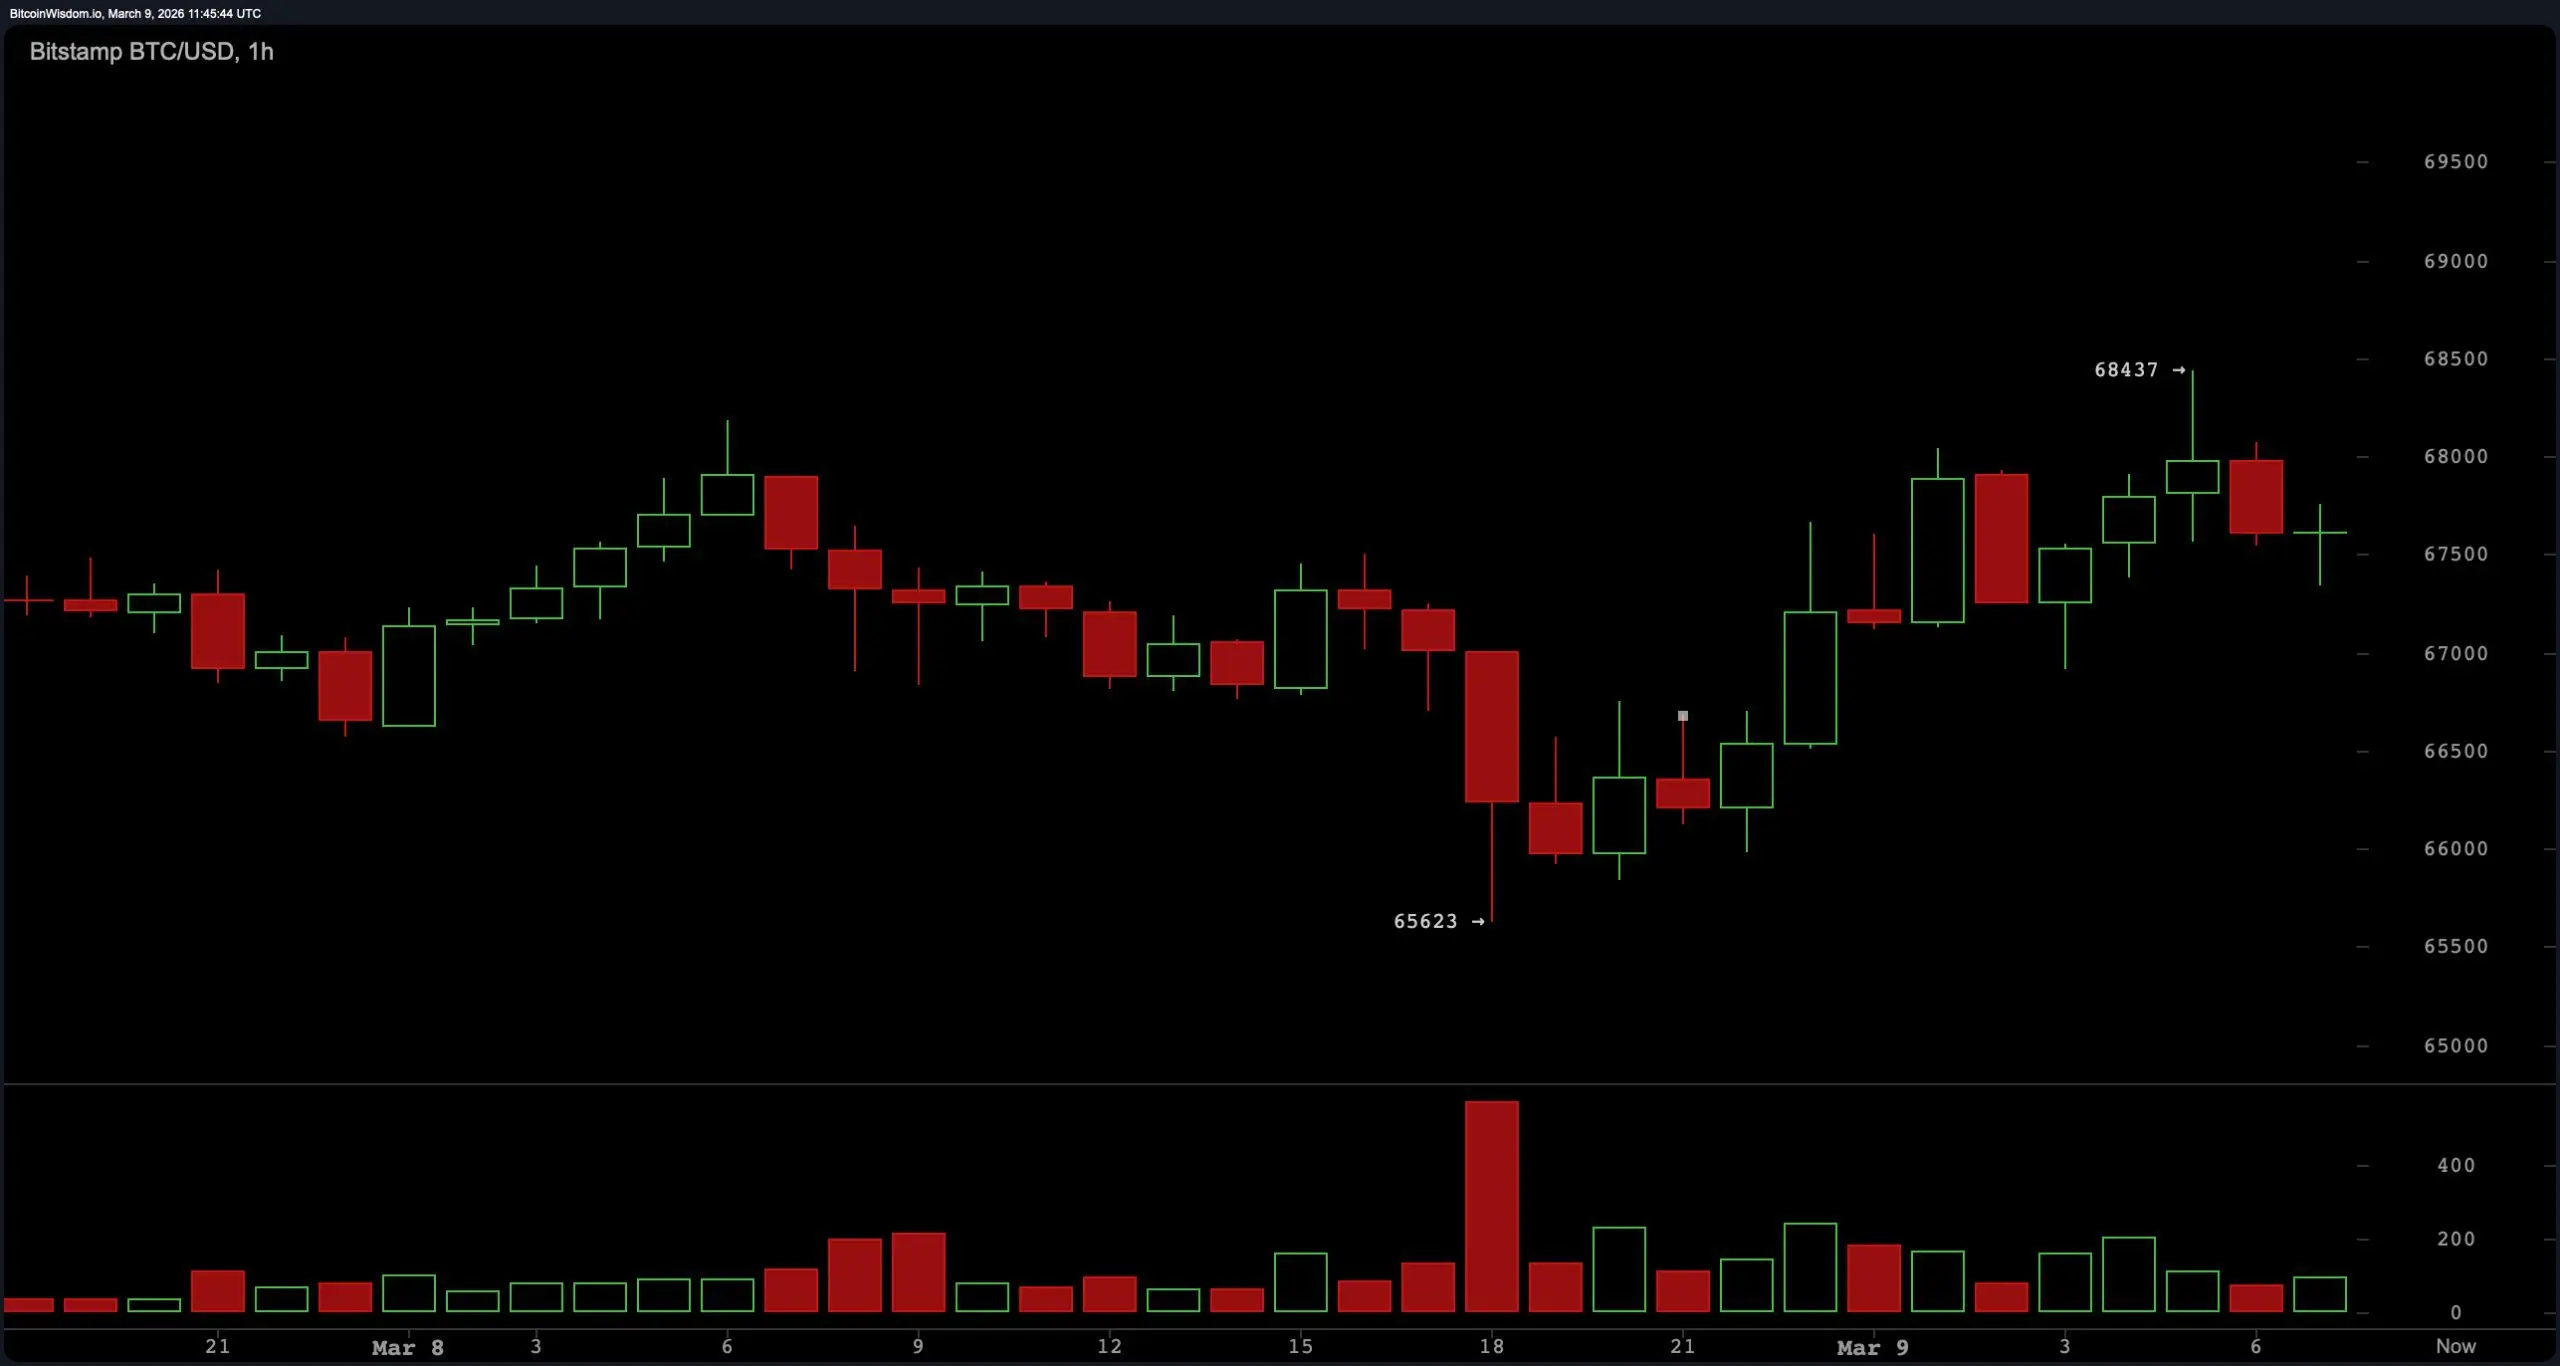 BTC/USD 1-hour chart via Bitstamp on March 9, 2026.
Oscillator readings align closely with this neutral price behavior. The relative strength index ( RSI) stands at 46, indicating balanced momentum. Stochastic prints 38, while the commodity channel index (CCI) registers negative 11, both remaining within neutral territory. The average directional index (ADX) sits at 34, suggesting trend strength exists but not necessarily in a decisive direction.
BTC/USD 1-hour chart via Bitstamp on March 9, 2026.
Oscillator readings align closely with this neutral price behavior. The relative strength index ( RSI) stands at 46, indicating balanced momentum. Stochastic prints 38, while the commodity channel index (CCI) registers negative 11, both remaining within neutral territory. The average directional index (ADX) sits at 34, suggesting trend strength exists but not necessarily in a decisive direction.
The Awesome oscillator posts a value of 660 and remains neutral, while momentum shows 1,649, and the moving average convergence divergence ( MACD) level prints negative 1,274, both categorized as buy signals in the oscillator summary. Overall, the oscillator group reads nine neutral signals and two buy signals — a polite way of saying the market is thinking about moving, but hasn’t committed yet.
Moving averages present a heavier technical ceiling. The exponential moving average (EMA) at 10 periods sits at $67,879, and the simple moving average (SMA) at 10 periods at $68,237, both positioned above current price levels. The EMA (20) prints $68,421 while the SMA (20) stands at $67,469 and represents the lone short-term bullish signal. The EMA (30) registers $69,810 and the SMA (30) $67,851, continuing the pattern of overhead resistance across shorter timeframes. Further out, the EMA (50) at $73,229 and the SMA (50) at $73,621 remain significantly above the current market price.
Longer-term moving averages reinforce that imbalance. The EMA (100) is positioned at $80,611 and the SMA (100) at $81,937, while the EMA (200) stands at $88,865 and the SMA (200) at $95,197. With most averages stacked above the current market level, the moving average summary shows a dozen bearish signals, one neutral, and two bullish signals. In other words, the oscillators are calm, the charts are sideways, and the moving averages are still looming overhead like skeptical referees waiting to see if bitcoin can actually push higher.
Bull Verdict:
Bitcoin’s neutral oscillator readings combined with stable consolidation across the 1-hour, 4-hour, and daily charts suggest the market is maintaining balance rather than showing signs of accelerating weakness. Momentum and the MACD level both register positive signals, indicating the underlying momentum has not fully faded despite sideways price action. With price holding above the simple moving average (SMA) 20 at $67,469 and remaining within the upper half of the $65,726–$68,354 intraday range, the technical structure leaves room for upward continuation if price sustains strength near current levels.
Bear Verdict:
Despite neutral oscillators, the moving average structure continues to lean heavily bearish, with a dozen unfavorable signals across the entire indicator group. Bitcoin remains below several key averages, including the exponential moving average (EMA) 10 at $67,879, SMA 10 at $68,237, and EMA 20 at $68,421, while longer-term averages such as the EMA 50 at $73,229 and SMA 50 at $73,621 sit significantly above current price levels. This stacked overhead resistance suggests upward progress may remain limited, unless bitcoin can reclaim those averages, leaving the market vulnerable to further consolidation or downside pressure within the existing range.
FAQ 🧭
- What is bitcoin’s price on March 9, 2026?
Bitcoin is trading around $67,618 with a 24-hour range between $65,726 and $68,354.
- What do bitcoin’s technical indicators show right now?
Most oscillators, including the relative strength index ( RSI), signal neutral momentum, while momentum and moving average convergence divergence ( MACD) show mild strength.
- Why is bitcoin trading sideways?
Bitcoin remains in consolidation as the price moves within a narrow range and fails to break major resistance levels.
- Are bitcoin’s moving averages bullish or bearish?
Most moving averages remain above the current price, creating technical resistance and a bearish leaning structure.
Disclaimer: The information on this page may come from third parties and does not represent the views or opinions of Gate. The content displayed on this page is for reference only and does not constitute any financial, investment, or legal advice. Gate does not guarantee the accuracy or completeness of the information and shall not be liable for any losses arising from the use of this information. Virtual asset investments carry high risks and are subject to significant price volatility. You may lose all of your invested principal. Please fully understand the relevant risks and make prudent decisions based on your own financial situation and risk tolerance. For details, please refer to
Disclaimer.