
Bloomberg ETF Analyst Eric Balchunas said on Thursday that despite Solana (SOL) tokens dropping 57% since related ETFs launched in the U.S. in July 2025, these funds have still accumulated $1.5 billion in inflows with no significant redemption wave. Balchunas added that 50% of the funds flowing into Solana ETFs come from institutional investors.
Solana ETF Capital Inflows: Quantifying Institutional Resilience
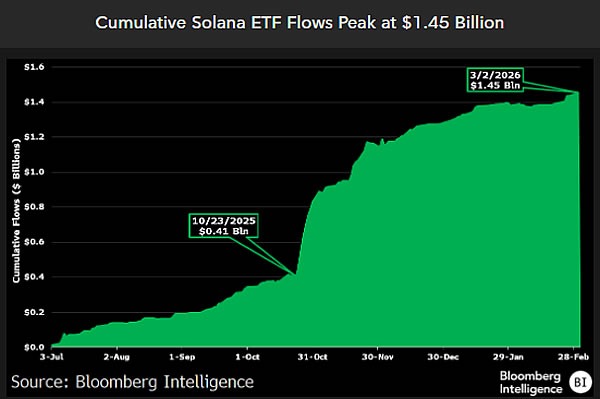 (Source: Bloomberg Intelligence)
Balchunas’s analysis on X platform pointed out that the performance of Solana ETFs is an industry anomaly. He cited industry practice: ETFs launched during a downturn rarely sustain inflows. “If they lose 57% in the first six months, most don’t last a year or two. Solana’s case defies physical laws.”
Here are recent key fund flow data for Solana ETFs:
- Wednesday (March 5): $19 million net inflow
- Thursday (March 6): $6 million net outflow, first in over a month
- Since launch: $1.5 billion net inflow, with 50% from institutional investors
Balchunas’s core point is that the 50% institutional share not only indicates the amount of capital but also signifies a long-term investor base with willingness to hold, forming a potential foundation for future growth.
Market Cap-Adjusted Comparison: Solana ETF’s Relative Performance May Surpass Bitcoin ETF
Balchunas provided a precise comparison framework: since Solana’s market cap is about $50 billion, far below Bitcoin’s approximately $1.4 trillion, directly comparing ETF inflows between the two involves scale bias.
Adjusting Solana ETF inflows proportionally to Bitcoin’s market cap, the equivalent net inflow is about $54 billion, roughly twice the net new capital inflow of Bitcoin during the same period.
He emphasized the background differences: Bitcoin ETFs launched when BTC prices were rising, providing a tailwind; whereas Solana ETFs face a declining token market, making the adjusted relative performance more notable in industry comparisons.
SOL Spot Market: Valuation Background Amid 70% Drop
The spot performance of SOL tokens contrasts sharply with institutional ETF inflows. Driven by memecoin frenzy in January 2025, SOL hit a record high of $293 per token. Since then, market sentiment has turned sharply negative. According to CoinGecko data, SOL is now trading around $88, down 70% from its peak, with a 2.7% drop on the day and an 11% decline over the past month.
Since ETF launch, a 57% decline means all early investors are currently at paper losses. However, continued institutional holdings suggest they have not engaged in large-scale redemptions but maintained a long-term stance.
FAQs
Q: Why can Solana ETFs maintain inflows despite a 57% token decline?
According to Eric Balchunas, the key factor is the 50% institutional investor share. Institutions tend to adopt a long-term view and do not redeem immediately due to short-term price swings, creating a relatively stable capital base that allows Solana ETFs to sustain $1.5 billion in net inflows despite adverse conditions.
Q: What does Balchunas mean by Solana ETF “violating physical laws”?
He refers to industry norms: ETFs launched during a declining market for the underlying assets rarely sustain positive inflows; most such funds don’t last beyond one or two years. The fact that Solana ETF still has $1.5 billion in inflows after a 57% token drop is seen as defying this industry rule.
Q: How does the performance of Solana ETF compare to Bitcoin ETF after market cap adjustment?
Adjusting Solana ETF inflows proportionally to market cap (Solana $50 billion vs Bitcoin $1.4 trillion), the equivalent inflow is about $54 billion, roughly twice the Bitcoin ETF’s net inflow during the same period. It’s important to note that Bitcoin ETF launched when BTC was in an uptrend, whereas Solana faces a declining token market, with fundamentally different background conditions.
Disclaimer: The information on this page may come from third parties and does not represent the views or opinions of Gate. The content displayed on this page is for reference only and does not constitute any financial, investment, or legal advice. Gate does not guarantee the accuracy or completeness of the information and shall not be liable for any losses arising from the use of this information. Virtual asset investments carry high risks and are subject to significant price volatility. You may lose all of your invested principal. Please fully understand the relevant risks and make prudent decisions based on your own financial situation and risk tolerance. For details, please refer to
Disclaimer.