triangle descending
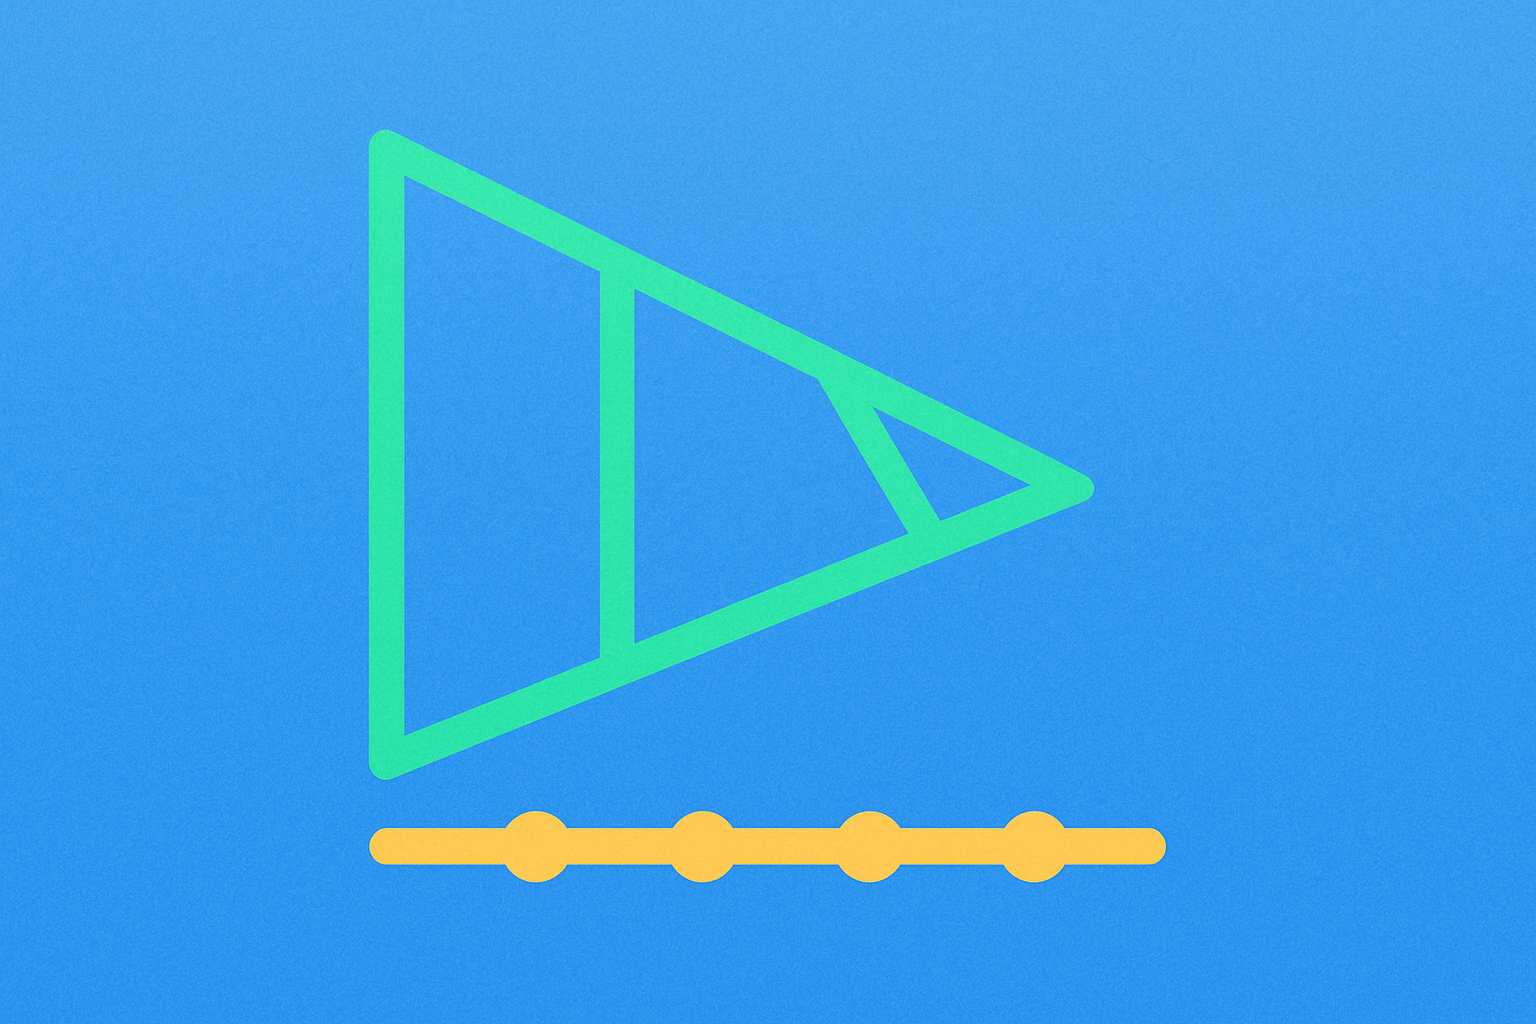
What Is a Descending Triangle?
A descending triangle is a common price pattern that signals increasing selling pressure. It is formed by a relatively flat support level—where buyers repeatedly prevent further declines—and a downward-sloping resistance line, which reflects progressively lower highs as sellers drive prices down. Price action oscillates and converges between these two lines. Traders closely watch for a decisive breakdown below support, ideally accompanied by rising trading volume, as a signal for the start of a new bearish trend. However, it is important to note that not all descending triangles result in breakdowns; occasionally, an upward breakout occurs.
Why Should You Understand Descending Triangles?
Descending triangles visually represent growing sell-side momentum and waning demand, making risk management and market timing more straightforward.
In the crypto markets, where volatility is high and trading never stops, relying on intuition alone is challenging. Descending triangles help you quickly identify if support levels are repeatedly tested and if rebound highs are falling—warning that a breakdown could trigger accelerated price declines. For spot trading, this pattern can indicate when to reduce positions or set protective stop-losses; for derivatives, it can signal when to lower leverage or wait for a more stable entry.
For example, after a period of sideways movement, BTC may form a descending triangle where support is tested multiple times and rebound strength weakens. If price breaks down with increased volume, volatility usually spikes, and early recognition can help you avoid being caught in a losing position.
How Does the Descending Triangle Work?
The essence of the pattern lies in sellers continuously lowering their ask prices while buyers defend the same support level until it weakens.
Lower highs with each rebound suggest more capital is willing to sell at reduced prices. Repeated tests of support mean buy orders exist at that level, but as these tests accumulate, the order book “thins out.” When buying interest diminishes or negative news hits, prices are more likely to break down sharply.
If the breakdown is confirmed by a significant increase in volume (the amount traded within a given period), it shows broad market consensus on direction. A typical price behavior is the “pullback”—after breaking support, price rebounds to the former support (now resistance); if the pullback fails and price drops again, the trend continuation is more likely. Beware of “false breakouts,” where price temporarily dips below support but quickly recovers and closes above it—this usually signals sudden buyer strength or short covering.
How Do Descending Triangles Appear in Crypto Markets?
Descending triangles are common in both spot and perpetual contracts, with breakdowns often accompanied by shifts in volume and derivative metrics.
On Gate’s spot markets, major coins like BTC and ETH frequently form descending triangles on daily or 4-hour charts. If support is repeatedly tested and a large bearish candle closes below support with high volume, further downside is increasingly likely. For altcoins with thinner order books, breakdowns may feature long wicks and rapid price slippage.
In Gate’s USDT perpetual contracts (no expiry), two additional signals are worth noting: funding rate (the cost of holding long or short positions) often flips from positive to negative around breakdowns, showing short-seller dominance; open interest (OI, total unsettled contracts) rises after breakdowns, indicating new money joining the move. When OI increases and volume surges during a breakdown, trend confirmation is stronger.
Scenario example: On a 4-hour chart, an asset forms a descending triangle; support is repeatedly tested, funding rate shifts from +0.01% to -0.02%, and OI rises within an hour after the breakdown. Entering after a failed pullback—rather than chasing the first breakdown candle—is typically more prudent.
How to Trade Descending Triangles
The goal is to manage risk and execute trades stepwise upon confirmation—not chase prices impulsively.
Step 1: Choose your timeframe. Daily charts offer greater reliability; 4-hour and 1-hour charts react faster but contain more noise. Beginners should focus on daily or 4-hour charts.
Step 2: Draw lines and confirm. Connect at least two lows for horizontal support and at least two lower highs for descending resistance; ideally confirm with three points per line.
Step 3: Wait for signals. Look for a closing price that breaks support with increased volume; in derivatives, also watch for funding rate turning negative and open interest rising—avoid trading based on a single wick.
Step 4: Entry and stop-loss. Two entry strategies: break entry (after the closing candle breaks support), or failed pullback entry (price retests former support and stalls). Place stop-loss above the pullback high or original support to protect against false breakouts.
Step 5: Take profit and manage. Use the “measured move”—the height from triangle’s highest point to support—as your target; partial profit-taking is also valid. Aim for a risk-reward ratio no lower than 1:1.5 or 2:1; avoid overleveraging or all-in positions.
Practical tip: Consider timing windows (major data releases or project events) and avoid trading during news-heavy periods. Multi-timeframe alignment adds reliability—such as daily breakdown coinciding with failed 4-hour pullback.
Recent Trends and Data on Descending Triangles
Over the past year, breakdown confirmation has increasingly depended on volume and derivatives metrics, with trend continuation after failed pullbacks becoming more consistent.
Looking from full-year 2025 through early 2026, descending triangle breakdowns accounted for roughly 60% of cases (with some variation by asset and timeframe), consistent with long-term technical analysis samples. For assets forming triangles after consolidation, breakout-day volume often increases 30%–50% over the prior five-day average (especially pronounced in Q3/Q4 2025).
Regarding false breakouts: In late 2025, when news flow is heavy (macro data or project events), quick reversals after false breakdowns became more common; multiple pullbacks before an upward breakout have also increased, making it critical to wait for close confirmation and pullback validation.
On the derivatives side, funding rates flipped from positive to negative much more frequently on or after breakdown days throughout 2025; open interest rose more often in tandem with breakdowns as well. This reflects leveraged traders piling into shorts after triangle breakdowns, fueling continuation—but if volume fades or news reverses direction, pullbacks or even reversals can occur.
Tip: Different traders use different sample sets and definitions, so numbers may vary. You can backtest your preferred timeframes and assets over the past six to twelve months—tracking breakdown rates, breakout-day volume changes, and pullback success rates—to tailor strategies to your style.
Descending Triangle vs. Ascending Triangle: What’s the Difference?
They differ in line direction, participant psychology, and typical breakout path.
The descending triangle features horizontal support plus descending resistance—sellers push prices lower while buyers defend support. The ascending triangle has horizontal resistance plus rising support—buyers bid higher while sellers defend resistance. Descending triangles more often break downwards; ascending triangles are biased toward upward breakouts. Both can break in either direction—confirmation via close and volume is key.
In trading, descending triangles focus on failed pullbacks after support breaks—stop-losses are set above the recent high or original support; ascending triangles focus on successful retests after resistance breaks—stop-losses go below original resistance. Both patterns use measured targets and phased profit-taking, emphasizing risk management first.
Related Terms
- Descending Triangle: A chart pattern where highs decline while lows remain flat—a bearish signal.
- Technical Analysis: The practice of predicting future price moves by studying historical price and volume data.
- Support Level: A horizontal line where buyers cluster and prices struggle to fall below.
- Resistance Level: A horizontal line where sellers cluster and prices struggle to rise above.
- Breakout: The event of price moving decisively beyond support or resistance—often sparking trend shifts.
FAQ
Should I Sell Immediately When a Descending Triangle Forms?
No—you should wait for confirmation of the breakout signal. Prices typically break down from descending triangles but may rebound several times before doing so. Consider selling only when price clearly closes below support with rising volume to avoid losses from false breakouts.
In a Descending Triangle, Which Line Is Most Important—the Sloping Resistance or Flat Support?
The flat support line is more critical since it determines the eventual breakout direction. While descending resistance shows weakening seller pressure, the horizontal support is the real “bottom line”—once breached, bearish signals are confirmed. Traders should focus on monitoring support strength and breakdowns.
How Long Until a Clear Breakout After Descending Triangle Formation?
It typically takes days to weeks depending on chart timeframe and market sentiment. Short-term charts (1-hour/4-hour) may break out within hours; daily charts often require weeks. During this period, changes in trading volume and rebound heights can hint at upcoming breakout direction.
What Does Declining Volume Mean in a Descending Triangle?
Falling volume signals decreasing market participation—both buyers and sellers are waiting on the sidelines. This tense equilibrium can precede major moves: when a breakout comes with surging volume, trend change confirmation is stronger. If volume does not confirm the breakout, beware of false signals.
After Tracking a Descending Triangle on Gate, How Should I Set My Stop-Loss After Breakdown?
After a downward breakout, set your stop-loss 5–10% above the breached support line. This allows you to exit quickly on false breakouts while giving genuine ones room for volatility. You can also use Gate’s risk management tools to set alert levels for price proximity to support.
References & Further Reading
Related Articles

Exploring 8 Major DEX Aggregators: Engines Driving Efficiency and Liquidity in the Crypto Market

What Is Copy Trading And How To Use It?
