ZCX vs ENJ: Oyun ekosisteminin iki önde gelen kripto para token’ının kapsamlı analizi

Giriş: ZCX ve ENJ Yatırım Karşılaştırması
Kripto para piyasasında Unizen (ZCX) ile Enjin Coin (ENJ) karşılaştırması, yatırımcılar için vazgeçilmez bir gündem maddesi haline gelmiştir. Bu iki varlık, piyasa değeri sıralaması, uygulama alanları ve fiyat performansı bakımından belirgin farklılıklar gösterirken, kripto varlık ekosisteminde de farklı konumlanmalara sahiptir.
Unizen (ZCX): Ethereum blokzincirinde çalışan, borsa temelli bir platform tokenıdır ve Binance üzerindeki BNB'ye benzer bir model sunar.
Enjin Coin (ENJ): 2009 yılında geliştirilen bu token, çevrimiçi oyun topluluklarına yönelik öncü bir platform olarak tanınır ve içerik yönetim sistemleri ile forum üreticilerine odaklanır.
Bu makalede, ZCX ve ENJ'nin yatırım değerinin kapsamlı bir analizi yapılacak; tarihsel fiyat eğilimleri, arz mekanizmaları, kurumsal benimseme, teknolojik ekosistemler ve gelecek projeksiyonları incelenecek. Yatırımcılar için en kritik soruya yanıt aranacak:
"Şu anda hangisi daha avantajlı bir yatırım?"
I. Fiyat Geçmişi Karşılaştırması ve Güncel Piyasa Durumu
ZCX ve ENJ Tarihsel Fiyat Eğilimleri
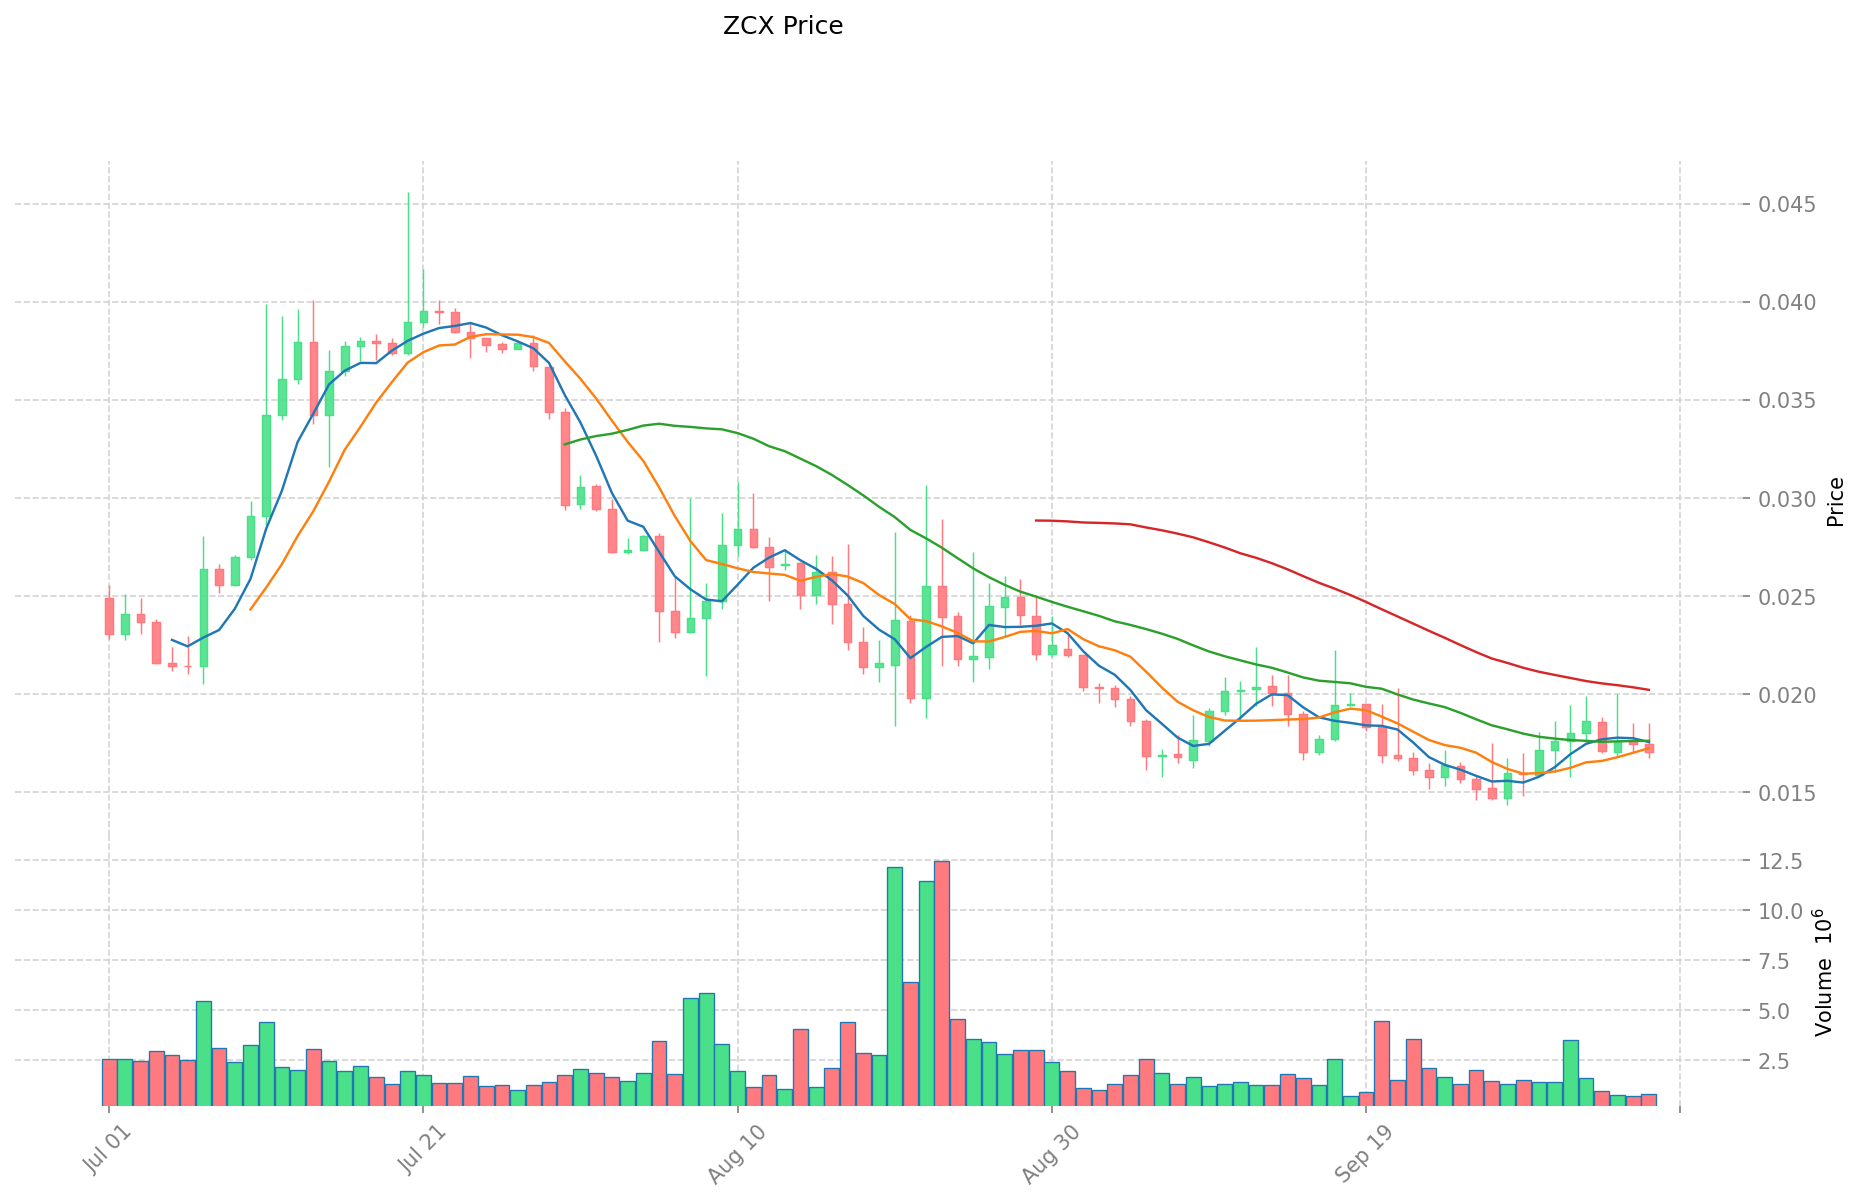
- 2021: ZCX 14 Eylül 2021'de tüm zamanların en yüksek seviyesi olan 7,03 $'a ulaştı.
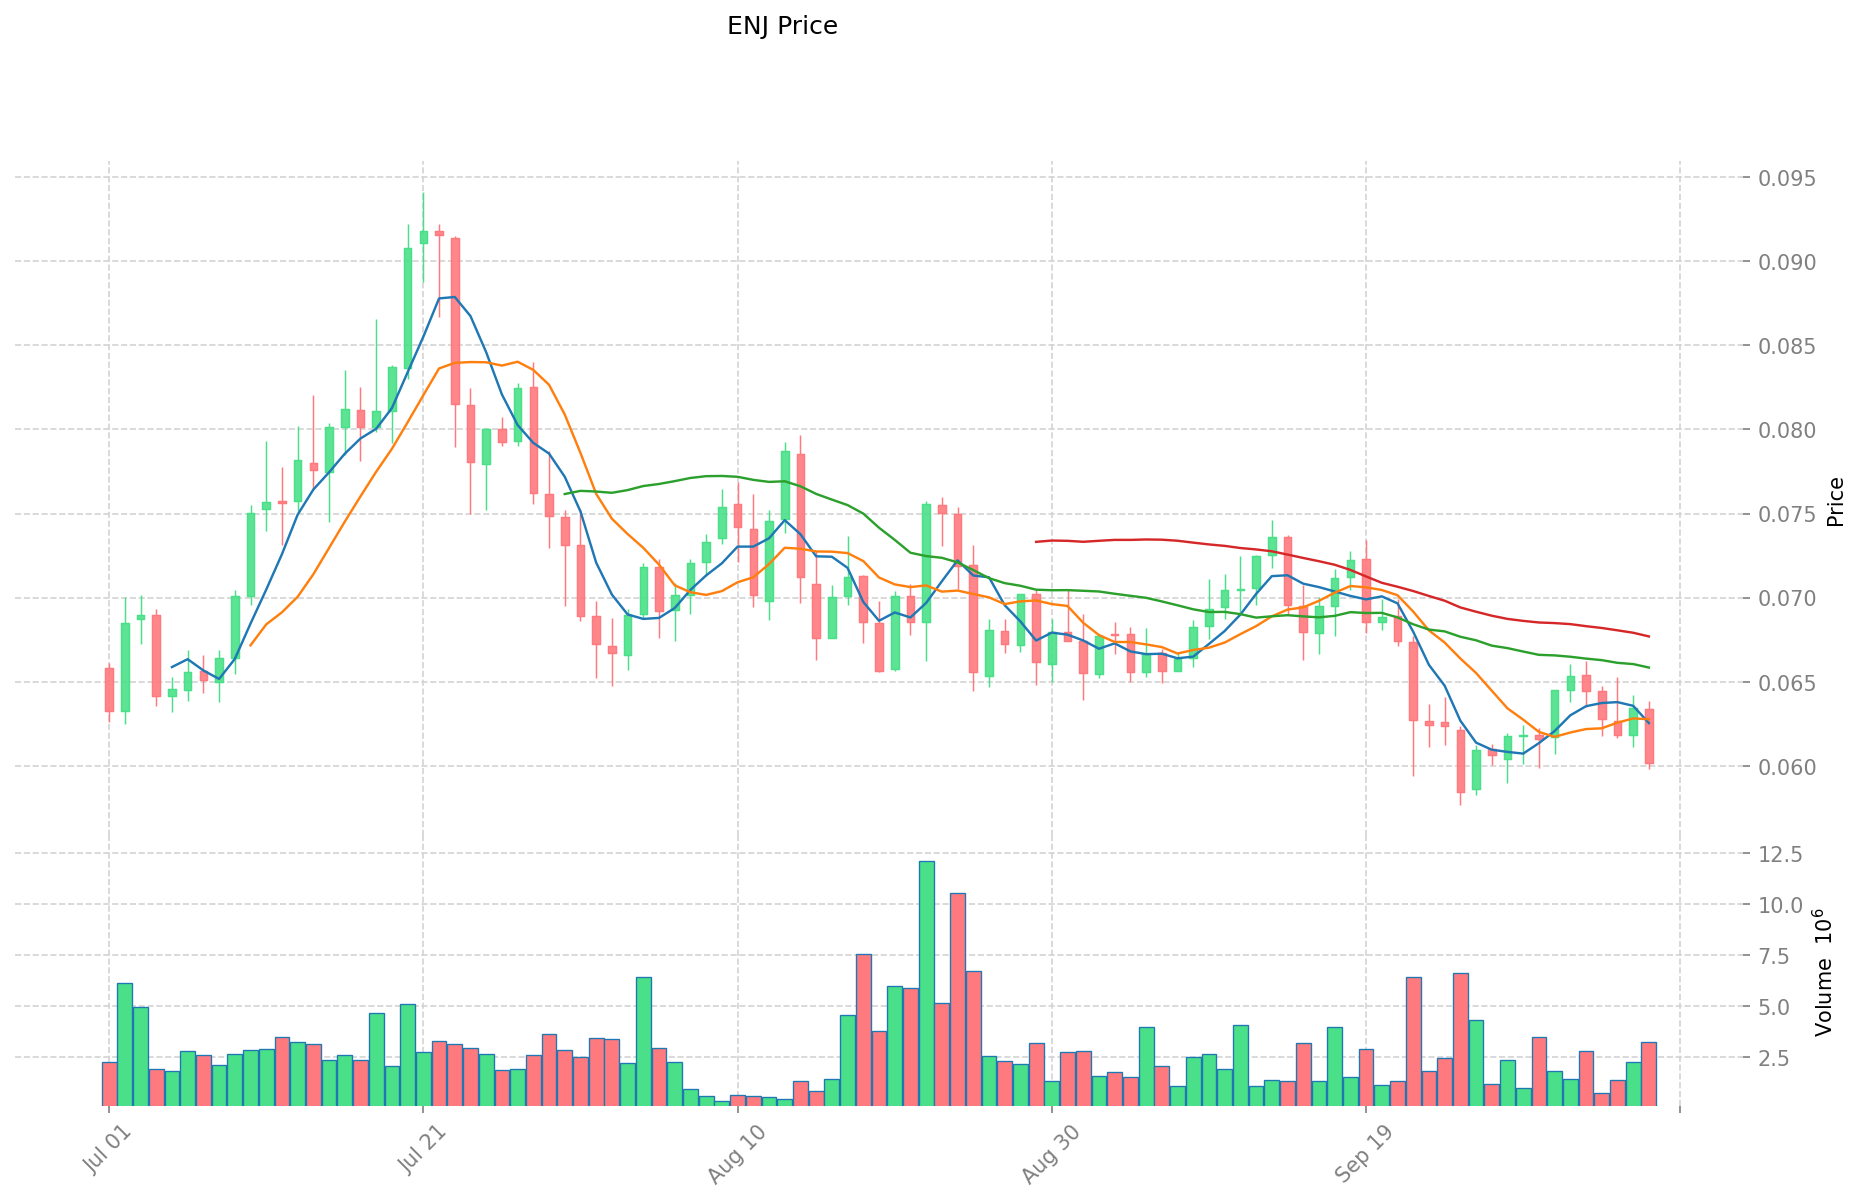
- 2021: ENJ ise 25 Kasım 2021'de 4,82 $ ile rekor kırdı.
- Karşılaştırma: Her iki coin de zirve fiyatlarından ciddi oranda geriledi; ZCX güncel olarak 0,01704 $, ENJ ise 0,06028 $ seviyesinde işlem görüyor.
Güncel Piyasa Durumu (08 Ekim 2025)
- ZCX güncel fiyat: 0,01704 $
- ENJ güncel fiyat: 0,06028 $
- 24 saatlik işlem hacmi: ZCX 14.198,92 $ | ENJ 199.327,29 $
- Piyasa Duyarlılık Endeksi (Korku ve Açgözlülük Endeksi): 70 (Açgözlülük)
Canlı fiyatlar için tıklayın:
- ZCX güncel fiyatı Piyasa Fiyatı
- ENJ güncel fiyatı Piyasa Fiyatı
II. ZCX ve ENJ Yatırım Değerini Belirleyen Temel Faktörler
Token Ekonomisi ve Arz Mekanizmaları (Tokenomics)
- Unizen (ZCX): Investing.com gibi platformlardan piyasa değeri izlenebilir, anlık fiyat takibi yapılabilir
- Enjin (ENJ): Kripto para takip platformları üzerinden işlem hacmi verileri görüntülenebilir
- 📌 Tarihsel Model: Piyasa değeri ve işlem hacmi, her iki varlığın fiyat hareketi ve yatırım döngülerini doğrudan belirler.
Kurumsal Benimseme ve Piyasa Uygulamaları
- Kurumsal Portföyler: Yatırımcı duyarlılığı, anlık grafikler ve işlem verilerine göre şekillenir
- Kurumsal Kullanım: Her iki kripto paranın değer önerisi, ekosistemlerinde benimsenme oranına bağlıdır
- Regülasyon: Düzenleyici çerçeveler, işlem hacmi ve piyasa erişimini etkiler
Teknolojik Gelişim ve Ekosistem Oluşturma
- Unizen (ZCX) Teknik Yenilikler: Yatırım kararları için anlık grafik analizi ve fiyat takip araçları sunar
- Enjin (ENJ) Teknik Gelişim: Topluluk desteği ve teknolojik yenilikler değerlemeye etki eder
- Ekosistem Karşılaştırması: Her iki kripto paranın performansı, özel takip platformlarıyla izlenebilir
Makroekonomik Faktörler ve Piyasa Döngüleri
- Enflasyon Döneminde Performans: Yatırımcı duyarlılığı, ekonomik dalgalanmalarda göreli değeri belirler
- Para Politikası Etkisi: Her iki varlığın piyasa eğilimleri, genel ekonomik gelişmelere tepki olarak şekillenir
- Jeopolitik Faktörler: Küresel ekonomik duyarlılıkla şekillenen piyasa koşullarına tabidirler
III. 2025-2030 Fiyat Tahmini: ZCX ve ENJ
Kısa Vadeli Tahmin (2025)
- ZCX: Muhafazakâr 0,011928 $ - 0,01704 $ | İyimser 0,01704 $ - 0,0201072 $
- ENJ: Muhafazakâr 0,0537293 $ - 0,06037 $ | İyimser 0,06037 $ - 0,0839143 $
Orta Vadeli Tahmin (2027)
- ZCX büyüme fazına geçebilir; beklenen fiyat aralığı 0,0120542664 $ ile 0,0230126904 $ arasında
- ENJ boğa piyasasına girebilir; beklenen fiyat aralığı 0,0634021285275 $ ile 0,10645295654 $ arasında
- Temel faktörler: Kurumsal sermaye girişi, ETF gelişmeleri, ekosistem büyümesi
Uzun Vadeli Tahmin (2030)
- ZCX: Temel senaryo 0,0281876691537 $ - 0,035516463133662 $ | İyimser senaryo 0,035516463133662 $ ve üzeri
- ENJ: Temel senaryo 0,135719065971363 $ - 0,179149167082199 $ | İyimser senaryo 0,179149167082199 $ ve üzeri
Yasal Uyarı: Bu tahminler, geçmiş verilere ve piyasa analizlerine dayanmaktadır. Kripto para piyasaları yüksek oynaklığa sahip olup hızlı şekilde değişebilir. Bu bilgiler yatırım tavsiyesi değildir. Her yatırım kararından önce kendi araştırmanızı yapın.
ZCX:
| Yıl | Tahmini Maksimum Fiyat | Tahmini Ortalama Fiyat | Tahmini Minimum Fiyat | Yüzdelik Değişim |
|---|---|---|---|---|
| 2025 | 0,0201072 | 0,01704 | 0,011928 | 0 |
| 2026 | 0,025260096 | 0,0185736 | 0,01114416 | 9 |
| 2027 | 0,0230126904 | 0,021916848 | 0,0120542664 | 28 |
| 2028 | 0,02471124612 | 0,0224647692 | 0,017073224592 | 31 |
| 2029 | 0,0327873306474 | 0,02358800766 | 0,0214650869706 | 38 |
| 2030 | 0,035516463133662 | 0,0281876691537 | 0,025650778929867 | 65 |
ENJ:
| Yıl | Tahmini Maksimum Fiyat | Tahmini Ortalama Fiyat | Tahmini Minimum Fiyat | Yüzdelik Değişim |
|---|---|---|---|---|
| 2025 | 0,0839143 | 0,06037 | 0,0537293 | 0 |
| 2026 | 0,0844063155 | 0,07214215 | 0,0396781825 | 19 |
| 2027 | 0,10645295654 | 0,07827423275 | 0,0634021285275 | 29 |
| 2028 | 0,1366981200746 | 0,092363594645 | 0,06927269598375 | 53 |
| 2029 | 0,156907274582926 | 0,1145308573598 | 0,099641845903026 | 89 |
| 2030 | 0,179149167082199 | 0,135719065971363 | 0,116718396735372 | 125 |
IV. Yatırım Stratejisi Karşılaştırması: ZCX ve ENJ
Uzun Vadeli ve Kısa Vadeli Yatırım Stratejileri
- ZCX: Borsa ekosistemindeki potansiyeli değerlendirmek isteyen yatırımcılar için uygun
- ENJ: Oyun ve NFT uygulamalarıyla ilgilenen yatırımcılar için cazip
Risk Yönetimi ve Varlık Dağılımı
- Temkinli yatırımcılar için: ZCX %30 | ENJ %70
- Agresif yatırımcılar için: ZCX %60 | ENJ %40
- Koruma araçları: Stablecoin kullanımı, opsiyon sözleşmeleri, çoklu para portföyleri
V. Potansiyel Risk Karşılaştırması
Piyasa Riskleri
- ZCX: Düşük piyasa değeri ve işlem hacmi nedeniyle yüksek dalgalanma riski
- ENJ: Oyun sektörü trendleri ve NFT piyasasındaki değişikliklerden etkilenebilir
Teknik Riskler
- ZCX: Ölçeklenebilirlik ve ağ istikrarı ile ilgili riskler
- ENJ: Akıllı kontrat açıkları ve ekosistem bağımlılıkları
Regülasyon Riskleri
- Küresel regülasyon politikaları iki varlığı farklı şekilde etkileyebilir; ENJ, oyun ve NFT ile bağlantısı nedeniyle daha fazla denetime tabi kalabilir
VI. Sonuç: Hangisi Daha Avantajlı?
📌 Yatırım Değeri Özeti:
- ZCX avantajları: Borsa tabanlı kullanım, ekosistem büyümesi potansiyeli
- ENJ avantajları: Oyun ve NFT alanında yerleşik ekosistem, yüksek işlem hacmi
✅ Yatırım Tavsiyesi:
- Yeni yatırımcılar: ENJ'nin daha oturmuş piyasa varlığı nedeniyle dengeli portföyde ENJ ağırlığı düşünülebilir
- Tecrübeli yatırımcılar: Her iki varlığın büyüme fırsatlarını değerlendirerek ZCX üzerine odaklanabilirler
- Kurumsal yatırımcılar: Her iki proje için detaylı inceleme yapmalı; ENJ'yi köklü ekosistemi, ZCX'i ise borsa potansiyeli açısından değerlendirmelidir
⚠️ Risk Uyarısı: Kripto para piyasası yüksek oynaklık taşır. Bu yazı yatırım tavsiyesi değildir. None
VII. Sıkça Sorulan Sorular
S1: ZCX ve ENJ arasındaki temel farklar nedir? C: ZCX, Ethereum üzerinde borsa temelli bir platform tokenıdır ve Binance BNB ile benzerlik gösterir. ENJ ise online oyun topluluklarına, içerik yönetim sistemlerine ve forum üreticilerine odaklanır.
S2: Hangi kripto paranın fiyatı daha yüksek? C: 08 Ekim 2025 itibarıyla ENJ'nin güncel fiyatı 0,06028 $ iken ZCX 0,01704 $'dır.
S3: ZCX ve ENJ'nin piyasa değerleri nasıl karşılaştırılır? C: Net piyasa değeri rakamları olmasa da ENJ, 24 saatlik daha yüksek işlem hacmiyle (ENJ 199.327,29 $, ZCX 14.198,92 $) daha büyük bir varlık görünümündedir.
S4: 2030 için ZCX ve ENJ'nin uzun vadeli fiyat projeksiyonu nedir? C: ZCX için temel senaryo 0,0281876691537 $ - 0,035516463133662 $, ENJ için ise 0,135719065971363 $ - 0,179149167082199 $ aralığındadır.
S5: Hangi coin kısa ve uzun vadeli yatırım için daha uygun? C: ZCX, borsa ekosistemi odaklı yatırımcılar için uygunken; ENJ, oyun ve NFT uygulamalarına ilgi duyanlar için daha iyi olabilir. Uzun vadeli planlarda iki projenin de büyüme potansiyeli dikkate alınmalıdır.
S6: ZCX ve ENJ yatırımında başlıca riskler nelerdir? C: ZCX, düşük piyasa değeri ve işlem hacmi nedeniyle yüksek volatilite riski taşır. ENJ ise oyun sektöründeki ve NFT piyasalarındaki dalgalanmalara açıktır. Her ikisi de teknik ve regülasyon kaynaklı riskler taşır.
S7: Portföy ZCX ve ENJ arasında nasıl dağıtılmalı? C: Temkinli yatırımcılar için %30 ZCX - %70 ENJ, agresif yatırımcılar için %60 ZCX - %40 ENJ önerilebilir. Portföy dağılımı, bireysel risk toleransı ve yatırım hedeflerine göre belirlenmelidir.
Share
Content
Giriş: ZCX ve ENJ Yatırım Karşılaştırması
I. Fiyat Geçmişi Karşılaştırması ve Güncel Piyasa Durumu
II. ZCX ve ENJ Yatırım Değerini Belirleyen Temel Faktörler
III. 2025-2030 Fiyat Tahmini: ZCX ve ENJ
IV. Yatırım Stratejisi Karşılaştırması: ZCX ve ENJ
V. Potansiyel Risk Karşılaştırması
VI. Sonuç: Hangisi Daha Avantajlı?
VII. Sıkça Sorulan Sorular
Trending Cryptocurrencies


ALU ve FLOW: Modern makine öğrenimi uygulamalarında farklı hesaplama mimarilerinin değerlendirilmesi

2025 ALU Fiyat Tahmini: Piyasa Analizi ve Alüminyum Emtiası Trendlerine Yönelik Gelecek Perspektifi

BTT ve ENJ: Blockchain sektöründe iki öncü oyun kripto parasının karşılaştırılması

Sekuya (SKYA) iyi bir yatırım mı?: Bu Yükselen Kripto Paranın Potansiyeli ve Risklerinin Analizi

RFUEL ve ENJ: Blockchain oyun sektörünün iki önde gelen tokeninin karşılaştırmalı analizi

FEAR (FEAR) yatırım için uygun mu?: Bu Kripto Para Tokeninin Potansiyeli ve Risklerine Dair Analiz

Web3 ve Merkeziyetsiz Finans dünyasında Spot Alım-Satımın Temelleri: Yeni Başlayanlar için Kapsamlı Rehber

Polkadot Ağında Uygulama Geliştirme Kılavuzu
Merkeziyetsiz borsalarda likidite havuzları hakkında kapsamlı bir rehber
Dogecoin Madenciliğini Verimli Şekilde Yapmak İçin Yeni Başlayanlar Rehberi

Proof-of-Stake Blockchain Teknolojisinin İşleyişini Anlamak