YFI vs ENJ: A Comparative Analysis of DeFi and NFT-Focused Cryptocurrencies
Introduction: YFI vs ENJ Investment Comparison
In the cryptocurrency market, YearnFinance (YFI) vs Enjin Coin (ENJ) comparison has always been an unavoidable topic for investors. The two not only have significant differences in market cap ranking, application scenarios, and price performance, but also represent different cryptocurrency asset positioning.
YearnFinance (YFI): Since its launch in 2020, it has gained market recognition for its aggregation platform for profit output data serving loan platforms.
Enjin Coin (ENJ): Launched in 2017, it has been hailed as a platform for creating virtual goods in gaming communities, becoming one of the pioneering projects in the blockchain gaming sector.
This article will comprehensively analyze the investment value comparison between YFI and ENJ, focusing on historical price trends, supply mechanisms, institutional adoption, technological ecosystems, and future predictions, attempting to answer the question investors are most concerned about:
"Which is the better buy right now?"
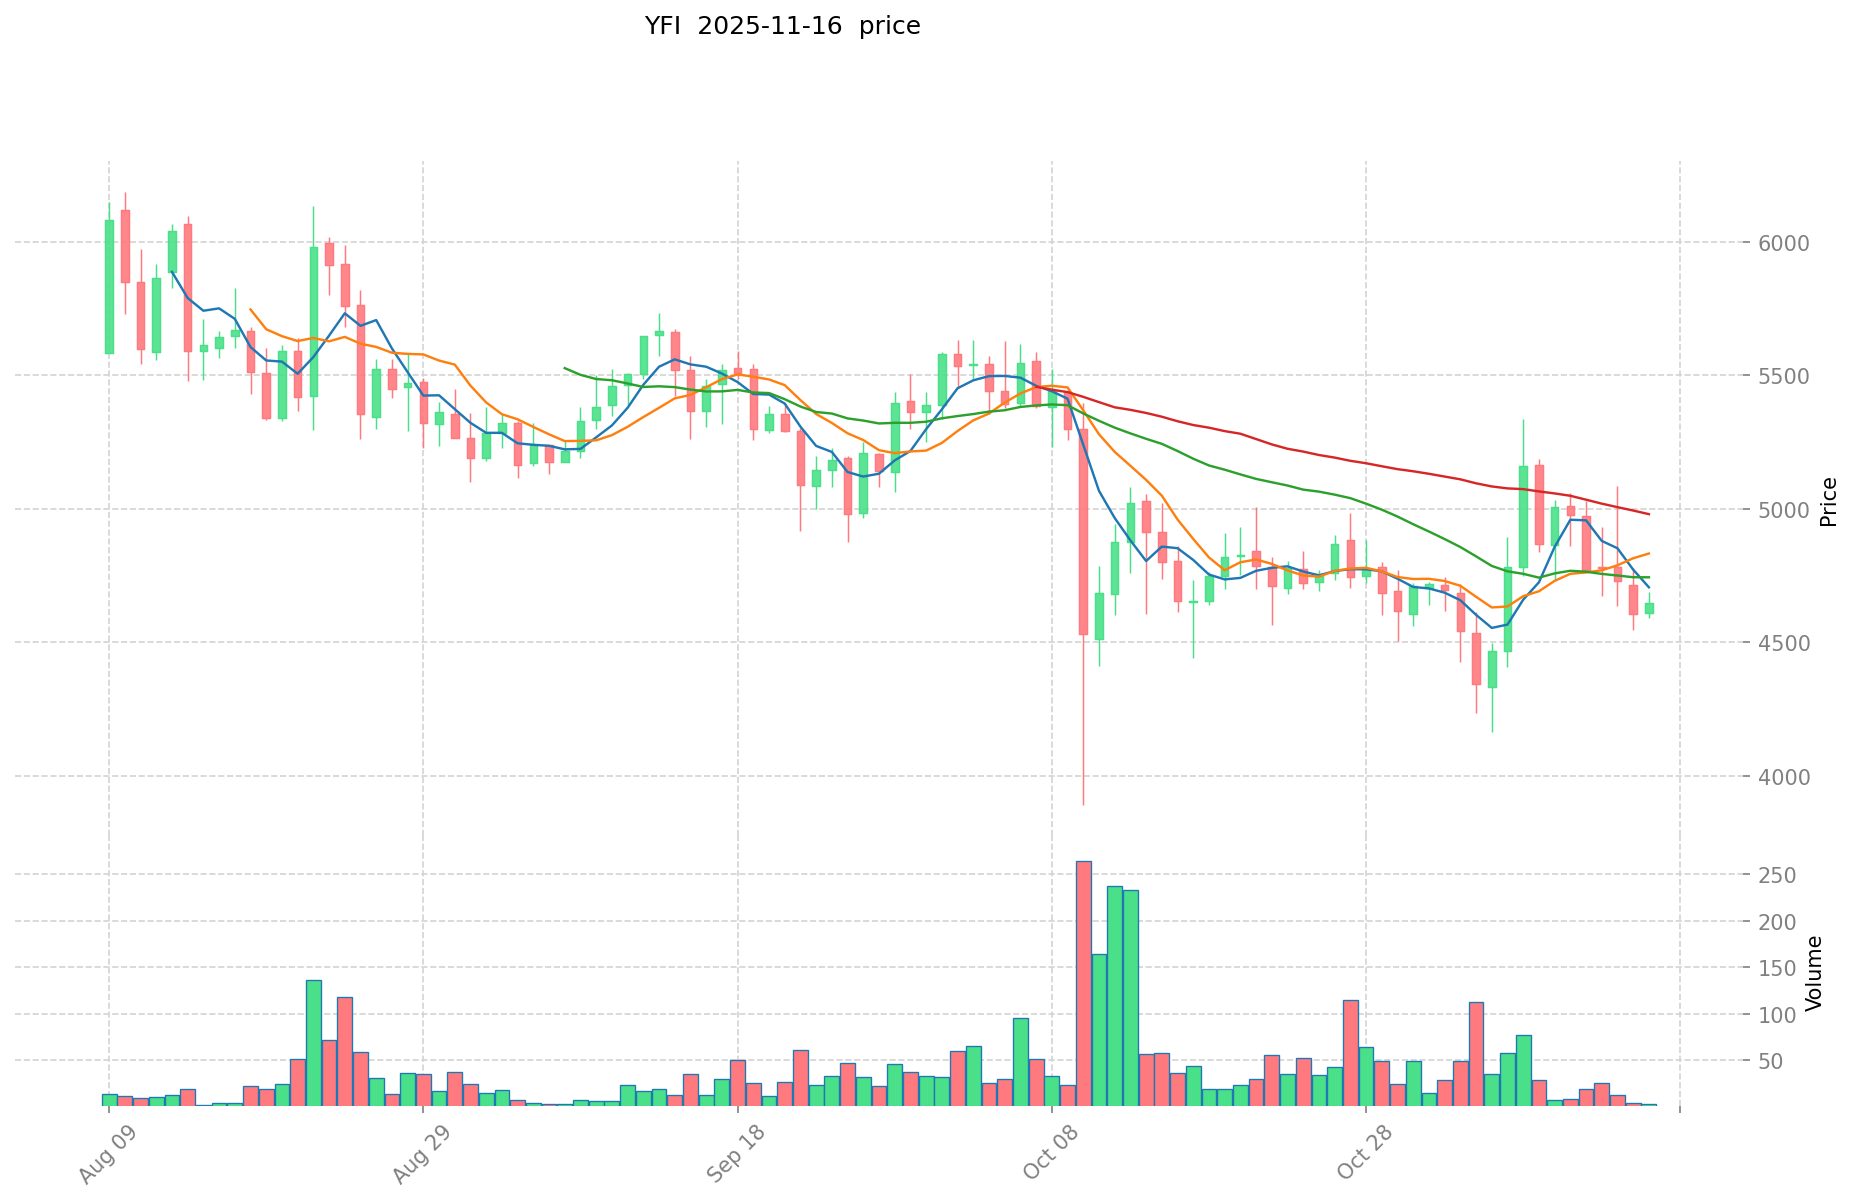
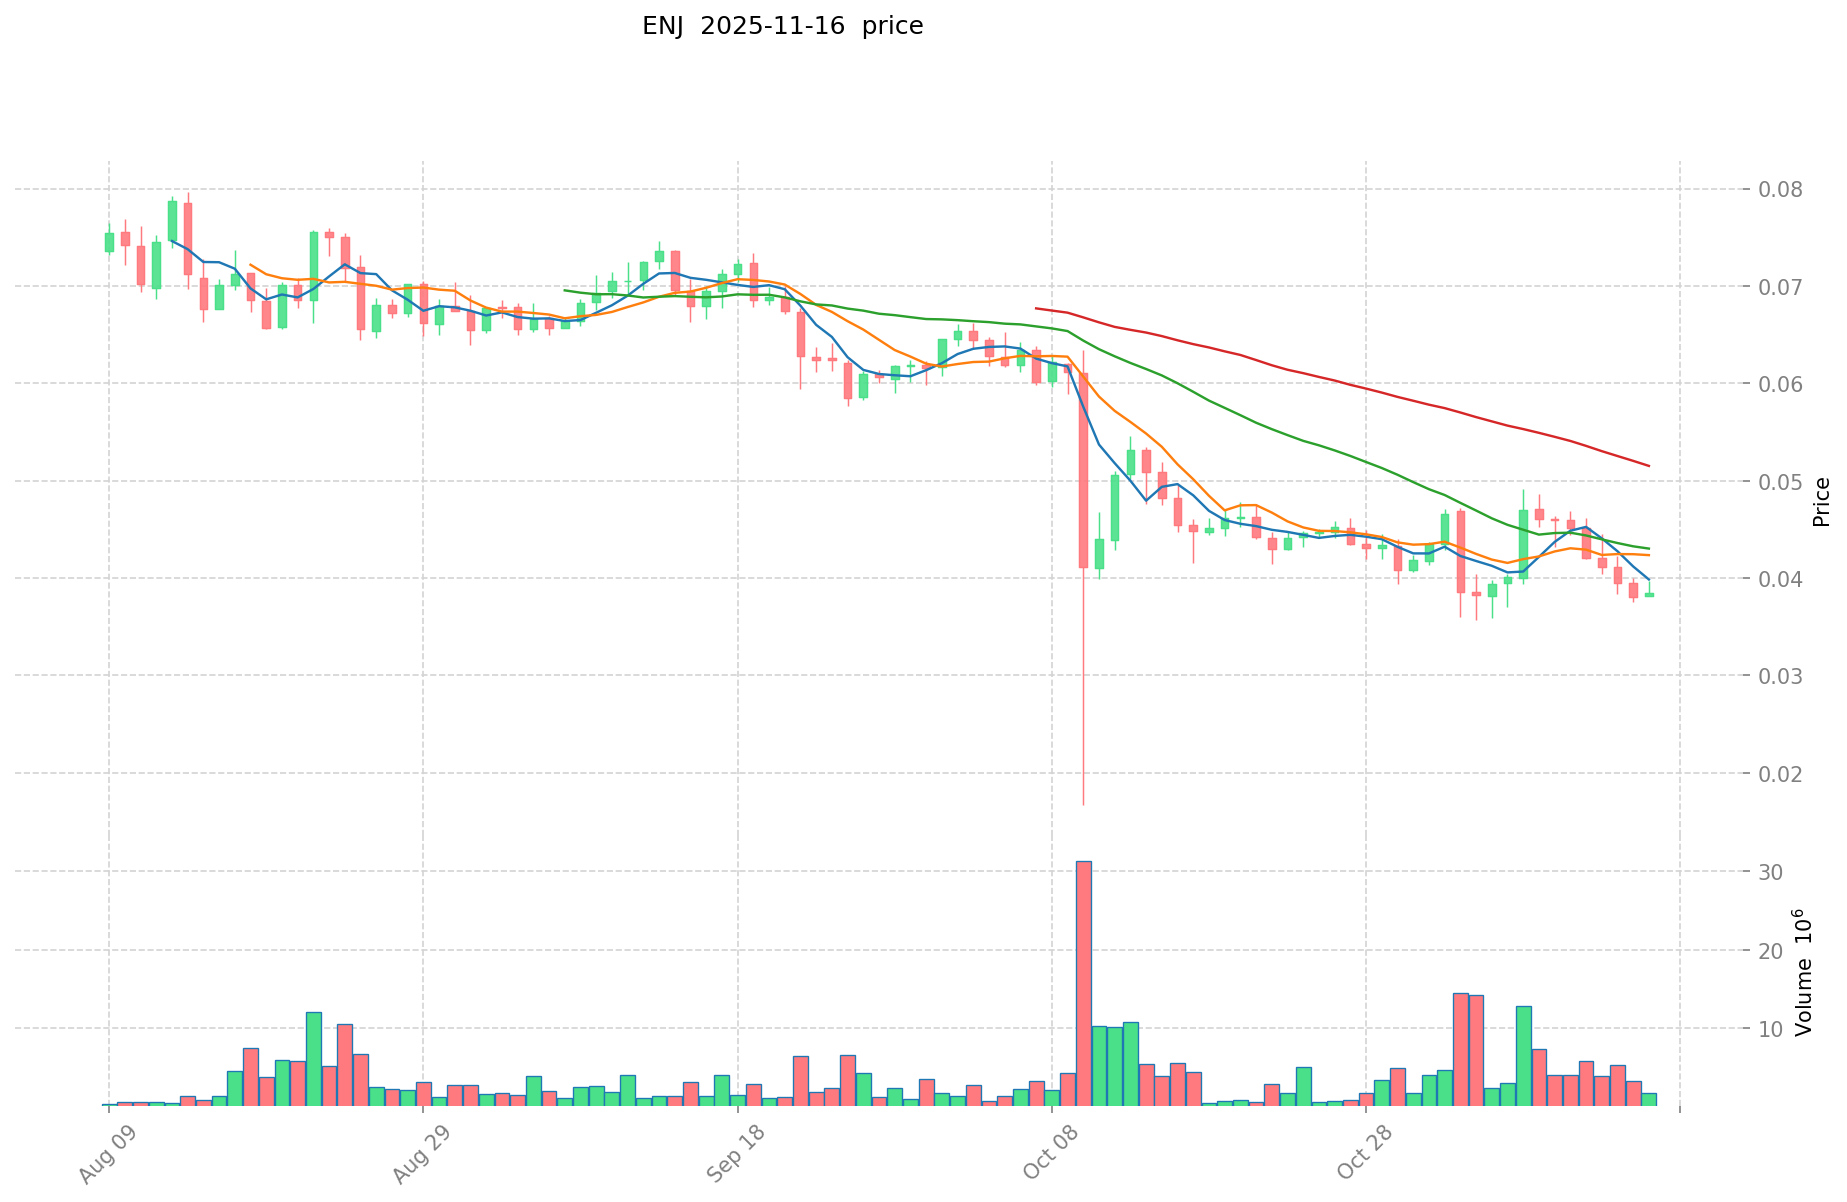
I. Price History Comparison and Current Market Status
YFI and ENJ Historical Price Trends
- 2021: YFI reached its all-time high of $90,787 on May 12, 2021.
- 2021: ENJ hit its peak price of $4.82 on November 25, 2021.
- Comparative analysis: In the current market cycle, YFI has dropped from its all-time high of $90,787 to the current price of $4,667, while ENJ has fallen from its peak of $4.82 to $0.03848.
Current Market Situation (2025-11-16)
- YFI current price: $4,667
- ENJ current price: $0.03848
- 24-hour trading volume: YFI $12,778,715 vs ENJ $70,615.77
- Market Sentiment Index (Fear & Greed Index): 10 (Extreme Fear)
Click to view real-time prices:
- Check YFI current price Market Price
- Check ENJ current price Market Price
II. Key Factors Affecting Investment Value of YFI vs ENJ
Supply Mechanism Comparison (Tokenomics)
- YFI: Fixed maximum supply of 36,666 tokens with no additional minting since its initial distribution
- ENJ: Total supply of 1 billion ENJ with deflationary mechanics through token locking in digital assets
- 📌 Historical pattern: YFI's extreme scarcity has historically created price volatility during market cycles, while ENJ's deflationary mechanism tied to asset creation provides gradual supply reduction.
Institutional Adoption and Market Applications
- Institutional holdings: YFI has gained more institutional interest due to its position in DeFi yield strategies
- Enterprise adoption: YFI focuses on institutional yield optimization while ENJ targets gaming industry integration and NFT infrastructure
- Regulatory attitudes: Both tokens face varied regulatory treatment, with YFI's DeFi focus attracting more regulatory scrutiny while ENJ's gaming applications have faced fewer immediate regulatory challenges
Technical Development and Ecosystem Building
- YFI technical upgrades: Implementation of v3 vaults, improved risk management, and cross-chain yield strategies
- ENJ technical development: Transition to Efinity parachain on Polkadot, improving scalability for gaming NFT applications
- Ecosystem comparison: YFI dominates in DeFi yield optimization with comprehensive vault strategies, while ENJ excels in gaming-focused NFT infrastructure and marketplace development
Macroeconomic Factors and Market Cycles
- Performance in inflationary environments: YFI's yield-generating capabilities potentially offer better inflation protection
- Macroeconomic monetary policy: Both tokens show high correlation with risk assets, with YFI displaying greater volatility during interest rate changes
- Geopolitical factors: YFI's decentralized finance applications may benefit from global financial instability, while ENJ's gaming focus makes it less sensitive to cross-border financial regulations
III. 2025-2030 Price Prediction: YFI vs ENJ
Short-term Prediction (2025)
- YFI: Conservative $2,738.19 - $4,641 | Optimistic $4,641 - $5,244.33
- ENJ: Conservative $0.0218766 - $0.03838 | Optimistic $0.03838 - $0.0445208
Mid-term Prediction (2027)
- YFI may enter a growth phase, with prices expected in the range of $3,758.90 - $6,881.67
- ENJ may enter a steady growth phase, with prices expected in the range of $0.0264 - $0.0645
- Key drivers: Institutional capital inflow, ETF developments, ecosystem growth
Long-term Prediction (2030)
- YFI: Base scenario $6,243.90 - $8,672.08 | Optimistic scenario $8,672.08 - $9,018.96
- ENJ: Base scenario $0.0423 - $0.0572 | Optimistic scenario $0.0572 - $0.0778
Disclaimer: This analysis is based on historical data and current market trends. Cryptocurrency markets are highly volatile and unpredictable. This information should not be considered as financial advice. Always conduct your own research before making investment decisions.
YFI:
| 年份 | 预测最高价 | 预测平均价格 | 预测最低价 | 涨跌幅 |
|---|---|---|---|---|
| 2025 | 5244.33 | 4641 | 2738.19 | 0 |
| 2026 | 6623.1711 | 4942.665 | 3459.8655 | 5 |
| 2027 | 6881.6724795 | 5782.91805 | 3758.8967325 | 23 |
| 2028 | 9435.1199444775 | 6332.29526475 | 5445.773927685 | 35 |
| 2029 | 9460.4491255365 | 7883.70760461375 | 4020.6908783530125 | 68 |
| 2030 | 9018.96149967813 | 8672.078365075125 | 6243.89642285409 | 85 |
ENJ:
| 年份 | 预测最高价 | 预测平均价格 | 预测最低价 | 涨跌幅 |
|---|---|---|---|---|
| 2025 | 0.0445208 | 0.03838 | 0.0218766 | 0 |
| 2026 | 0.045180936 | 0.0414504 | 0.028186272 | 7 |
| 2027 | 0.06454034532 | 0.043315668 | 0.02642255748 | 12 |
| 2028 | 0.0571636870596 | 0.05392800666 | 0.0382888847286 | 40 |
| 2029 | 0.058878597671388 | 0.0555458468598 | 0.038326634333262 | 44 |
| 2030 | 0.077808622281207 | 0.057212222265594 | 0.042337044476539 | 48 |
IV. Investment Strategy Comparison: YFI vs ENJ
Long-term vs Short-term Investment Strategies
- YFI: Suitable for investors focused on DeFi yield optimization and institutional-grade strategies
- ENJ: Suitable for investors interested in blockchain gaming and NFT infrastructure potential
Risk Management and Asset Allocation
- Conservative investors: YFI: 20% vs ENJ: 80%
- Aggressive investors: YFI: 60% vs ENJ: 40%
- Hedging tools: Stablecoin allocation, options, cross-currency portfolio
V. Potential Risk Comparison
Market Risks
- YFI: High volatility due to limited supply and DeFi market fluctuations
- ENJ: Dependence on gaming industry adoption and NFT market trends
Technical Risks
- YFI: Smart contract vulnerabilities, scalability challenges
- ENJ: Blockchain interoperability issues, gaming integration complexities
Regulatory Risks
- Global regulatory policies may have a more significant impact on YFI due to its DeFi focus, while ENJ may face less immediate scrutiny in the gaming sector
VI. Conclusion: Which Is the Better Buy?
📌 Investment Value Summary:
- YFI advantages: Scarcity, institutional interest, yield optimization potential
- ENJ advantages: Gaming industry integration, NFT infrastructure, deflationary mechanics
✅ Investment Advice:
- New investors: Consider a smaller allocation to ENJ as an entry point to blockchain gaming
- Experienced investors: Balanced portfolio with both YFI and ENJ, adjusting based on risk tolerance
- Institutional investors: Higher allocation to YFI for DeFi exposure, with ENJ as a diversification option
⚠️ Risk Warning: The cryptocurrency market is highly volatile. This article does not constitute investment advice. None
VII. FAQ
Q1: What are the main differences between YFI and ENJ? A: YFI focuses on DeFi yield optimization, while ENJ specializes in blockchain gaming and NFT infrastructure. YFI has a fixed supply of 36,666 tokens, whereas ENJ has a total supply of 1 billion with deflationary mechanics.
Q2: Which token has shown better price performance historically? A: YFI reached a higher all-time high of $90,787 in May 2021, compared to ENJ's peak of $4.82 in November 2021. However, both have experienced significant drops from their all-time highs.
Q3: How do the supply mechanisms of YFI and ENJ differ? A: YFI has a fixed maximum supply of 36,666 tokens with no additional minting. ENJ has a total supply of 1 billion tokens with a deflationary mechanism through token locking in digital assets.
Q4: Which token is more suitable for institutional investors? A: YFI has gained more institutional interest due to its position in DeFi yield strategies and may be more suitable for institutional investors focused on DeFi exposure.
Q5: What are the key risk factors for each token? A: YFI faces risks from high volatility, smart contract vulnerabilities, and potential regulatory scrutiny in the DeFi sector. ENJ's risks include dependence on gaming industry adoption, NFT market trends, and blockchain interoperability challenges.
Q6: How do the long-term price predictions compare for YFI and ENJ? A: By 2030, YFI is predicted to reach $6,243.90 - $9,018.96 in optimistic scenarios, while ENJ is expected to reach $0.0423 - $0.0778. However, these predictions are speculative and subject to market conditions.
Q7: What allocation strategy is recommended for different types of investors? A: Conservative investors might consider allocating 20% to YFI and 80% to ENJ, while aggressive investors might opt for 60% YFI and 40% ENJ. New investors may start with a smaller allocation to ENJ, while experienced investors could maintain a balanced portfolio of both tokens.
Share
Content
Introduction: YFI vs ENJ Investment Comparison
I. Price History Comparison and Current Market Status
II. Key Factors Affecting Investment Value of YFI vs ENJ
III. 2025-2030 Price Prediction: YFI vs ENJ
IV. Investment Strategy Comparison: YFI vs ENJ
V. Potential Risk Comparison
VI. Conclusion: Which Is the Better Buy?
VII. FAQ

